Curtin Business School School of Economics and Finance
The Compliance Costs of Value Added Tax for Businesses in
Botswana
Tshepiso Ketsoeletse Makara
This thesis is presented for the Degree of Doctor of Philosophy
of Curtin University
ii
DECLARATION
To the best of my knowledge, this thesis is original and contains no material that has been previously published by another person(s) except where due acknowledgement has been made. This thesis contains no material which has been accepted for the award of any other degree or diploma in any university.
Signature:
iii
ABSTRACT
This thesis is the first research study into tax compliance costs in Botswana, a diamond rich developing country in southern Africa. The author is not aware of any major comprehensive research study on tax compliance costs in the context of Botswana. The only available studies are those that have been conducted by the International Finance Corporation (IFC). The IFC studies estimated the tax compliance time of a hypothetical medium-sized business. This study thus qualifies as an original contribution to the tax compliance costs literature.
Value Added Tax (VAT) was first introduced in July 2002 at a rate of ten per cent, and this was increased to twelve per cent in April 2010. This study analyses the composition and distribution of gross and net VAT compliance costs and sets the findings in an international context. The VAT recurrent compliance costs for businesses in Botswana are derived for the financial years 2009/10 and 2010/11 based on questionnaire surveys. Average (gross) compliance costs are estimated to be P6,902 and P7,201, and aggregate compliance costs at P110 million and P169 million, for 2009/10 and 2010/11, respectively. Indicatively, these estimates are roughly around US$1,000 per business and US$17–23 million in aggregate. Overall, VAT compliance costs represent around 0.1 per cent of Gross Domestic Product (GDP) for both years and approximately 2.9 per cent and 3.6 per cent of VAT revenue in 2009/10 and 2010/11, respectively.
The research confirms the findings of international studies that the VAT compliance costs are inversely related to the business size. As a proportion of annual turnover, the average VAT compliance costs range from around 0.02 per cent for large businesses to 0.93 per cent for smaller businesses in both financial years. The VAT compliance costs of small businesses in Botswana are around 45 times those of larger businesses in both years. When the small business category is segregated further, the VAT compliance costs fall from 3.17 per cent for small enterprises (with an annual turnover below P500,000) to 0.02 per cent for larger ones (with an annual turnover above P5 million) in 2009/10, and range from 0.02 per cent for large businesses to 3.30 per cent for small businesses in 2010/11. In this case, the VAT compliance costs
iv of small businesses in Botswana become 159 and 165 times those of large businesses in the financial years 2009/10 and 2010/11, respectively.
Aggregate cash flow benefits are estimated at P61 million and P69 million for the financial years 2009/10 and 2010/11, respectively. These estimates represent around 0.6 per cent of GDP and about 1.6 per cent of VAT revenue for both years. Aggregate managerial benefits have been estimated at P79 million for 2009/10 and 95 million for 2010/11 representing around 0.8 per cent of GDP and about 2 per cent of VAT revenue for both years. After considering offsetting benefits, net VAT compliance costs for businesses in Botswana are estimated at negative P30 million for 2009/10 and P5 million for 2010/11. The findings of the study confirm the usual regressive pattern of tax compliance costs.
As regards policy recommendations, the government of Botswana should consider introducing an online VAT filing system to reduce queuing time and associated costs. In addition, the Botswana government should increase VAT return filing centres, especially in the outskirts of Gaborone, in order to reduce taxpayer travelling costs and congestion at the main Gaborone office. The frequency of VAT filing in Botswana is also a concern, especially for small businesses. Thus, a reduction of VAT filing frequency for small businesses, from bimonthly to quarterly would reduce their VAT compliance costs. Further, an increase in the registration threshold from its current P500,000 (US$61,500) could be considered by policy-makers if reducing VAT compliance costs still further is seen as a policy priority, although the effects of such a measure on VAT revenue would have to be carefully assessed.
v
DEDICATION
To my sons Ofile Makara Keatlegile Makara To my motherSiodorah Ntika Makara
To my late father
vi
ACKNOWLEDGEMENTS
I thank the Almighty God for enabling me to complete this thesis. I am grateful for the hand of God upon my life, which has kept me going during very difficult times.
I would also like to express my deepest gratitude to the people who are special to me and who have encouraged me throughout my doctorate study season. To my sons, Ofile and Keatlegile and my mother Siodorah, your love and inspiration have made this possible. To my late father, Solomon, thank you for instilling in me the desire to learn and to achieve great things. To my namesake, my late grandmother, thank you for teaching me from an early age that nothing is impossible if I put my heart and energy into it.
A special acknowledgement and expression of gratitude goes to my supervisor, Professor Jeff Pope, who gave me exceptional guidance in researching and writing up this thesis. Thank you for being patient with me during a personally challenging season and encouraging me to complete this study.
To my aunt, Dr Nthati Rametse, not only did you encourage me to undertake a doctorate study way back in 2006, you also supported me during my research and during difficult times. The support of your family is greatly appreciated.
vii The author of this thesis has co-authored a journal article, as the first named author, with Professor Jeff Pope. The contribution of this publication to this thesis is acknowledged and has been referenced accordingly. Any errors are the responsibility of the first named author. This publication is as follows:
Makara, T. & Pope, J. (2013). Estimates of the compliance costs of value added tax in Botswana. New Zealand Journal of Taxation Law and Policy, vol 19(3), pp. 183– 221.
viii
TABLE OF CONTENTS
DECLARATION ... ii ABSTRACT ... iii DEDICATION ... v ACKNOWLEDGEMENTS ... viTABLE OFCONTENTS ... viii
LIST OF TABLES ... xv
LIST OF FIGURES ... xxi
LIST OF ACRONYMS... xxii
CHAPTER 1: INTRODUCTION... 1
1.1Foreword ... 1
1.2 The Costs of Taxation ... 3
1.3 Overview of Tax Compliance Costs ... 5
1.3.1 Tax Compliance Costs Definition ... 5
1.3.2 Commencement, Transition and Recurrent Tax Compliance Costs ... 10
1.3.3 Tax Compliance Benefits ... 11
1.3.4 Gross and Net Costs ... 11
1.3.5 Tax Compliance Costs Research ... 12
1.3.6 Nature of Tax Compliance Costs ... 13
1.4 Main Objectives ... 15 1.4.1 Overview... 15 1.4.2 Research Approach... 16 1.4.3 Response Rates ... 17 1.4.4 Interpretation ... 17 1.4.5 Exchange Rates ... 18
1.5 Significance of this Study ... 19
ix
CHAPTER 2: DESIGN OF VALUE ADDED TAX AND BOTSWANA’S
TAX SYSTEM ... 22
2.1 Introduction ... 22
2.2 Background ... 22
2.3 Value Added Tax Design ... 25
2.3.1 Overview... 25
2.3.2 Value Added Tax Rate(s) ... 27
2.3.3 Exemptions ... 29
2.3.4 Value Added Tax Registration Threshold ... 30
2.3.5 Value Added Tax Design and Tax Compliance Costs ... 31
2.4 Overview of Botswana’s Tax System ... 32
2.4.1 Overview... 32
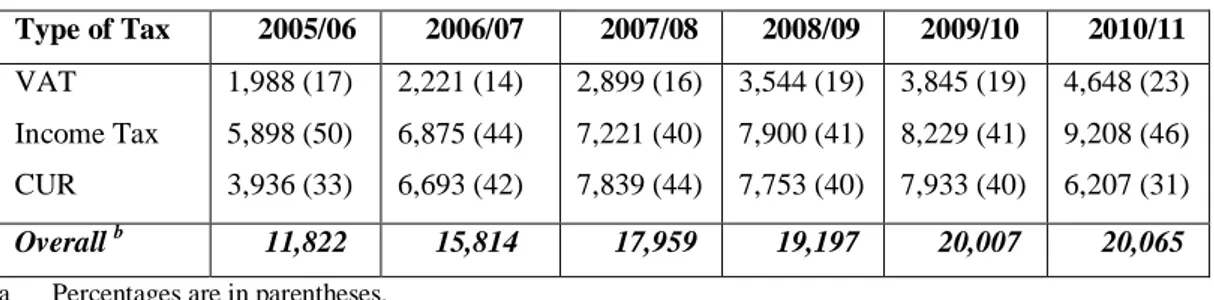
2.4.2 Tax Revenue Collections ... 34
2.4.3 Tax Revenue Growth ... 35
2.5 Value Added Tax in Botswana ... 36
2.5.1 Overview... 36
2.5.2 Value Added Tax Registration ... 37
2.5.3 Value Added Tax Filing ... 38
2.5.4 Taxable Goods and Services ... 39
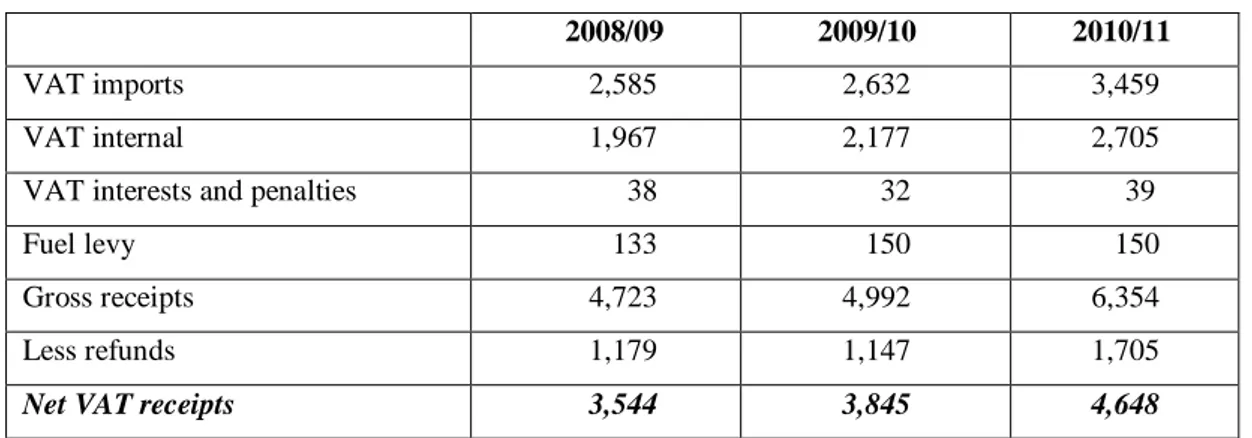
2.5.5 Value Added Tax Revenue ... 40
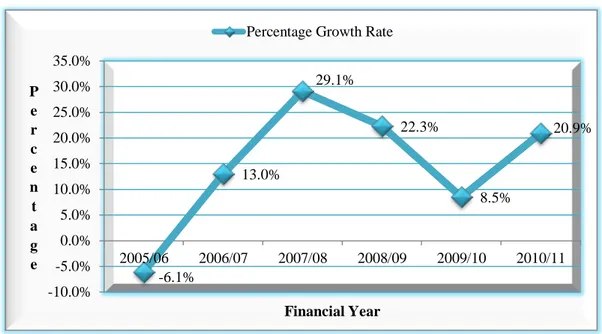
2.5.6 Value Added Tax Revenue Growth Rate ... 40
2.5.7 Major Value Added Tax Issues in Botswana ... 41
2.5.7a Non-Compliance ... 41
2.5.7b Queuing ... 42
2.6 Chapter Summary ... 43
CHAPTER 3:REVIEW OF TAX COMPLIANCE COSTS LITERATURE ... 45
3.1 Introduction ... 45
3.2 Overview of Tax Compliance Costs Studies ... 45
3.3 Tax Compliance Costs Studies, 1980s until 2013 ... 47
x
3.4.1 Overview... 54
3.4.2 Value Added Tax Compliance Costs Studies outside Africa, 1980 to 1999 ... 55
3.4.3 Value Added Tax Compliance Costs Studies outside Africa since 2000 ... 58
3.4.4 Value Added Tax Compliance Costs Studies in Africa ... 61
3.5 Studies of Value Added Tax Compliance Benefits ... 64
3.5.1 Cash Flow Benefits Studies ... 64
3.5.2 Studies of Managerial Benefits ... 65
3.6 Studies of Taxpayer Attitudes towards Taxation ... 67
3.7 Chapter Summary ... 69
CHAPTER 4: ESTIMATION ISSUES AND RESEARCH DESIGN ... 71
4.1 Introduction ... 71
4.2 Estimation Issues ... 71
4.2.1 Overview... 71
4.2.2 Tax Compliance Costs ... 72
4.2.3 Valuation of Business Taxpayers’ Time ... 74
4.2.4 Comparison of Tax Compliance Costs Estimates Across Different Countries ... 75
4.3 Research Approaches ... 75
4.3.1 Overview... 75
4.3.2 Quantitative Research Technique ... 76
4.3.3 Qualitative Research Technique ... 76
4.3.4 Mixed Method Approach ... 77
4.4 Compliance Costs Research Techniques ... 78
4.4.1 Overview... 78
4.4.2 Surveys ... 78
4.4.2a Questionnaire-based Mail Surveys ... 79
4.4.2b Electronic Surveys ... 80
4.4.3 Interviews... 81
4.4.3a Telephone Interviews ... 81
xi
4.4.4 Case Studies ... 82
4.4.5 Validity, Reliability and Representativeness ... 83
4.4.6 Response and Non-Response ... 84
4.4.7 Sample Size and Response Rate ... 87
4.4.8 The Sampling Process ... 89
4.4.9 Survey Design ... 90
4.4.10 Validation of Responses ... 92
4.4.11 Grossing-up of Tax Compliance Costs Estimates ... 93
4.5 Botswana Questionnaire Design ... 94
4.5.1 Survey Issues for Botswana ... 94
4.5.2 Questionnaire Contents... 95
4.6 Botswana Questionnaire Administration... 98
4.6.1 Pilot Test ... 98
4.6.2 Distribution of the Questionnaires ... 99
4.6.3 Reminder System and Questionnaire Collection ... 100
4.7 Data Analysis ... 102
4.7.1 Overview... 102
4.7.2 Statistical Analysis ... 102
4.8 Research Limitations ... 103
4.8.1 Questionnaire Delivery and Collection ... 103
4.8.2 Data Limitations from Botswana Unified Revenue Service ... 104
4.9 Chapter Summary ... 104
CHAPTER 5: SURVEY RESPONSE RESULTS ... 106
5.1 Introduction ... 106
5.2 Sample and Response Rate ... 106
5.3 Profile of Respondents ... 110
5.4 Compliance Time ... 122
5.5 Chapter Summary ... 127
CHAPTER 6: VALUE ADDED TAX COMPLIANCE COSTS: ESTIMATES AND FINDINGS ... 129
xii
6.1 Introduction ... 129
6.2 Estimation of Tax Compliance Costs ... 129
6.2.1 Overview... 129
6.2.2 Internal Costs ... 130
6.2.3 Distribution of Internal Compliance Costs ... 131
6.2.4 External Costs ... 137
6.2.5 Compliance Costs Analysis by Internal-External Ratio ... 138
6.3 Mean Value Added Tax Compliance Costs ... 138
6.3.1 Overview... 138
6.3.2 Statistical Comparative Analysis of Means ... 140
6.3.3 Distribution of Value Added Tax Gross Compliance Costs ... 141
6.3.4 Value Added Tax Compliance Costs by Other Business Traits ... 147
6.4 Aggregate Compliance Costs of VAT ... 153
6.4.1 Overview... 153
6.4.2 Aggregate Value Added Tax Compliance Costs as a Proportion of Gross Domestic Product, Tax Revenue and Value Added Tax Revenue ... 155
6.5 Possible Fair Compensation Claims from Botswana Unified Revenue Service ... 156
6.6 Chapter Summary ... 158
CHAPTER 7: TAX COMPLIANCE BENEFITS AND NET COMPLIANCE COSTS OF VALUE ADDED TAX ... 160
7.1 Introduction ... 160
7.2 Cash Flow Benefits/Costs... 161
7.2.1 Background ... 161
7.3 Estimation of Cash Flow Benefits ... 162
7.3.1 Overview... 162
7.3.2 Estimation of Cash Flow Benefits of Value Added Tax for Businesses in Botswana ... 163
7.4Cash Flow Benefits for Businesses in Botswana ... 165
7.4.1 Outline ... 165
xiii
7.6 Perceived Managerial Benefits ... 169
7.6.1 Overview... 169
7.6.2 Aggregate Values of Managerial Benefits ... 172
7.6.3 Qualitative Managerial Benefits Responses ... 174
7.6.4 Key Qualitative Managerial Benefit Responses ... 174
7.7 Net Compliance Costs ... 176
7.7.1 Overview... 176
7.8 Chapter Summary ... 177
CHAPTER 8: TAXPAYER ATTITUDES TOWARDS VALUE ADDED TAX IN BOTSWANA ... 180
8.1 Introduction ... 180
8.2 Measurement of Attitudes ... 181
8.2.1 Overview... 181
8.2.2 Assessment of Reliability ... 182
8.3 Taxpayer Attitudes towards Value Added Tax in Botswana ... 184
8.3.1 Overview... 184
8.4 Attitudes in Relation to Compliance Costs ... 187
8.4.1 Overview... 187
8.5 The Attitudes of Taxpayers by other Aspects of the Business ... 190
8.5.1 Attitudes by Size ... 190
8.5.2 Attitudes by Botswana Unified Revenue Service Classification ... 192
8.5.3 Attitudes by the Sale of Standard, Zero Rated and Exempt Goods and Services ... 194
8.5.4 Attitudes by Location ... 195
8.5.5 Attitudes by Value Added Tax Registration ... 196
8.6 Comments and Suggestions Concerning Botswana’s Value Added Tax System... 198
8.7 Chapter Summary ... 200
CHAPTER 9: CONCLUSIONS AND POLICY RECOMMENDATIONS ... 202
xiv
9.1 Introduction ... 202
9.2 Overview of this Study’s Research ... 203
9.3 Overview of Key Findings ... 205
9.3.1 Gross Compliance Costs Estimates ... 205
9.3.2 Economies of Scale Effect ... 209
9.3.3 Possible Fair Compensation... 210
9.3.4 Cash Flow and Managerial Benefits ... 211
9.3.5 Net Compliance Costs ... 211
9.3.6 Taxpayers’ Attitudes ... 212
9.4 International Comparisons... 215
9.5 Value Added Tax Simplification and Minimisation of Compliance Costs ... 216
9.5.1 Incidence of Taxation ... 216
9.5.2 Key Policy Recommendations for the Reduction of Tax Compliance Costs ... 217
9.5.3 Future Tax Compliance Costs Studies ... 218
9.6 Summing Up ... 218
REFERENCES ... 219
APPENDICES ... 235
Appendix A: 2009/10 Questionnaire and Accompanying Letter ... 236
Appendix B: 2010/11 Questionnaire and Accompanying Letter ... 243
Appendix C: The number of enumerated establishments by economic activity ... 250
Appendix D: Summary of Business Tax Compliance Costs Studies, 1980 until 2013 ... 252
Appendix E: Summary of Value Added Tax Compliance Costs Studies since 1980 ... 261
Appendix F: Mean Internal Value Added Tax Compliance Costs by Annual Turnover ... 267
Appendix G: Distribution of External Costs ... 270
Appendix H: Mean Gross Value Added Tax Compliance Costs as a Percentage of Annual Turnover ... 277
xv
LIST OF TABLES
Table 1.1: Research Questions ...16
Table 2.1: Elements of a Conceptually Simple VAT System ...27
Table 2.2: Major Types of Compliance Risks in a Conceptually Simple Value Added Tax System ...32
Table 2.3: Botswana Tax Revenue Collection by Tax Type (P Million) ...34
Table 2.4: Value Added Tax Registered Businesses by Botswana Unified Revenue Service Classification ...38
Table 2.5: Value Added Tax Revenue by Source (P Million), 2009–2011 ...40
Table 3.1: Allocation of Internal Compliance Costs to each Tax, Years 2010 and 2011, (Expressed in US$) ...53
Table 3.2: Total Tax Compliance Costs, Years 2010 and 2011, (Expressed in US$)...53
Table 4.1: Elements Incorporated in the Questionnaires for Botswana...98
Table 5.1: Survey Responses ... 107
Table 5.2: Unusable Responses ... 107
Table 5.3: Perception of the Level of Compliance Costs for the Year 2009/10 ... 108
Table 5.4: Value Added Tax Registered Businesses by Botswana Unified Revenue Service Classification ... 109
Table 5.5: Position of the Person who Undertook Value Added Tax Work ... 109
Table 5.6: Position of ‘Other’ Respondents who Undertook Value Added Tax Work, 2010/11 ... 110
Table 5.7: Respondents by Legal Structure ... 110
Table 5.8: Respondents by Length of Operation ... 111
Table 5.9: Respondents by Business Activity ... 111
Table 5.10: Respondents by Number of Years the Business has been Registered for Value Added Tax... 112
Table 5.11: Respondents by Main Place of Business Operation ... 112
Table 5.12: Respondents by Annual Business Turnover ... 113
Table 5.13: Respondents by Business Size Classification ... 113
Table 5.14: Sample Response by Botswana Unified Revenue Service Classification... 114
xvi
Table 5.15: Respondents by Financial Year-End ... 115
Table 5.16: Respondents by Number of Employees... 115
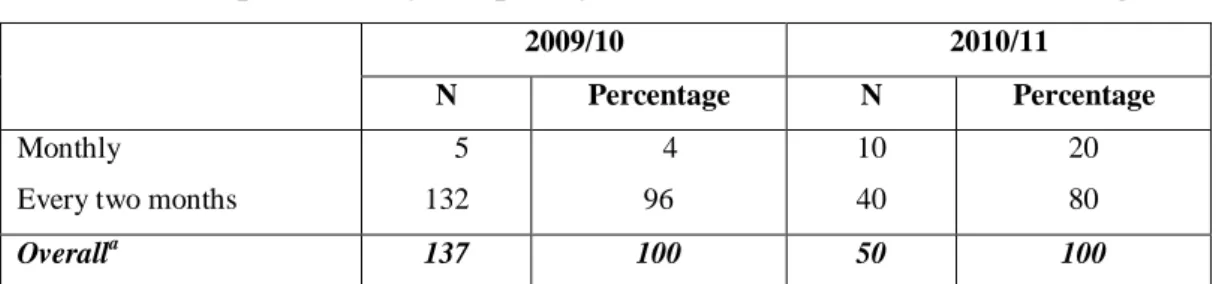
Table 5.17: Respondents by Frequency of Value Added Tax Return Filing ... 116
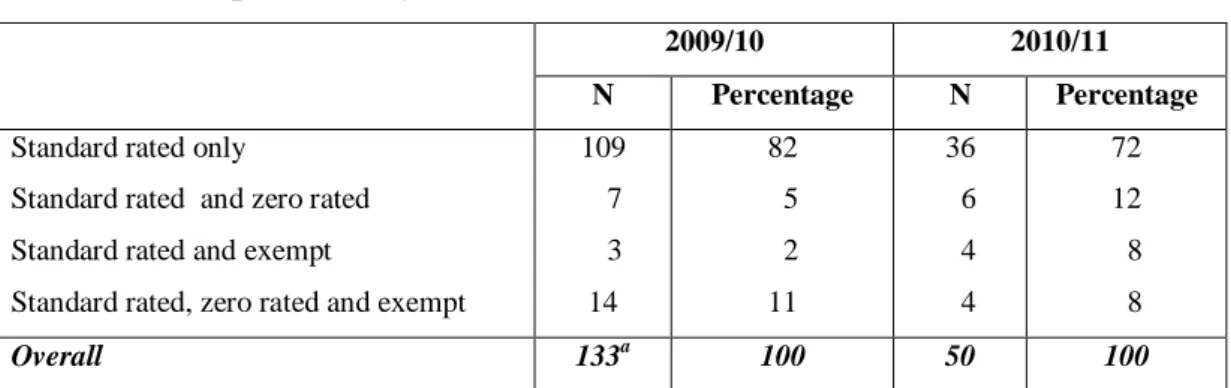
Table 5.18: Respondents by Classification of Sales ... 116
Table 5.19: Respondents by Classification of Purchases ... 117
Table 5.20: Respondents by Number of Monthly Value Added Tax Invoices Processed, 2009/10 ... 117
Table 5.21: Respondents by Number of Monthly Value Added Tax Invoices Processed, 2010/11 ... 118
Table 5.22: Respondents by Manner of Keeping Accounting Records ... 118
Table 5.23: Respondents by Manner of Value Added Tax Return Completion ... 119
Table 5.24: Respondents by Use of External Tax Adviser for Value Added Tax Work ... 119
Table 5.25: Reasons for Using External Tax Adviser for Value Added Tax Work ... 120
Table 5.26: Areas Where External Value Added Tax Advice is required ... 121
Table 5.27: Reasons for Not Employing External Tax Advice for Value Added Tax ... 122
Table 5.28: Respondents by Tax Officer Visit ... 122
Table 5.29: Mean Yearly Hours Spent On Value Added Tax Activities by Staff Categories, 2009/10 ... 123
Table 5.30: Mean Yearly Hours Spent On Value Added Tax Activities by Staff Categories, 2010/11 ... 124
Table 5.31: Personnel Mean Compliance Time (Hours) by Business Turnover, 2009/10 ... 125
Table 5.32: Personnel Mean Compliance Time by Business Turnover, 2010/11 ... 125
Table 5.33: Average Hourly Wage Rates by Staff Categories, 2009/10 ... 126
Table 5.34: Average Hourly Wage Rates by Staff Categories, 2010/11 ... 126
Table 6.1: Mean Internal Value Added Tax Compliance Costs, 2009/10 ... 131
Table 6.2: Mean Internal Value Added Tax Compliance Costs, 2010/11 ... 131
Table 6.3: Mean Internal Value Added Tax Compliance Costs by Staff Category ... 132
xvii Table 6.4: Mean Internal Value Added Tax Compliance Costs by Annual
Turnover ... 132
Table 6.5: Mean Internal Value Added Tax Compliance Costs by Botswana Unified Revenue Service Classification ... 133
Table 6.6: Mean Internal Costs as a Percentage of Annual Turnover ... 133
Table 6.7: Mean Internal Value Added Tax Compliance Costs by Legal Structure ... 134
Table 6.8: Mean Internal Value Added Tax Compliance Costs by Operation Length ... 135
Table 6.9: Mean Internal Value Added Tax Compliance Costs by Main Business Activity ... 135
Table 6.10: Mean Internal Value Added Tax Compliance Costs by Registration Length ... 136
Table 6.11: Mean Internal Value Added Tax Compliance Costs by Place of Operation ... 136
Table 6.12: Mean Internal Value Added Tax Compliance Costs by Number of Employees ... 137
Table 6.13: Mean Tax Adviser Fees, 2009/10 and 2010/11 ... 138
Table 6.14: Mean Internal-External Compliance Costs Ratio by Turnover, 2009/10 and 2010/11 ... 138
Table 6.15: Mean Value Added Tax Compliance Costs, 2009/10 and 2010/11 ... 139
Table 6.16: Values of Skewness and Kurtosis for Normality Test ... 140
Table 6.17: Levene Test of Homogeneity of Variance ... 141
Table 6.18: Mean Value Added Tax Compliance Costs by Turnover, 2009/10 ... 142
Table 6.19: Mean Value Added Tax Compliance Costs by Turnover, 2010/11 ... 142
Table 6.20: Mean Value Added Tax Compliance Costs by Botswana Unified Revenue Service Classification ... 143
Table 6.21: Mean Value Added Tax Compliance Costs by Legal Structure ... 143
Table 6.22: Mean Value Added Tax Compliance Costs by Business Activity ... 144
Table 6.23: Mean Value Added Tax Compliance Costs by Place of Operation ... 145
Table 6.24: Mean Value Added Tax Compliance Costs by Business Operation Length ... 145
Table 6.25: Mean Value Added Tax Compliance Costs by Value Added Tax Registration Length ... 146
xviii Table 6.26: Mean Value Added Tax Compliance Costs by Number of
Employees ... 146
Table 6.27: Mean Value Added Tax Compliance Costs by Frequency of Value Added Tax Returns Submission... 148
Table 6.28: Mean Compliance Costs by Use of External Tax Adviser for Value Added Tax Work ... 148
Table 6.29: Mean Value Added Tax Compliance Costs by Manner of Value Added Tax Returns Completion ... 149
Table 6.30: Mean Value Added Tax Compliance Costs by Classification of Sales... 150
Table 6.31: Mean Value Added Tax Compliance Costs by Classification of Purchases ... 151
Table 6.32: Mean Value Added Tax Compliance Costs by Number of Monthly Value Added Tax Invoices ... 152
Table 6.33: Mean Value Added Tax Compliance Costs by Record Keeping Manner, 2009/10 ... 152
Table 6.34: Mean Value Added Tax Compliance Costs by Tax Officers Visit ... 153
Table 6.35: Aggregate Value Added Tax Compliance Costs by Botswana Unified Revenue Service Classification, 2009/10 ... 154
Table 6.36: Aggregate Value Added Tax Compliance Costs by Botswana Unified Revenue Service Classification, 2010/11 ... 155
Table 6.37: Aggregate Value Added Tax Compliance Costs as a Proportion of Gross Domestic Product and Value Added Tax Revenue ... 156
Table 6.38: Pula Amounts that would be claimed as Fair Compensation by Turnover, 2009/10 ... 157
Table 6.39: Pula Amounts that would be claimed as Fair Compensation by Turnover, 2010/11 ... 158
Table 7.1: Equations for Estimating Cash Flow Benefits ... 164
Table 7.2: Factors for Calculating Value Added Tax Cash flow Benefits ... 165
Table 7.3: Cash Flow Benefits and Costs for Businesses in Botswana ... 166
Table 7.4: Cash Flow Benefits as a Proportion of Aggregate Value Added Tax Compliance Costs ... 167
xix Table 7.5: Cash Flow Benefits as a Proportion of Gross Domestic Product
and Value Added Tax Revenue ... 168
Table 7.6: Record Keeping Benefits by the Size of the Business ... 169
Table 7.7: Perceived Managerial Benefits by Botswana Unified Revenue Service Classification ... 170
Table 7.8: Compliance Costs by Perception of Record Keeping Benefits ... 170
Table 7.9: Mean Estimates of the Value of Managerial Benefits by the Size of the Business ... 171
Table 7.10: Value of Managerial Benefits by Botswana Unified Revenue Service Classification ... 172
Table 7.11: Aggregate Values of Managerial Benefits for Businesses in Botswana... 173
Table 7.12: Overall Managerial Benefits as a Proportion of Gross Domestic Product and Value Added Tax Revenue... 174
Table 7.13: How Record Keeping for Value Added Tax Benefits Businesses in Botswana... 174
Table 7.14: Net Value Added Tax Compliance Costs for Businesses in Botswana... 177
Table 8.1: Attitudinal Statements ... 182
Table 8.2: Rules of Thumb about Cronbach-Alpha Coefficient Size ... 183
Table 8.3: Internal Reliability of Responses to the Attitudinal Statements ... 183
Table 8.4: Taxpayer Attitudes towards Value Added Tax in Botswana (Burden Aspect) ... 185
Table 8.5: Taxpayer Attitudes towards Value Added Tax in Botswana (Simplicity Aspect) ... 186
Table 8.6: Taxpayer Perceptions in Relation to Tax Compliance Benefits ... 187
Table 8.7: Taxpayer Compliance Costs by Attitudes ... 189
Table 8.8: Taxpayer Compliance Costs by Perceptions of Benefits ... 190
Table 8.9: Taxpayer Attitudes by the Size of the Business ... 191
Table 8.10: Taxpayer Perceptions of the Benefits by the Size of the Business ... 192
Table 8.11: Taxpayer Attitudes by Botswana Unified Revenue Service Classification... 193
Table 8.12: Perceptions of the Benefits by Botswana Unified Revenue Service Classification... 194
xx Table 8.13: Taxpayer Attitudes by Value Added Taxable and Tax Free Sales ... 195 Table 8.14: Taxpayer Attitudes by the Location of the Business ... 196 Table 8.15: Taxpayer Attitudes by the Number of Value Added Tax
Registration Years ... 197 Table 8.16: Adequacy of Government Resources in Support of Value Added
Taxpayers ... 198 Table 8.17: If Resources are not Adequate, what is Lacking?
(Critical Comments) ... 198 Table 8.18: Favourable Comments on Value Added Tax ... 199 Table 8.19: Taxpayer Suggestions for the Improvement of Value Added Tax ... 200 Table 9.1: Aggregate Value Added Tax Compliance Costs by Botswana
Unified Revenue Service Classification, 2009/10 ... 206 Table 9.2: Aggregate Value Added Tax Compliance Costs as a Proportion
of Gross Domestic Product and Value Added Tax Revenue ... 206 Table 9.3: Mean Value Added Tax Compliance Costs by Turnover, 2009/10 ... 210 Table 9.4: Net Value Added Tax Compliance Costs for Businesses in
xxi
LIST OF FIGURES
Figure 1.1: The Costs of Taxation ... 4
Figure 1.2: Economic Compliance Costs of Business Taxation ... 8
Figure 2.1: The Number of Countries with/without a Value Added Tax System in 2009 ...24
Figure 2.2: Value Added Tax Win-Win Taxation Model ...26
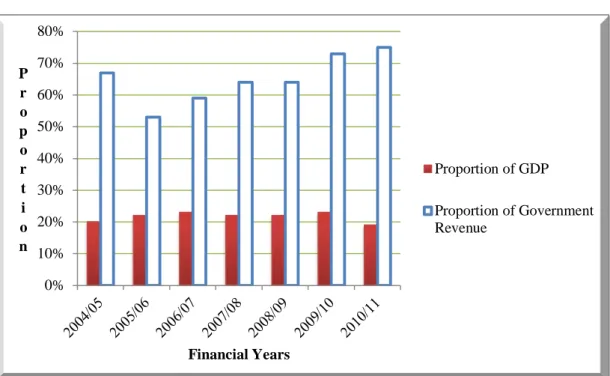
Figure 2.3: Tax Revenue as a Proportion of Gross Domestic Product and Government Revenue ...35
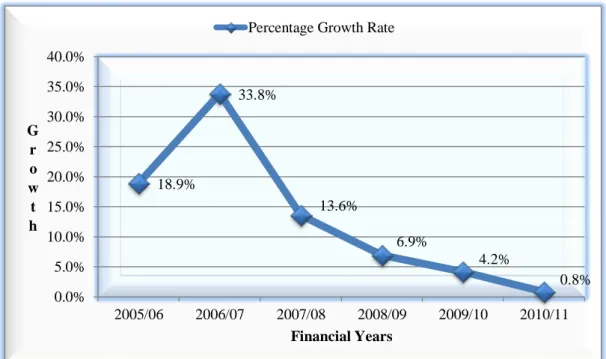
Figure 2.4: Total Tax Revenue Percentage Growth Rate ...36
Figure 2.5: Value Added Tax Revenue Growth Rate ...41
Figure 6.1: Value Added Tax Compliance Costs, 2009/10 and 2010/11 ... 140
Figure 6.2: Mean Value Added Tax Compliance Costs by Business Activity, 2009/10 and 2010/11 ... 144
Figure 6.3: Mean Value Added Tax Compliance Costs by Number of Employees, 2010/11 ... 147
Figure 6.4: Percentage Proportions of Aggregate Value Added Tax Compliance Costs to Gross Domestic Product and Value Added Tax Revenue ... 156
xxii
LIST OF ACRONYMS
ADBG African Development Bank Group
AEO African Economic Outlook
ATAX Australian Taxation Studies Program, University of New
South Wales
ATO Australian Taxation Office
BCCS Business Compliance Cost Statement
BIDPA Botswana Institute for Development Policy Analysis
BURS Botswana Unified Revenue Service
CEE Census of Enterprises and Establishments
CEP Coordinated Examination Program
CFIB Canadian Federation of Independent Business
CIA Central Intelligence Agency
CPA Certified Public Accountant
CSO Central Statistics Office
CUR Customs Union Receipts
EU European Union
FIAS Foreign Investment Advisory Service
FBT Fringe Benefit Tax
GAO Government Accountability Office
GDP Gross Domestic Product
GST Goods and Services Tax
IFC International Finance Corporation
IMF International Monetary Fund
IRD Inland Revenue Department
ITD International Tax Dialogue
LTU Large Taxpayer Unit
NAO National Audit Office
OECD Organisation for Economic Co-operation and Development
PAYE Pay As You Earn
PST Provincial Sales Tax
xxiii
RIS Regulated Impact Statement
SACU Southern African Customs Union
SBP Small Business Project
SSA Sub-Saharan Africa
SME Small and Medium Enterprise
SMLE Small, Medium and Large Enterprise
SMME Small, Medium and Micro-sized Enterprise
SPSS Statistical Package for Social Sciences
TDM Total Design Method
UB University of Botswana
UBS Upstart Business Strategy
UK United Kingdom
USA United States of America
USDT United States Department of Treasury
1
CHAPTER 1
INTRODUCTION
1.1
FOREWORD
Botswana is a land-locked country situated in the southern part of Africa. It shares borders with South Africa, Namibia, Zambia and Zimbabwe. Its capital city, Gaborone, is located in the south east part of the country. Botswana has a population of just over two million people (Central Statistics Office [CSO], 2011, p. 1), which makes it one of the smallest countries in Africa.
Botswana has moved from being one of the world’s poorest countries to an upper middle income country, becoming Africa’s success story since its independence from being a British colony in 1966 (World Bank, 2010, p. 3). Through sound macro-economic policies, the jewel of Africa, as it is commonly referred to, has maintained one of the world’s highest economic growth rates over the past four decades, achieving a per capita GDP of US$ 16,300 in 2011 (Central Intelligence Agency [CIA], 2012).1 Botswana is cited as the only African country that has sustained rapid economic growth over an extended period (World Bank, 2000, p. 1), with an average growth rate of nine per cent (World Bank, 2007, p. 3). Its Gross Domestic Product (GDP) for the years 2009, 2010 and 2011 was around P82,548 million,2 P101,258 million and P120,541 million, respectively (CSO, 2012, p. 7).
As one of the world’s leading diamond producers, with a global market share of about 20 per cent (International Monetary Fund [IMF], 2010, p. 11), Botswana’s economy leans heavily on mining revenue and payments from the common customs
1
See also https://www.cia.gov/library/publications/the-world-factbook/geos/bc.html (as at 9 April 2013). The per capita GDP estimate provided by the CIA is significantly smaller, and probably more realistic, than the one given by the Bank of Botswana of P59 million for 2011 (Bank of Botswana, 2011, p. 8). See also
http://83.143.28.95/assets/uploaded/BOB%20Annual%20Report%202011%20web%20Stats%20only.pdf (as at 27 November 2012).
2
The national currency for Botswana is the ‘Pula’, often abbreviated as ‘P’ or ‘BWP’ (CSO, 2011, p. 1). This study uses ‘P’ to denote the currency of Botswana.
2 pool of the Southern African Customs Union (SACU),3 (World Bank, 2007, p. 9). Botswana’s mining revenue (mainly from diamonds) accounted for 27 per cent of GDP in 2009 and 32 per cent in both 2010 and 2011 (CSO, 2012, p. 7).
The business market in Botswana is very small and populated predominantly by Small and Medium Enterprises (SMEs). The SMEs sector is very important to the economy of Botswana as it accounts for around 50 per cent of private sector employment and 15–20 per cent of GDP (Botswana Institute for Development Policy Analysis [BIDPA], 2004, p. 1). The census of enterprises and establishments conducted by CSO (2009, p. 4), reveals that there were 16,556 enterprises/establishments as at July 2008; however, only 8,613 businesses provided data concerning the profiles of their businesses. The distinction of businesses by size is often based on the number of employees, turnover or a combination of the two. Small businesses in Botswana are defined as enterprises employing between 5 and 25 people with an annual turnover of around P60,000–P1,500,000. Medium-sized businesses employ between 26 and 100 people and have an annual turnover of between P1 million and P5 million. Large enterprises are characterised by a turnover that exceeds P5 million and an employee pool of over 100 people (BIDPA, 2004, p. 1). This thesis uses the annual turnover to distinguish business sizes.
Businesses in Botswana have to comply with a variety of regulations imposed by the government. The most common governmental regulation imposed upon businesses is taxation. Taxation is an important source of public finance for most countries, especially developing ones. While taxation is vital to ensure the provision of infrastructure and public services, compliance with its requirements often leads to additional costs over and above the tax amount. These costs, referred to as tax compliance costs, are borne by the taxpayers.
Value Added Tax (VAT)4 in Botswana was introduced at a rate of 10 per cent in July 2002. The VAT rate was increased to 12 per cent in April 2010. Prior to this study, the VAT’s associated compliance costs in Botswana remained hidden, making this
3
The SACU is made up of five countries namely Botswana, Lesotho, Namibia, South Africa and Swaziland. The mandate of SACU is to facilitate efficient trade and an equitable distribution of the trade benefits between the Member States.
4
Value Added Tax (VAT) is known as the Goods and Services Tax (GST) in some countries such as Australia, New Zealand and Singapore. These terms are used interchangeably in this study.
3 study an original contribution. To this end, this research study estimates the gross and net recurrent compliance costs of VAT for businesses in Botswana for the financial years April 2009/March 2010 and April 2010/March 2011. Two years are used in this study in order to capture the compliance costs effects of the 2010 VAT amendments made by the Botswana Unified Revenue Service (BURS) which included increases in the VAT registration threshold and VAT rate.
The aim of this chapter is to provide an overview of this thesis. Section 2 discusses the different costs of taxation while Section 3 presents the tax compliance costs framework. The main objectives of this thesis are outlined in Section 4, followed by an overview of the significance of this research study in Section 5. Finally, the structure of this thesis is discussed in Section 6.
1.2 THE COSTS OF TAXATION
The existence of any tax system results in costs which are incurred by the government and taxpayers. Pope (1993a, p. 4) identifies three different types of taxation costs as shown in Figure 1.1. These are: the amount of the tax payment itself; the distortionary effects upon production and/consumption; and the administrative and compliance costs of the tax system.
The time and money expended by the tax authority while running the tax system are referred to as tax administrative costs or public sector costs (Sandford, Godwin & Hardwick, 1989, p. 6). These costs are also referred to in the literature as collection costs (Ebrill, Keen, Bodin & Summers, 2001, p. 52). Tax compliance costs are the costs incurred by the taxpayers in their efforts to adhere to the requirements imposed by the tax system. These are costs over and above the tax liability. The tax administrative and compliance costs constitute the operating costs of the tax system.
4
Figure 1.1: The Costs of Taxation
Source: Pope (1993a, p. 4).
Costs of taxation Amounts of tax payments (sacrifice of income) Distortionary effects upon production/consumption Inherent in tax Structural features Arising from compliance Operating costs Administrative costs Compliance costs Economic Psychological
5 It has been argued that there is a trade-off between administrative and compliance costs, which suggests that a tax with high administrative costs has low compliance costs and vice versa (Haig, 1935). As administrative and compliance costs of taxation can be shifted between the public and private sectors, there is a risk that, in order to reduce the tax administrative costs, a government may place its tax collection responsibilities on the businesses (Sandford et al., 1989, p. 23), and use them as unpaid tax collectors (Pope, 2001a, p. 3). However, Evans, Ritchie, Tran-Nam and Walpole (1997, p. 3) disagree and maintain that tax administrative and compliance costs often follow a similar trend, as tax simplification measures are likely to reduce both costs.
Likewise, Bird and Zolt (2008, p. 77) argue that the trade-off between administrative and compliance costs does not always exist as both costs may increase when, for instance, a more sophisticated tax administration requires more information from taxpayers and undertakes more audits. Due to the possibility of a trade-off between administrative and compliance costs, Sandford et al. (1989, p. 23) advise that it is imperative to consider administrative and compliance costs together. It was the desire of the researcher to conduct a joint investigation of administrative and compliance costs; however, the lack of data has precluded the estimation of administrative costs in this study.5
1.3 OVERVIEW OF TAX COMPLIANCE COSTS
1.3.1 Tax Compliance Costs Definition
The review of the literature indicates that there is no uniform definition of tax compliance costs. Sandford et al. (1989, p. 10) emphasise the ambiguity of the ‘compliance costs’ terminology, suggesting that this term can be taken to refer to the costs of administering a tax (or the costs of ensuring compliance) as well as the costs of complying with the tax system. Similarly, it is conceptually difficult to define what comprises tax compliance costs and what should be included in tax compliance activities (Evans, Ritchie, Tran-Nam & Walpole 1996, p. 10; Evans, 2008, p. 451).
5
Several attempts (which continued for a period of three years) to obtain administrative costs data from BURS were unsuccessful.
6 Broadly, tax compliance costs are:
“The costs incurred by taxpayers, or third parties such as businesses, in meeting the requirements laid upon them in complying with a given tax structure” (Sandford et al., 1989, p. 10).
The components included in business tax compliance costs have been outlined by Sandford et al. (1989, pp. 11-12) as follows:
1) Money costs: Costs of collecting, remitting and accounting for tax. These may take the form of: salaries and wages of the business’s internal employees; fees of external employees such as tax advisors and tax accountants; costs of travel, communication, stationery, postage, computer hardware and software as well as accommodation and costs of acquiring sufficient knowledge to enable the employees to meet the requirements of the tax. These include staff training costs and material costs;
2) Time costs: Imputed costs of time spent by unpaid helpers such as family members or friends in complying with tax requirements;
3) Psychic6 costs that arise from the stress and anxiety experienced by taxpayers when dealing with the tax legislation, and;
4) Costs incurred by representative bodies (paid for by their members) in making presentations and lobbying for tax changes.
Pope, Fayle and Chen (1994, p. 26) narrow Sandford et al.’s (1989) definition of business tax compliance costs by excluding the costs of taxpayers’ representative bodies that they incur when making presentations and lobbying for tax changes. Their definition of business tax compliance costs comprises: the cost of time spent by a taxpayer and unpaid helpers on, maintaining tax information throughout the year; completing tax forms or preparing information for the taxpayer’s adviser; the fees paid to a professional adviser and; the psychological costs being the apprehension and frustration caused by tax compliance.
6
Sandford referred to the stress associated with tax compliance as psychic costs; however, the term psychological costs is now preferred and used in this study.
7 Similarly, Sandford et al.’s (1989) definition of business tax compliance costs is abridged by the ATAX team, led by Evans, to derive what they term ‘pure’ compliance costs (Evans et al., 1996, p. 11). Evans et al. (1996) group these costs into four major categories: own labour costs; costs of external advisers; computing costs and incidental costs. In a subsequent study, the ATAX team categorise tax compliance costs into three major groups: taxpayers’ own labour costs, unpaid helper and internal staff costs; costs of external adviser use and incidental or overhead costs (Evans et al., 1997, p. 3).
Tax compliance costs comprise economic and non-economic costs (Pope, 1993a, pp. 1–2). This research study focuses on the economic costs of VAT compliance in Botswana. Economic costs incorporate the monetary and time costs expended in keeping records to the standard required by the tax authorities and filing the tax returns. The economic costs of business taxation as identified by Pope (1993a, p. 6) are displayed in Figure 1.2.
8
Figure 1.2: Economic Compliance Costs of Business Taxation
Source: Pope (1993a, p.6).
Compliance costs of business taxation
Internal
Own time costs (self-employed) Monetary Staff costs Directors/ Management Accounting/ Bookkeeping
Computer Legal Secretarial Other
Miscellaneous costs e.g. telephone, stationery
External
Monetary
Personal fees
9 Non-economic costs are psychological costs, and refer to the stress, worry and anxiety experienced by taxpayers, particularly the elderly, retired and widowed, arising from complying with the tax requirements or tax investigation (Sandford et al., 1989, p. 18). The literature seems to be divided when it comes to the issue of whether or not to include psychological costs in the estimation of tax compliance costs. Psychological costs ‘inclusion proponents’ maintain that these costs are important and should be considered in the estimation of tax compliance costs (Sandford et al., 1989, p. 18). However, the research by the ATAX team excludes psychological costs from their definition of tax compliance costs, arguing that these costs cannot be measured reliably (Evans et al., 1997, p. 3). Tran-Nam (2001, p. 55) also affirms that these costs should be ‘consistently excluded’ in tax compliance costs empirical studies.
Although psychological costs are recognised, they cannot be quantified due to a lack of a dependable methodology of measuring them. To this day, only a few studies (e.g. Diaz & Delgado, 1995; Woellner, Coleman, McKerchar, Walpole & Zelter, 2001, 2005; Colmar Brunton, 2005) have investigated psychological costs of tax compliance. However, none of them have been able to quantify them. Diaz and Delgado used four indicators namely, how taxpayers perceive the time dedicated to tax compliance; what part of this fiscal obligation is most disliked; the state of mind upon finishing the complete process and the conversational time occupied by the topic of filing tax returns (Diaz & Delgado, 1995, p. 220). Colmar Brunton uses a seven-point scale to examine the perceptions of taxpayers towards the stress associated with meeting the Inland Revenue Department (IRD) requirements (Colmar Brunton, 2005, p. 12).
Woellner et al. developed a methodology, “which goes some way to providing a reliable method of measuring psychological tax compliance costs” (Woellner et al., 2005, p. 269). The methodology incorporates the use of a case study, questionnaire and behavioural coding. The behaviour or reactions of taxpayers are investigated by videotaping the participant/s whilst solving a tax problem (Woellner et al., 2005, p. 270). While this methodology provides a significant step towards measuring psychological costs of tax compliance, it is still unreliable. Moreover, the methodology does not provide a reliable way of quantifying psychological costs. In
10 the context of Botswana, due to the challenges of getting people to participate in surveys and the difficulty of exploring a nebulous area, psychological costs are unfortunately beyond investigation.
1.3.2 Commencement, Transition and Recurrent Tax Compliance Costs
The introduction of a new tax results in one-off costs, commonly referred to as commencement costs. These costs arise due to the procurement of new computer systems and software as well as time and money spent on the training of new bookkeepers and staff to operate the new tax. Sandford et al. (1989, p. 16) emphasise that, since commencement costs are mainly of a capital nature and benefit businesses over a period, they should be spread rather than be considered a cost solely at the time incurred. Temporary or transition costs are additional costs borne by both the tax departments and the taxpayers during the learning phase. Such costs, also referred to as learning curve costs, arise during the transition period, whilst taxpayers are getting used to the new requirements and are developing the best ways of meeting them (Sandford & Hasseldine, 1992, p. 6).
The final category of costs, known as recurrent, regular or on-going costs, is the main focus of this study. They are the costs incurred in running a tax system without the additional temporary elements of a tax change. It must be noted that if governments change the tax system repeatedly, compliance costs will always carry, at any time, some element of temporary costs (Sandford et al., 1989, pp. 16–17). Even when a tax has been running unchanged for a period, so that the compliance costs can all be considered regular costs, taxpayers which enter the tax system for the first time or those that take on their first employees, will be experiencing start-up and temporary costs. Thus, the regular tax compliance costs will always include elements of start-up and temporary costs associated with normal changes in the taxpayer population (Sandford & Hasseldine, 1992, p. 7). As such, it is vital to distinguish between commencement, temporary and regular costs for their proper categorisation. To avoid the possibility of including start-up or temporary costs in the recurrent VAT compliance costs estimates, this study excludes the businesses that have been operating or VAT registered for less than a year.
11
1.3.3 Tax Compliance Benefits
It is clear that tax compliance costs may not always be disadvantageous. There are some gains that generally accrue to businesses (and reduce tax compliance costs) as a result of compliance with the tax system. These benefits come in the form of tax deductibility benefits, cash flow benefits and/or managerial benefits. Tax deductibility benefits are the gains that accrue to taxpayers whose taxable income is reduced by legitimate tax compliance expenses. Cash flow benefits represent the financial gains that accrue to third parties from withholding the tax collected for a period of time before it becomes payable to the tax authority. Conversely, cash flow costs can arise, especially when businesses have to pay tax revenue to the tax authority before collecting it from the final consumers. Managerial benefits stem essentially from improved record keeping instigated by compliance with the requirements imposed by the tax authority. This study only considers cash flow and managerial benefits, and these are discussed in detail and estimated in Chapter 7 of this thesis.
1.3.4 Gross and Net Costs
In the same way, tax compliance costs can be broken down into gross and net costs (Evans et al., 1997, p. 4). Net costs of tax compliance are made up of the difference between the gross costs and the tax compliance offsets. As mentioned earlier, tax compliance offsets arise due to benefits gained while complying with the requirements of the tax system. Sandford et al. (1989, pp. 13–14) suggest that because of the difficulty of valuing other benefits, net compliance costs are generally compliance costs minus the value of the cash flow benefit. However, two recent major studies successfully estimate the managerial benefits of tax compliance (Rametse, 2006; Lignier, 2008). This study estimates the cash flow benefits as well as managerial benefits to arrive at the net compliance costs of VAT in Botswana.
Largely, the measurement of tax compliance costs remains problematic. Evans et al., (1996, p. 10) highlight the absence of a unanimous precise meaning of tax compliance costs and also the difficulty of measuring such costs. Thus, considerable care has to be taken when estimating tax compliance costs (e.g., Sandford et al.,
12 1989, p. 9; Sandford & Hasseldine, 1992, p. 5). In this study, extreme caution is exercised to ensure that questions are asked in a manner that minimises the problems associated with the estimation of tax compliance costs.
1.3.5 Tax Compliance Costs Research
The literature traces research on tax compliance costs to the seminal work of Adam Smith (cited in Sandford et al., 1989, pp. 24–25) which accentuates the impact of tax operating costs on the tax system. Smith laid out the four cornerstones of a good tax system namely Equity, Certainty, Convenience and Economy. Of these four canons, the last three establish the significance of tax compliance costs. However, while governments have generally recognised the existence of tax administrative costs and measured them (Evans, 2003, p. 64), tax compliance costs were overlooked for a long time and treated as hidden costs of the tax system (Tran-Nam, Evans, Walpole & Ritchie, 2000, p. 229).
Tran-Nam et al. suggest the possible reasons for the neglect of tax compliance costs. These include the fact that compliance costs may be perceived to be insignificant. The lack of a formal model for tax compliance costs minimisation also contributes to the neglect. Moreover, the estimation of these costs is onerous as it requires the collection of massive data from the taxpayers. Such data is usually not available from published sources (Tran-Nam et al., 2000, p. 230).
The neglect of tax compliance costs has since become a thing of the past in many countries as research on these costs has flourished since the 1980s led by Sandford in the UK. It is argued that the growth in tax compliance costs research has been encouraged by changes in technology which has enabled large scale computer based surveys; the introduction of the VAT in many countries, which resulted in significant compliance costs; the growth of the small business sector and the increasing complexity of the tax system (Tran-Nam et al., 2000, p. 230).
Pope (1993b, pp. 71–73) identifies six phases relating to the development of tax compliance costs in an Australian context. The first stage pertains to the period of lack of interest in the subject, where tax compliance costs are hidden. In the second
13 phase, the tax compliance costs are recognised by different professional bodies such as tax practitioners and academics. The estimation and evaluation of tax compliance costs follow in the third stage while the fourth phase is the policy recognition phase where the government recognises the economic, social and political importance of tax compliance costs as an issue and act on it publicly. The fifth stage is centred on the development of effective tax compliance costs reduction policy measures. Finally, the sixth phase is one in which the tax compliance costs, as well as tax administrative costs, are monitored on a continual basis. In the context of Botswana, the development of tax compliance costs is currently at phases two and three. Prior to the commencement of this study, the monetary costs of tax compliance in Botswana remained at the first stage.
1.3.6 Nature of Tax Compliance Costs
Sandford et al. (1989, p. xiii) recognise the burden, size and importance of tax compliance costs, and state that they are the equivalent of a large industry and offer considerable scope for resource saving. They assert that the size of compliance costs make them important to every aspect of tax-policy making, hence consideration of such costs should form part of every tax policy-making debate. Furthermore, they highlight the value in the distribution of tax compliance costs and maintain that these costs are frequently inequitable in their incidence and fall with disproportionate severity on small firms (Sandford et al., 1989, pp. 200–201).
The International Finance Corporation (IFC) affirms that “tax compliance costs could be considered an additional tax that companies must pay” (IFC, 2009a, p. 11). In addition, taxation compliance costs hamper the competitiveness of businesses both against imports and on the world market. Small businesses operate at a competitive disadvantage, relative to large businesses, which dissuades investment and the formation of new Small and Medium Enterprises (SMEs) (IFC, 2009b, p. 16; 2010b, p. 7). Moreover, smaller businesses, when faced with significant increases in tax compliance costs, are likely to take steps to remain under the registration threshold, which results in a distortion in the behaviour of businesses (IFC, 2012b, p. 14).
14 In a review of the linkage between tax compliance and tax compliance costs research, Hasseldine (2001, p. 3) asserts that tax compliance costs are an important element that impacts the levels of voluntary tax compliance. These costs are significant and can, in fact, help to drive small businesses out of specific economic sectors (Sandford et al., 1989, p. 200). Tax compliance costs can actually cause some businesses, particularly small ones that resent them, to evade taxes (Sandford et al., 1989, p. xiii). Equally, tax complexity and high compliance costs can be viewed as a significant part of the problem of tax non-compliance (Hasseldine, 2001, p. 11).
Tax compliance costs are reported to be higher with respect to taxes collected from smaller firms (Bird & Zolt 2008, p. 77). In developed countries, these costs are alleged to be around two to six times higher than the administrative costs incurred by the governments (Evans, 2003, p. 71), while in developing countries, it is claimed that tax compliance costs are about ten times larger than in developed countries (Chattopadhyay & Das Gupta, 2002b). Evidence from developing countries (especially in Africa) is, however, presently thin. The contribution of this study to the African tax literature is, thus, timely.
Evidence based on an overview of tax operating costs undertaken by Evans (2003, p. 72) indicates that tax compliance costs are perceived to be a very significant issue for most business and non-business taxpayers. Small businesses, particularly, are often administratively under-equipped to handle major taxes such as GST (Glover & Tran-Nam, 2005, p. 238), which carry a heavier compliance cost burden. They lack specialist skills, which amplifies the burden of tax upon them. To counter the problem of resource constraints, small businesses often have to outsource special expertise from external advisors (Coolidge, Ilic & Kisunko, 2009, p. 25), which magnifies their compliance cost burden (Hansford, Hasseldine & Howorth, 2003, p. 483). This inequality often makes it hard for small businesses to compete with the larger ones operating in the same market as it conflicts with the aim of establishing a ‘level playing field’ between all types and sizes of business (Pope, 2001a, p. 1).
To offset the burden of tax compliance on the small business sector, many countries have incorporated ‘small business special treatment clauses’ in their tax policies. Pope (2008, p. 14) affirms that “…in many countries, small businesses expect and
15 generally receive special treatment, concessions or arrangements regarding taxation compared with medium and large business”. In Botswana, special treatment comes in the form of high registration thresholds that are aimed at excluding some very small businesses from the tax system and also tax filing periods that are not as frequent as those of large businesses.
1.4 MAIN OBJECTIVES
1.4.1 Overview
Although VAT was introduced over ten years ago in Botswana, its associated compliance costs remained hidden prior to this study. The review of the literature highlights the absence of tax compliance costs studies in Botswana, making this study the first of its kind in Botswana. To this end, the primary objective in this study is to estimate the gross and net compliance costs of VAT in Botswana for the financial years 2009/10 and 2010/11. In addition, the appropriate policy implications for the government of Botswana are drawn based on these estimates. A comparative analysis of the compliance costs of VAT in Botswana for the two years under review is also undertaken. The findings of this study are also compared with international estimates. Lastly, the possible measures that can enhance the simplicity and efficiency of the Botswana VAT system and the appropriate policy implications for the government of Botswana are identified and recommendations are made. The research questions that have been employed in this study to achieve these objectives are displayed in Table 1.1.
16
Table 1.1: Research Questions Number Research Questions
1 What is the burden/size of compliance costs of VAT as a share of VAT revenue, total tax revenue and GDP in Botswana for the financial years 2009/10 and 2010/11?
2 How do the compliance costs for the financial years 2009/10 and 2010/11 compare? 3 What is the size of VAT Cash Flow Benefits in Botswana?
4 Are there any managerial benefits derived by businesses as a result of complying with the VAT requirements in Botswana?
5 What are the attitudes of taxpayers towards VAT in Botswana and how do they affect compliance costs?
6 How do the compliance costs of VAT for businesses in Botswana compare with those of selected other countries (where relevant studies have been undertaken)?
7 How can the VAT compliance costs in Botswana be reduced?
1.4.2 Research Approach
This research employs the mixed method approach, which incorporates both the quantitative and qualitative designs to estimate the compliance costs of VAT in Botswana. The data collection process followed the internationally accepted and widely used approach of questionnaire surveys and follow-up interviews. The questionnaires for this study were hand delivered or collected from randomly chosen businesses. As a result of the unreliability of the postal system in Botswana, the questionnaires could not be mailed. Anecdotal evidence, confirmed by the University of Botswana (UB), indicates that previous studies that had attempted to use postal questionnaires in Botswana failed. As such, UB, which sponsored the data collection for this study,7 was not willing to fund mail questionnaires.
Due to the time consuming and physically strenuous nature of the hand delivery/collection technique, the sample size was reduced from 1000 to 600 businesses, and 300 to 100 businesses, for the years 2009/10 and 2010/11, respectively. Thus, the questionnaires were hand distributed to 600 businesses in the City of Gaborone8 and surrounding towns and villages in the financial year 2009/10. In the financial year 2010/11, 100 questionnaires were distributed to businesses in
7
The financial support of the University of Botswana in this research is acknowledged with gratitude. 8
17 the City of Gaborone and neighbouring towns. Financial and time constraints necessitated the exclusion of villages from the 2010/11 survey.
1.4.3 Response Rates
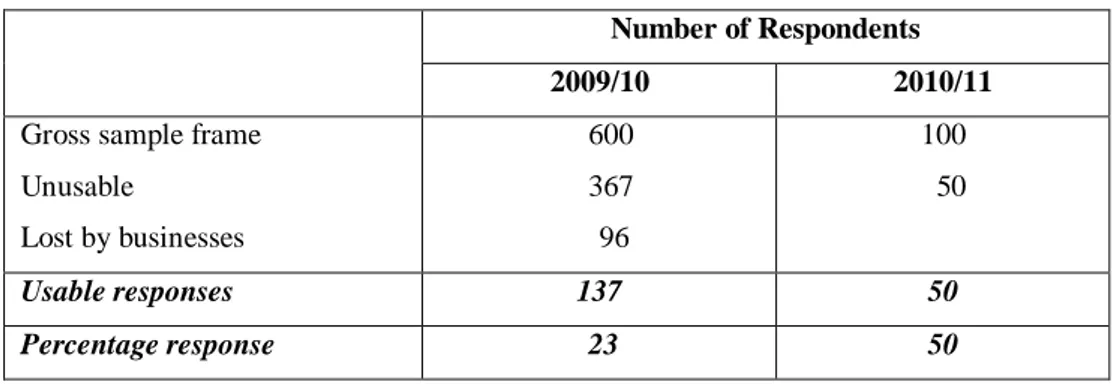
The response rate to a postal questionnaire survey in developing countries typically ranges between 20–30 per cent. In developing countries, this rate is usually lower at around ten per cent.9 Overall response rates of 23 per cent in 2009/10 and 50 per cent in 2010/11 were obtained after allowing for unusable responses. This provided 137 and 50 usable responses for the tax years 2009/10 and 2010/11, respectively, sufficient to yield reliable results. Although such a response rate is lower than the typical 30 per cent usually cited in developed countries, a 23 per cent response rate for the year 2009/10 is considered very good for a developing country.10 The analysis of data is performed using the Statistical Package for Social Scientists (SPSS).
1.4.4 Interpretation
While the findings in this study provide an indicative picture of the compliance costs of VAT for businesses in Botswana, they have to be interpreted with caution for several reasons. First, it is possible that these findings may include an element of temporary costs (which are expected to diminish over time) resulting from the 2010 BURS VAT amendments, which include an increase in the VAT rate from 10 per cent to 12 per cent. Second, the results are likely to carry the effects of the Global Financial Crisis (GFC) which started in 2008 and has possibly affected compliance costs by hampering the ability of firms to hire internal or external VAT labour.
Third, the sample size in absolute terms is relatively small, at 137 responses for 2009/10 and 50 responses for 2010/11. However, in percentage terms (23 per cent for 2009/10 and 50 per cent for 2010/11) the response is good for an emergent country.
9
Refer to Appendix D for an extensive list of studies, in both developed and developing countries, which employed postal questionnaire surveys together with their response rates.
10 A doctorate study by Abdul-Jabbar (2009) used a mail survey and obtained a response rate of around 16 per cent in Malaysia. Another recent study by Susila and Pope (2012) used a mail survey with a response rate of 8.2 per cent for Indonesia.
18 The great practical difficulties of undertaking such survey research of taxpayers in a developing country, such as Botswana, are emphasised, even allowing for the considerable fieldwork efforts of the researcher.
Fourth, and unfortunately, the researcher could not get detailed data concerning the number of VAT registered businesses in each size category (small, medium and large) and the amount of VAT remitted by each category because BURS say such data is not available. Moreover, the researcher could not get the data of VAT registered businesses by their main business activity or place from BURS. Due to this caveat, the grossing-up of VAT compliance costs in this study is restricted to the manner in which BURS classifies the value added taxpayers (i.e., by taxpaying groups).
Last, as cash flow benefits are simply a transfer of resources within the economy, they do not affect gross tax compliance costs. Additionally, the estimated value of cash flow benefits depends on the level of interest rates in the country at the time of the study. Managerial benefits are also difficult to estimate. The difficulty arises from the problem of distinguishing between accounting-induced and tax-induced managerial benefits. In addition, the magnitude of managerial benefits depends on how small businesses value managerial information. To this end, extra caution should be exercised when interpreting the estimates of the VAT compliance benefits in this study.
1.4.5 Exchange Rates
The VAT compliance costs estimates and all Botswana monetary data throughout this thesis are stated in Botswana Pula (P).11 As a general guide, one unit of the Pula is equivalent to United States of America (USA) Dollar US$0.118, Canadian Dollar C$0.121,12 Australian Dollar A$0.130,13 New Zealand Dollar NZ$0.147,14 United Kingdom (UK) Pound Sterling £0.077 and European Euro €0.089 on the 30 July
11
See n. 2. 12
The Botswana Pula to Canadian Dollar exchange rate is retrieved from
http://www.xe.com/currencyconverter/convert/?Amount=1&From=BWP&To=CAD. 13
The Botswana Pula to Australian Dollar exchange rate is retrieved from
http://www.xe.com/currencyconverter/convert/?Amount=1&From=BWP&To=AUD.
14
The Botswana Pula to New Zealand Dollar exchange rate is retrieved from http://www.xe.com/currencyconverter/convert/?Amount=1&From=BWP&To=NZD.
19 2013 (Bank of Botswana, 2013).15 Exchange rates for other currencies and years are given in footnotes where applicable.
1.5 SIGNIFICANCE OF THIS STUDY
The VAT system in Botswana imposes a variety of responsibilities upon the taxpayers (e.g., collection of tax from the customers; accounting for tax and proper record keeping; VAT return filing; remittance of collected VAT and claim of overpaid tax). The review of the literature indicates the absence of tax compliance costs studies in Botswana. Thus, there is a gap in the literature as far as the compliance costs of VAT (and other taxes) in Botswana are concerned. This study, therefore, offers a contribution to the body of literature in this area.
Being the first comprehensive study of the compliance costs of VAT in Botswana, this research has theoretical and practical significance. In addition, this study will provide information to the government policy makers, tax administrators, tax agents, business representative bodies as well as individual and business taxpayers in Botswana and elsewhere. Furthermore, the estimates presented in this study provide a benchmark for the compliance costs of VAT in Botswana for the financial years 2009/10 and 2010/11.
Moreover, this research will benefit academics, tax professionals and government policy-makers by providing a benchmark for the costs of VAT in Botswana. Also, the estimates and findings in this study can be used for international comparisons, particularly with developing countries that have similar economic structures as Botswana. Last, the compliance cost estimates and key recommendations in this study can be used to draw policy implications regarding the simplification of VAT in Botswana.
15
Exchange rates other than those of the Australian dollar and New Zealand dollar can be viewed at http://www.bankofbotswana.bw/indicators/tabular_exchanges/ (as at 30 July 2013).
20
1.6 THESIS STRUCTURE
This study confines itself to the estimation of the gross and net compliance costs of VAT for businesses in Botswana. The thesis is organised into nine chapters namely introduction; design of VAT and overview of Botswana’s tax system; review of tax compliance costs literature; estimation issues and research design; survey response results; VAT compliance costs estimates and findings; tax compliance benefits and net compliance costs of VAT in Botswana; taxpayer attitudes towards VAT in Botswana and last, conclusions and policy recommendations.
The thesis begins with the introduction, which provides an overview of the study, in Chapter 1. Chapter 2 discusses the design of VAT and an overview of Botswana’s tax system. The discussion of the design of VAT considers certain features of the VAT system, such as the number of VAT rates, exemptions and zero rating of certain goods and services and the level of the registration threshold and their relation to tax compliance costs.
The review of tax compliance costs literature follows in Chapter 3. Since this is the first research study to investigate the compliance costs of VAT in Botswana, the review of the literature leans heavily on international studies. The estimation issues and research methodology are discussed in Chapter 4. The chapter also discusses the issues and the caveats of collecting data from a developing country whose systems do not fully accommodate the research methodologies that are used in the established systems of developed economies. The chapter draws on the experience of the researcher gained during fieldwork.
Chapter 5 presents a discussion of the sample, response rate and the profiles of the respondents. This is followed by an outline of the compliance times of VAT for businesses for the two years under review as well as the average wage rates of the different personnel responsible for VAT work. The analysis of the monetary costs and the distributional effects thereof, of complying with the VAT system in Botswana, follow in Chapter 6. The chapter begins with a discussion of the estimation of tax compliance costs followed by an analysis of the internal and
21 external VAT compliance costs. Average16 gross VAT compliance costs followed by the investigation of aggregate VAT compliance costs are also presented. The amounts that the taxpayers would claim from the government as fair compensation for being used as tax collectors are outlined in this chapter.
The benefits of complying with the VAT system in Botswana are investigated in Chapter 7. The chapter presents the estimates of the VAT cash flow and managerial benefits gained by businesses in Botswana during the financial years 2009/10 and 2010/11. The net compliance costs of VAT for businesses in Botswana are also estimated and presented in this chapter.
Chapter 8 presents the results of the surveys of the attitudes of taxpayers towards VAT in Botswana. First, the chapter presents a synopsis of the measurement of taxpayers’ attitudes followed by an outline of the attitudes of taxpayers towards VAT in Botswana. The attitudes of the taxpayers relative to the VAT compliance costs as well as the comments and suggestions concerning how the VAT system in Botswana can be improved are analysed. Chapter 9 summarises the thesis and offers key policy recommendations for the government of Botswana.
16
22
CHAPTER 2
DESIGN OF VALUE ADDED TAX AND BOTSWANA’S
TAX SYSTEM
2.1 INTRODUCTION
The aim of this chapter is to present a succinct discussion of the design of a VAT generally and an overview of the tax system in Botswana. The design of a VAT is important as it affects the manner of tax compliance as well as taxpayer compliance costs. Certain features of the VAT, such as the number of VAT rates, exemptions and zero rating of certain goods and services, complicate the VAT system. A complex VAT design has higher compliance costs that burden smaller businesses the most. This chapter does not aim to cover all aspects of VAT design as such an investigation is beyond the scope of this study. Readers interested in an in-depth discussion of the design of VAT are referred to other studies, for example Tait, (1988), Cnossen (1991), Ebrill et al., (2001), International Tax Dialogue [ITD], (2005) and Bird and Gendron (2007).
Section 2 provides a brief background of VAT, followed by a short investigation of the design features of VAT in Section 3. An overview of the tax system in Botswana is outlined in Section 4. The importance of the VAT system in Botswana is presented, in the context of the overall tax system, in Section 5. Section 6 summarises this chapter.
2.2 BACKGROUND
Value Added Tax derives its name from the system which requires the tax to be imposed and collected at every ‘value adding’ stage of the production process. However, VAT is not a tax on value added.17 It is a broad-based18 consumption tax
17
Theoretically, a VAT is not supposed to tax value added. However, practically, in a system with many exemptions, a VAT can actually tax the value added of businesses that use exempt inputs.
18
With the presence of various VAT exempt and zero rated goods and services, VAT in many countries is not broad-based. New Zealand’s broad-based VAT makes it an exception.