1
Using Weighted Goal Programming Model for Planning Regional
Sustainable Development to Optimal Workforce Allocation: An
Application for Provinces of Iran
Hashem Omrani1, Mahsa Valipour1 and Ali Emrouznejad2
1 Faculty of Industrial Engineering, Urmia University of Technology, Urmia, Iran 2 Aston Business School, Aston University, Birmingham, UK
Abstract:
Due to the urbanization and economic growth, planning of regional sustainable development has become one of the major challenges in the world. The key indicators such as Gross Domestic Product (GDP), electricity and energy consumption and Greenhouse Gas Emission (GHG) are considered in sustainable development planning. This paper determines number of required workforce in different sectors of each province in Iran considering targets/goals for sustainable development indicators in the 2030 macroeconomic and regional planning. First, the relative goals are designed for GDP, electricity, energy and GHG emission and then, two Weighted Goal Programming (WGP) models are applied to allocate the optimal workforce among four sectors: agriculture, industry, services and transportation. The first model minimizes recruitment of new workforce and allows current workforce exchange among the four sectors in each province in order to achieve the goals, while the second model indicates equitable distribution of new workforce recruitment in different sectors within each province. In both models, the workforce changes have been investigated based on achieving the desirable growth rates of GDP, GHG, electricity and energy consumption as planned by the government. Based on the results of this paper, policy makers can manage workforce and the government can make optimised decisions to macroeconomic and regional planning.
Keywords: Sustainable development, Weighted goal programming, Regional planning, Optimal workforce
allocation
2
1. Introduction
Sustainable Development (SD) is considered as a fundamental, vital and central debate in twenty-first century. Nowadays, it is an important topic in the conferences, research institutes and international organizations. SD can be defined as management of relationships among human systems and ecosystems in order to use of resources and facilities efficiently and to provide welfare for current and future generations (San Cristóbal, 2012). The concept of SD is not only referring environmental issues but also includes general concept of politics, economy, culture, society and so on. Indeed, the SD addresses three issues: economic development, social development and environmental protection.
One of the most important steps in assessing sustainability is the selection of suitable development’s indicators to consider interaction among economic, society and environment. In recent years, several indicators have been proposed for measurement of SD. In 1992, United Nation introduced SD indicators in Agenda 21 report. Numerous organizations have evaluated the SD and proposed some indicators such as World Bank, World Resource, World watch Institute United Nations, Department of Economic and Social Affairs, International Atomic Energy Agency, European Union, Eurostat, European Environment Agency, Organization for Economic Cooperation and Development and the International Energy Agency (Bolcárová and Kološta, 2015). In this section, three issues related to definition of SD including economic, social and environmental are explained.
1.1.Economic development
Economic development is an increase in an economy's ability to advanced production such as physical, human and social capacities. In economic development, the quantitative production growth is achieved along with social changes. Social change is an alternation to social institutions and viewpoints as well as continuously and dynamically increase in utilization of existing resources (Todaro and Smith, 2011). Some of the indicators are related to the economy such as Gross Domestic Product (GDP) (Beckerman, 1992; CEC, 2001; OECD, 2001).
1.2.Social development
Social development represents the main aspects of the development process related to social justice, satisfaction of human needs and improving the quality of life (World Summit for Social development Copenhagen 1995). Social development includes the aspect of development that emphasizes humans’ interactions, institutions and social
3
relations, etc.To measure countries’ achievement in respect to social development goals and changes in the degree of development over time, different indexes and standards have been designed such as determinants of population growth, labor force, education and illiteracy, science and technology, income and poverty, expenditure on food, housing, fuel and power, transport and communication, life and job satisfaction and investment in medical care and education.
1.3.Environmental development
Beside the economic indicators such as GDP, there are other important indicators for planning regional SD. One of them is environmental issues such as greenhouse gas emissions and pollution which are highly regarded. Due to the facts that SD is threatened by factors such as industrial pollution and greenhouse gas emissions, determination of the environmental policies is necessary. Another remarkable item is energy that play fundamental role in every nation's future. With urbanization and industrialization, GHG and energy consumption has become important issues in the world (Kılkış, 2016).
SD is a multidimensional concept so that it needs models and techniques to deal with the conflict objectives of SD and design programs and framework for policy makers to achieve goals (Henriques & Antunes, 2012). Multi-Criteria Decision Making models (MCDM) are suitable approach to dealing with sustainability (Munda, 2005). The interaction between economic, environment and social items can be investigated by using MCMD techniques (Henriques & Antunes, 2012).
The rest of this paper is organized as follows: Section 2 discusses the literature review on SD indicators and analytical methods for evaluation the SD. Section 3, includes the explanation of the related data. In this section the proposed models are also presented. In section 4, the proposed models are applied to a real application from agriculture, industry, service and transportation system in the provinces of Iran. This is followed by the discussion of the results in section 4. Finally, the summarization of the paper and direction for future research are given in section 5.
2. Literature review: sustainable development indicators and analytical methods
Many studies have surveyed the SD indicators construction such as Niemeijer and Groot (2008), Wilson et al. (2007), Donnelly et al. (2007) and etc. More details definition and various aspects of the SD indicators have been
4
discussed by Sébastien and Bauer (2013), Hak et al. (2012), Rinne et al. (2013), Greaker et al. (2013), Bečić et al. (2012) and Ciegis et al. (2015), etc. Ozyurt (2010) investigated energy renewable issue to achieve the SD in Turkey. He studied fossil fuels and renewable resources, energy utilization, climate change, greenhouse gases emission and air quality in Turkey along with the regulatory and economic instruments to gain sustainability. San Cristóbal (2012) developed a Goal Programming (GP) framework to propose optimim values of GHGs and wastes emissions, energy, labor and coal requirements. Bao and Fang (2013) explored effective factors on renewable energies, coal resources and energy consumption in China and offered some items to the Chinese government in order to achieve SD in renewable energy. Iddrisu and Bhattacharyya (2015) considered commercial energy consumption, consumption of electricity in the residential sector, share of modern fuels in total residential energy sector consumption and share of population criteria to evaluate the status of energy sustainability. Jayaraman et al. (2016) investigated SD in Gulf Cooperation Council Countries by considering eight important sectors, including:agriculture, crude oil, natural gas and mining, manufacturing and electricity, construction and real estate, trade and transport, restaurants and hotels, banking and financial services. Kılkış (2016) introduced a composite indicator to evaluate performance of environment, energy and water systems in 12 Southeast European cities. These indicators consisted of seven dimensions such as energy consumption, carbon dioxide emission, water and environmental quality and so on. Following these literature, we found that, the most and common important indicators in SD planning are GDP, energy consumptions, GHG and number of workforce (Jayaraman et al. 2015). These indicators have undeniable effects on development of each country, region and city.
Policymakers need proper methods for planning of SD at different scales such as global, country, regional and city. Some researchers have used analytical methods for analyzing different issues in SD context. Tsai and Chou (2009) presented a synthetic approach based on decision making trial and evaluation laboratory (DEMETAL), Analytical Network Process (ANP) and zero-one goal programming for selection of management system with resource limitation to achieve SD in Small and Medium Enterprises (SMEs). The aim of their study was selecting a suitable management system i.e.ISO 9001, ISO 14001, OHSAS 18001 and SA 8000 for SD in SMEs. Ren et al. (2010) expanded Multi-Objective Linear Programming (MOLP) models to investigate operation of Distributed Energy Resource (DER) systems in Japan and selection of optimal strategy considering environmental and economic objectives. Henriques and Antunes (2012) applied MOLP model based on input-output analysis to investigate the interactions between main axes of sustainable development: economic growth, energy consumption,
5
environmental and social concerns. They also proposed a model to deal with uncertainty in data by using interval programming tools. Zolfani and Zavadskas (2013) presented a new hybrid model based on MCDM techniques to investigate SD of rural areas’ building structures in regions of Iran. They used Step-wise Weight Assessment Ratio Analysis (SWARA) technique for weighting climate-based criteria and then used Complex Proportional Assessment (COPRAS) method for evaluating them. Abou-Ali and Abdelfattah (2013) applied Principal Component Analysis (PCA) and composite indicator to create overall SD indicator and Millennium Development Goals (MDG) and world development indicator data to measure resource intensity. Then an integrated paradigm presented to study the impact of economic growth, environment and natural resource availability to achieve sustainable development using a panel of 62 countries. Limaei et al. (2014) applied goal programming model to achieve sustainability in forest management of Iranian Caspian forests. They considered parameters such as volume, wood price, growth and harvesting costs and determined optimal harvest volume in their case study. Butnariu and Avasilcai (2015) assessed companies’ sustainable development performance with using composite indicator (CI). They considered economic, environmental and social indicators based on the conventional model of sustainable development such as air pollution, electricity consumption, water consumption, training programs for employees, operational profit, investments, expenses, etc. They also applied this model in evaluating performance of textile manufacturing company. Sayed et al. (2015) presented a new methodology using Meta-Goal Programming Benefit of Doubt (MGP-BoD) to determine CI values. They used MGP-BoD to suggest a new Human Development Index (HDI). Jayaraman et al. (2015a) used a weighted goal programming model for optimal allocation of human resources for the sustainability of environmental, economic and energy in the United Arabic Emirates for 2030. The results expressed some changes in human resources to achieve the desired growth rate in different sectors. In another study, Jayaraman et al. (2015b) applied fuzzy goal programming model for optimal resource allocation in the economic sectors of the United Arab Emirates. They determined suitable goals for GDP, GHG, electricity consumption and labors and estimated the optimal workforce for achieving these goals. In a similar study, Jayaraman et al. (2016a) designed some scenarios for growth rate in different sectors of United Arab Emirates and then, by using a scenario-based stochastic goal programming model, they determined the optimal value of the labors. Also, Jayaraman et al. (2016b) used weighted goal programming model to achieve the predefined goals of GDP, GHG, energy consumption and employees in Gulf Cooperation Council Countries. Pérez et al. (2016) evaluated tourism sustainability based on composite indicators. They combined Data Envelopment Analysis (DEA), PCA and goal
6
programming methods in order to ranking of Cuban tourist destinations. Zhang (2016) applied an integrated ANP-GP approach to find out the priority in the development of Taking Xizang tourism industry. In his study, ten criteria and nine decision variables were determined by using the interviews with stakeholders based on Delphi method. Iribarren et al. (2016) presented a hybrid model based on life cycle assessment and DEA to screen the socio-economic indicators for sustainability assessment. Sayed et al. (2017) studied ranking contradictions in human development and used goal programming model to solve the rank reversal problem. Ifaei et al. (2017) presented a renewable Techno-Econo-Socio-Environmental Multivariate Analysis (TESEMA) in order to investigate sustainable development in Iran. At first related raw data which includes demand load, biogas, hybrid solar, wind and weather items was analyzed with seven dynamic models to select the best prediction model. Then, Social Development Index (SDI) was constructed using TOPSIS technique and Air Pollution Index (API) created by applying Geographic Information Systems (GIS). Finally, PCA, K-nearest neighborhood (KNN), and partial least square (PLS) regression used to investigate SD in cities in Iran.
Many individuals and groups that working on SD are seeking for a way to create harmony between society, environment and economic interests. Indeed, policymakers are facing with different challenges and issues in the realization of SD. Hence, presenting of suitable methods for achieving SD programs is inevitable. The main purpose of this paper is to develop a model that can be used for regional human resources assignment in Iran to satisfy the determined goals which include multiple conflicting objectives as economic criteria (GDP), social criteria (number of employees) and environmental criteria (GHG, energy and electricity consumption) for achieving SD. This study considers two targets minimizing recruitment new workforce and fair distribution of recruitment of new workforce in four sectors agriculture, industry, service and transportation for provinces in Iran. As mentioned, previous literature did not consider these two items. Hence, this paper proposes a WGP model to satisfy these targets. It should be noted that the goal of this model is not competition between sectors and provinces but allocating the resources in an optimum possible way.
The economy of Iran is not solely private, it is the government of Iran to decide about the long-term planning, allocation of resources and investing in different sectors. The allocation of the workforce in different sectors is usually done by Management and Planning Organization (MPO) which is a government-controlled agency.
7
MPO, which is the largest governmental organization of this kind, has been established in 1948. In addition to allocating and hiring manpower in different sectors of each province, MPO has variety other duties including the evaluation of the country's resources, preparation and monitoring of development plans, preparation of annual budgets, etc. This paper proposes a mathematical model which can be used by MOP in order to plan and determine number of required workforce in each sectors and provinces by considering targets/goals for each indicator in long-term of the next government plan in 2030. Based on the results of this paper, MPO can manage workforce and the government and other responsible authorities are able to optimise their decisions to macroeconomic and regional planning.
Therefore, the research questions that arise in this paper are as follows:
1) How many workforce is required in each of the agriculture / industry / transportation and service sector of Iran’s provinces to achieve determined growth of SD indicators in 2030 horizon?
2) How many workforce is required for fair distribution of recruitment among the provinces and sectors in order to achieve determined growth rate of SD indicators in 2030 horizon?
In most cases, we are dealing with problems which includes different objectives for decision making. Therefore, researchers have been focused on Multi-Objective Decision Models (MODM) in recent decades. The MODM models allow to simultaneously survey various goals (sometimes contradictory) in a problem and select most satisfactory solution in a set of accessible solutions. One of the popular MODM techniques is goal programming model. Therefore, to achieve the purpose of this study two weighted goal programming models are proposed. In the first model, four objective functions for GDP, energy and electricity consumption are considered. We have also introduced two objective functions for GHG and total number of employees. Then, the growth rates are designed for selected criteria in agriculture, industry, service and transportation sectors. The model minimizes recruitment of new workforce and allows trade-off for the current workforce among four sectors agriculture, industry, services and transportation in each province.
Second model has been designed to find a fair distribution of recruitment of new workforce among the provinces and sectors. For this reason, we have revised the first model by adding several new constraints. It should be noted that the second model allows the reduction in number of labor in order to achieve defined goals. Reduction in workforce is based on the preferences determined by policy makers. In this study, the proposed model allows authorities to determine the optimal workforce by trade-off workforce between different sectors in each province.
8
3. Data and Methodology
3.1. Data
In this paper, the indicators are selected based on previous studies. Five important criteria including GDP, GHG, energy consumption, electricity consumption and number of employees are selected which includes various aspects of SD. Also, four important sectors including agriculture, industry, services, and transportation are considered that have most workforce in Iran. The GHG is the sum of eight different gases consist of NOx, SO2, SO3, CO, SPM, CO2, CH4 and NO2 and belong to agriculture, industry, transportation and service sectors, power stations and refineries. The education, health, illiteracy, science and technology and housing are considered in service sector. Due to the importance of transportation, this sector was considered separately.
The data is gathered from provinces of Iran. Iran has 31 provinces where Tehran is the capital of it.Iran is an energy superpower so that it hasthehuge source of fossil fuels including natural gas and oil sources. Hence, energy plays a key role in Iran policy. Tehran, Isfahan, East Azerbayjan, Yazd, Ghazvin and Khorasan Razavi are considered as the most industrialized provinces of Iran. They have large number of active factories and industrial producers.
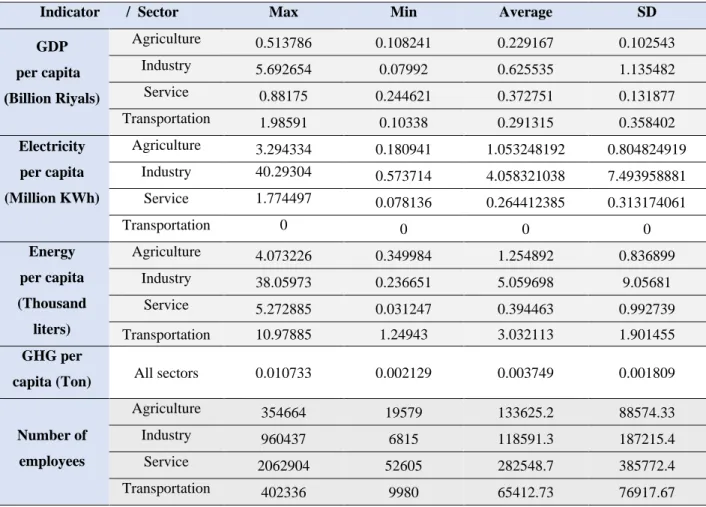
As mentioned in section 2, several organizations such as World Bank, UN, and International Energy Agency present several SD indicators. Since, the data in Iran is not usually reported in these organizations, hence, the related data is gathered from different sources. The GDP, GHG and number of employees have been obtained from Statistical Center of Iran (www.amar.org.ir). The Electricity consumption in different sectors is collected from publication of Electricity Power Industry Statistics (http://amar.tavanir.org.ir). The energy consumption in different sectors has been extracted from Iran Energy Efficiency Organization (www.saba.org.ir). Only 26 provinces in Iran have been included in this study as the data is available for them in 2014. Table (1) shows the statistical summary of all indicators used in this research.
[Table 1 here]
According to Table (1), the highest and lowest GDP in industry sector belong to Hormozgan and Golestan, respectively. Yazd has the highest value of electricity indicator. The electricity consumption in transportation sector is very low in Iran and it is negligible for the provinces. So, the zero value was considered for all provinces. Based
9
on Table (1), the highest and lowest energy indicator belong to Hormozgan, in industry sector, and Zanjan, in service sector, respectively. Due to the unavailability data for GHG in each sector, separately, this indicator is considered for all sectors. The highest and lowest GHG belong to Hormozgan and Kohgiluyeh-Buyer Ahmad, respectively. Finally, highest and lowest number of employees’ indicator belong to Tehran and Alborz in service sector and Ilam in industry sector, respectively.
3.2. Methodology
Decision making is one of the most important tasks for managers in order to achieve organizational goals. Nowadays, MCDM techniques are used by managers which has capacity to consider different conflict criteria for decision making. There are two main categories of MCDM: Attribute Decision Making (MADM) and Multi-Objective Decision Making (MODM). In MODM techniques, decision makers (DM) searches the problem space to find out the Pareto solutions which satisfy related constraints. Some of the MODM techniques are: weighted sum method, goal programming, goal attainment, epsilon-constraint approach, etc. In this paper, weighted goal programming model, as discussed in the following paragraph, has been used.
Goal programming was introduced by Charnes and Cooper (1955), then expanded by Lee (1972) and Lee and Clayton (1972). It is a powerful and popular MODM technique to incorporate the DM judgments in the real-world applications. In GP model, decision makers want to achieve several goals, simultaneously. Namely, DM determines the value of goals for objective functions and then, sum of the deviation of goals are minimized. Nowadays, this approach is used in many areas including: accounting and financial aspect of stock management, marketing, human resources, quality control, production and operations management to solve multi objective problems (Jayaraman et al. 2015a).
Related to the problem structure, GP model can formulate as linear, nonlinear or integer programming. GP models are solved by three general approaches: weighted GP, lexicographic GP and Chebyshev GP (Jones and Tamiz, 2010). The general formulation of a GP model is as follows:
Model (1): 1
(
)
K k k kMin
d
d
(1)10
(
)
k k k1, 2,...,
k kf x
d
d
b
k
K
(2) kx
S
(3),
0
1, 2,...,
k kd
d
k
K
(4)where S is the feasible set,
b
kis the goal level for kth objective function and kd
andd
kare the negative and positive deviations with respect to the goal levelb
k, respectively. Another type of GP is weighted goal programming model which considers weights for deviations. The standard WGP model formulation is as follows:Model (2): 1
(
)
K k k k k kMin
w d
w d
(5)(
)
k k k1, 2,...,
k kf x
d
d
b
k
K
(6) kx
S
(7),
0
1, 2,...,
k kd
d
k
K
(8)where
w
i andw
k are the related weights for negative and positive deviations, respectively.3.3. Proposed models
In this paper, two types of weighted GP are formulated for planning the workforce in different provinces of Iran. It should be noted that we have assumed that Iran has a public economic where MPO is responsible for allocating labor forces. Due to the political situation and the existence of sanctions, the foreign labor forces and investments are not considered. In total, we have included 26 provinces in four sectors. The main criteria included in this model are: GDP, Electricity consumption, Energy consumption, GHG and total number of employees. The goal of this model is not competition between sectors and provinces. In fact, this study presents a strategy to determine the optimal work force in each sector of provinces in Iran.
11 Sets:
i: Number of province j: Number of sector
k: Number of objective function
Parameters: k
i
A
: Coefficient of kth objective function in ith province ji
q
: Number of current employees of ith province in jth sectork
w
: Weight of kth objective functionp
w
: Weight of ith provincek
b
: Goal of kth objective function
: Recruitment growth rate
: Goals growth rateVariables: j i
x
: Number of employees in jth sector of ith provincek
d
: Positive deviation in kth objective functionk
d
: Negative deviation in kth objective functioni
dp
: Positive deviation in number of workforce for ith provincei
dp
: Negative deviation in number of workforce for ith provinceBased on the current economy of Iran, we assumed that the country growth rate is
= 4%, however this assumption can easy be changed in the model. Also, all relative weights for objective functions are considered to be equal to one. Indeed, based on the decision makers’ opinion, the importance of four sectors is the same and hence, the relative weights are considered equal to one.12
For GDP, four objective functions in four sectors are considered. First one,
f
1 belongs to agriculture and formulated as follows. The current value for GDP in agriculture sector is 693,153 billion Rials. With growth rate 4%, the relevant goal isb
1= 693153+0.04*693153=720879.1. It is notable that the goals for others objective functions are calculated similar tob
1 .1 1 1 1 1 1
1 1 1 2 2
...
26 26f
A x
A x
A x
(9)Second objective function,
f
2, belongs to GDP in industry sector. The current value for GDP in industry sector is 1027893. By considering growth rate 4%, its goal isb
2= 1069009.f
2 is formulated as follows:2 2 2 2 2 2
2 1 1 2 2
...
26 26f
A x
A x
A x
(10)Finally,
f
3 andf
4 are representing to GDP for service and transportation sectors, respectively. The relative goals areb
3=3186733 andb
4= 586416.5, respectively.f
3andf
4are expressed as follows:3 3 3 3 3 3 3 1 1 2 2
...
26 26f
A x
A x
A x
(11) 4 4 4 4 4 4 4 1 1 2 2...
26 26f
A x
A x
A x
(12)Another criterion is electricity consumption. Four objective functions
f
5,f
6,f
7andf
8 belong to electricity consumption in agriculture, industry service and transportation sectors, respectively. The relative goals are5
b
=3283488,b
6=6882408 andb
7= 1729936. The formulations of objective functions are as follows:5 1 5 1 5 1
5 1 1 2 2
...
26 2613 6 2 6 2 6 2 6 1 1 2 2
...
26 26f
A x
A x
A x
(14) 7 3 7 3 7 3 7 1 1 2 2...
26 26f
A x
A x
A x
(15) 8 4 8 4 8 4 8 1 1 2 2...
26 26f
A x
A x
A x
(16)Energy consumption is the next criterion which has four objective functions
f
9,f
10,f
11,f
12. The goals for four objective functions areb
9= 3896517,b
10=4961095,b
11=1500930 andb
12=438962.2. The objective functions belong to agriculture, agriculture, industry, service and transportation can be formulated as follows:9 1 9 1 9 1 9 1 1 2 2
...
26 26f
A x
A x
A x
(17) 10 2 10 2 10 2 10 1 1 2 2...
26 26f
A x
A x
A x
(18) 11 3 11 3 11 3 11 1 1 2 2...
26 26f
A x
A x
A x
(19) 12 4 12 4 12 4 12 1 1 2 2...
26 26f
A x
A x
A x
(20)For GHG emission, only one objective function,
f
13, is considered which shows total greenhouse gas emission in Iran. The goal for GHG emission isb
13= 5921191.567.26 4 13 13 1 2 3 4 13 1 2 3 4 13 1 2 3 4 13 1 1 1 1 1 2 2 2 2 2 26 26 26 26 26 1 1 ( ) ( ) ... ( ) i ij i j f A x A x x x x A x x x x A x x x x
(21)Total number of employees,
f
14 in agriculture, industry, service and transportation sectors is considered as last criteria. The goal for this objective function isb
14=16228811.14 26 4 1 2 3 4 1 2 3 4 1 2 3 4 14 1 1 1 1 2 2 2 2 26 26 26 26 1 1
(
) (
) ... (
)
ij i jf
x
x
x
x
x
x
x
x
x
x
x
x
x
(22) 3.3.1. First WGP modelFirst, using the WGP model we minimize recruitment of new workforce. If there is enough labor force, the model allows trade-off between the current workforce among four sectors agriculture, industry, services and transportation and within each province with respect to their own requirements. The proposed WGP model is formulated as follows: Model (3): 14 1 1 1 2 2 2 14 14 14 1
(
)
(
)
(
) ...
(
)
k k k kMin z
w d
d
w d
d
w d
d
w
d
d
(23) Subject to: 1 1 1 1 1 1 1 1 2 2...
26 26 1 1 1A x
A x
A x
d
d
b
(24) 2 2 2 2 2 2 1 1 2 2...
26 26 2 2 2A x
A x
A x
d
d
b
(25) 3 3 3 3 3 3 1 1 2 2...
26 26 3 3 3A x
A x
A x
d
d
b
(26) 4 4 4 4 4 4 1 1 2 2...
26 26 4 4 4A x
A x
A x
d
d
b
(27) 5 1 5 1 5 1 1 1 2 2...
26 26 5 5 5A x
A x
A x
d
d
b
(28) 6 2 6 2 6 2 1 1 2 2...
26 26 6 6 6A x
A x
A x
d
d
b
(29) 7 3 7 3 7 3 1 1 2 2...
26 26 7 7 7A x
A x
A x
d
d
b
(30) 8 4 8 4 8 4 1 1 2 2...
26 26 8 8 8A x
A x
A x
d
d
b
(31) 9 1 9 1 9 1 1 1 2 2...
26 26 9 9 9A x
A x
A x
d
d
b
(32) 10 2 10 2 10 2 1 1 2 2...
26 26 10 10 10A x
A x
A x
d
d
b
(33) 11 3 11 3 11 3 1 1 2 2...
26 26 11 11 11A x
A x
A x
d
d
b
(34)15 12 4 12 4 12 4 1 1 2 2
...
26 26 12 12 12A x
A x
A x
d
d
b
(35) 26 4 13 13 1 2 3 4 13 1 2 3 4 13 1 2 3 4 1 1 1 1 1 2 2 2 2 2 26 26 26 26 26 13 13 13 1 1 ( ) ( ) ... ( ) i ij i j A x A x x x x A x x x x A x x x x d d b
(36) 26 4 1 2 3 4 1 2 3 4 1 2 3 4 1 1 1 1 2 2 2 2 26 26 26 26 14 14 14 1 1(
) (
) ... (
)
ij i jx
x
x
x
x
x
x
x
x
x
x
x
x
d
d
b
(37)1, 2,..., 26
1, 2,3, 4
[0,1]
j j i ix
q
i
j
(38) 4 4 1 11, 2,..., 26
j j i i j jx
q
i
(39),
0
1, 2,...,14
k kd
d
k
(40)1, 2,..., 26
1, 2,3, 4
j ix
are integer
i
j
(41)where
represents recruitment growth. In model (3), the constraint (38) expresses that the optimal workforce should be greater than % of the current workforce in each sector of provinces with respect to the goals. For example, if
90%, to achieve the goals, the province ith can reduce workforce in sector jth up to 10%. Also, the constraint (39) represents that sum of the optimal workforce in four sectors should be greater than sum of the current optimal workforce for each province. Indeed, the constraints (38) and (39) allow trade-off between the current workforce in each province.
3.3.2. Second WGP model
The aim in the second WGP model is to find the optimal distribution of new workforce in each provinces and sectors. In this model, the provinces can reduce their number of workforce to gain the predefined goals. In the second model, new constraint (42) has been added while constraint (39) has been removed from the first WGP model. 4 4 1 1
(1
)
1, 2,..., 26 ,
[0,1]
j j i i i i j jx
dp
dp
q
i
(42)16
where
is the country growth rate (assumed to be 4% in this case). In a similar way we can set growth rate for each province. In constraint (42), the numbers of workforce for each province can increase up to
percent. By definingdp
i anddp
ias positive and negative deviations in number of workforce for ith province, the objective function of second WGP model can be expressed as follows:14 26 1 1 1 14 14 14 1 1 1 14 14 14 1 1 ( ) ( ) ( ) ... ( ) ( ) ... ( ) k k k i i i k i Min z w d d wp dp dp w d d w d d wp dp dp wp dp dp
(43)4. Results and discussion
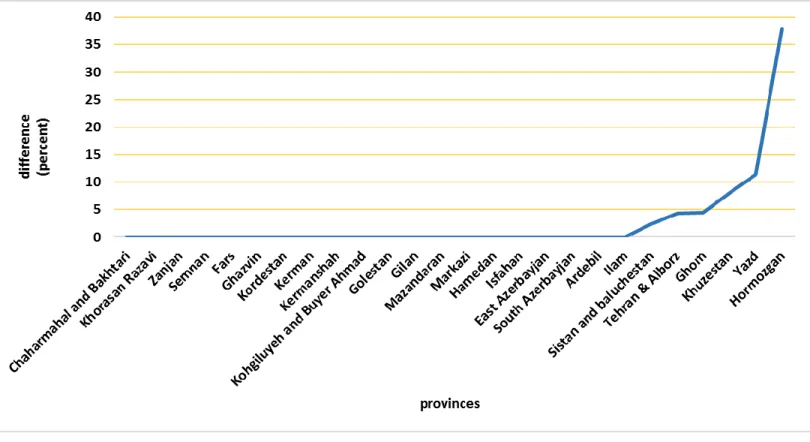
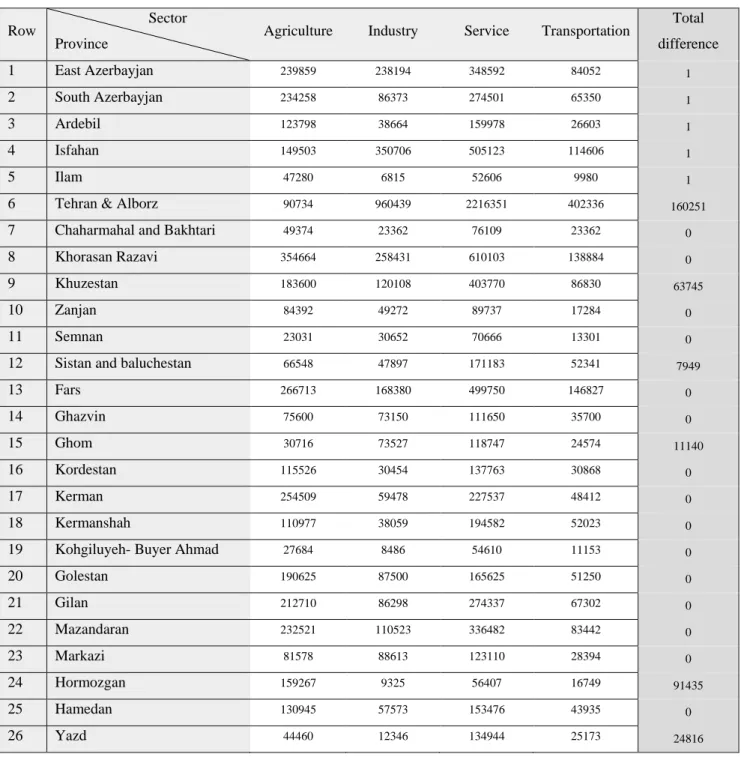
In this section, the proposed models are applied to planning sustainable development of 26 provinces in Iran for the year 2030 planning program. First, the WGP model (3) is solved for workforce optimization. This model helps policy makers to employ optimal number of workforce in each sector and foe each province with respect to the goals as defined the 2030 macroeconomic and regional planning. It is assumed that the growth rate is equal to 4% for all goals. The results of the first WGP model with
100%
are shown in Table (2) and Figure (1).
100%
shows that the number of workforce for each sector in each province should be at least equal to the current values. The results indicate that Hormozgan has highest changes in workforce with 37.82% growth.As can be seen, in of each province there are either minor or no changes in workforce. A few provinces need to employ new workforce. For example, Yazd province should employ 24816 new workforce to achieve growth rate of 4%. In order to achieve desirable goals, overall Iran needs to employ 359341 new workforce which should be distributed in some provinces according to Table (2).
[Table 2 here]
[Figure 1 here]
Table (3) reports the positive and negative deviation variables. As shown in Table (3), many objective functions have nonzero deviations. The value of
d
12 is 3781827.930 which shows that the transportation sector needs to more17
energy resources to achieve growth rate 4%. Also, the value of
d
4 is 22554.480 which shows that the GDP produced by transportation sector is enough. The results indicate that the transportation sector need a suitable planning for achieving growth rate 4%.[Table 3 here]
According to this, the workforce is enough in some provinces but they are not distributed correctly between various sectors. Therefore, it is not necessary to increase workforce but this model helps to reallocate the workforce to different sectors according to their need.
The data provided by Statistical Center of Iran1 in the last five years shows that the agriculture, industry, service and transportation sectors have dedicated 18.3%, 16.68%, 51% and 9.86% of workforce. The results of first WGP model demonstrates relative distribution of workforce for each sector in year 2030 will be 22.1%, 20.4%, 47% and 10.5% respectively. Changes in the distribution of workforce in four sectors are reported 3.8%, 3.72%, -4% and 0.64%, respectively, in comparison with the current situation. In addition, in second model, relative distributions are 22.44%, 19.51%, 47.4% and 10.65%, showing that changes in the sectors are 4.14%, 2.83%, -3.6% and 0.79%, respectively.
Table (4) shows the results of first WGP model, assuming
90%
which allows the provinces to have trade off workforce between different sectors up to 10%. For example, Hormozgan province should increase 78641 and 8619 labors in agriculture and service sectors and in contrast, it should reduce 932 and 1674 labors in industry and transportation sectors. In other words, Hormozgan needs to employ 84664 new workers to achieve growth rate of 4%. Also, similar to
100%
, in
90%
case, Hormozgan has highest changes with 36.03% growth in workforce. Table (5) shows the values for positive and negative deviations. Similar to Table (3), most deviations have occurred in objective functions related to transportation sector.[Table 4 here]
1www.amar.org.ir
18 [Table 5 here]
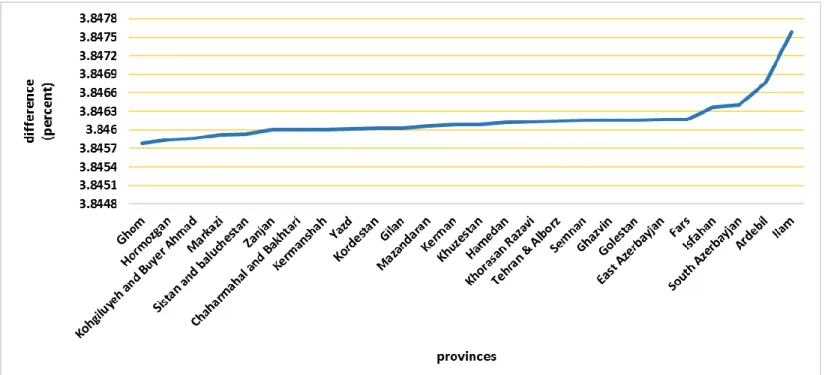
Now, the results of second WGP model are discussed. In the second model, the growth rate 4% is considered for each province, separately. In other words, the growth rate of 4% in the whole country probably causes that the new workforce has not been allocated fairly among provinces and sectors. So, to allocate equitable new workforce among provinces, it is assumed that all provinces should increase the workforce up to 4% (
4%
). The results of second WGP model are shown in Table (6) and Figure (2). As can be seen, Ilam has the largest changes of 3.85% growth in employees. Namely, Ilam should employ 4669 new employees to achieve the growth rate of 4%. The numbers of new employees are shown in Table (6) for other provinces.[Table 6 here]
[Figure 2 here]
Table (7) shows deviation variables for each province and objective functions. The results express that the Semnan (
dp
11
dp
11
0
), Ghazvin (dp
14
dp
14
0
) and Golestan (dp
20
dp
20
0
) do not have any deviation and other provinces have negligible low deviations. Also, similar to the first model, there are very high positive and negative deviations in energy and GDP for transportation sector, respectively.[Table 7 here]
The results of the second model for
90%
are summarized in Table (8) and (9). It is clear that Ilam has the highest workforce changes with 3.84% growth. The results reported in Table (8) show that all provinces increase or decrease workforce in different sectors. Due to growth rate of 4%, the goal for all provinces is increasing the workforce equal to 4% of current level (
4%
).19 [Table 9 here]
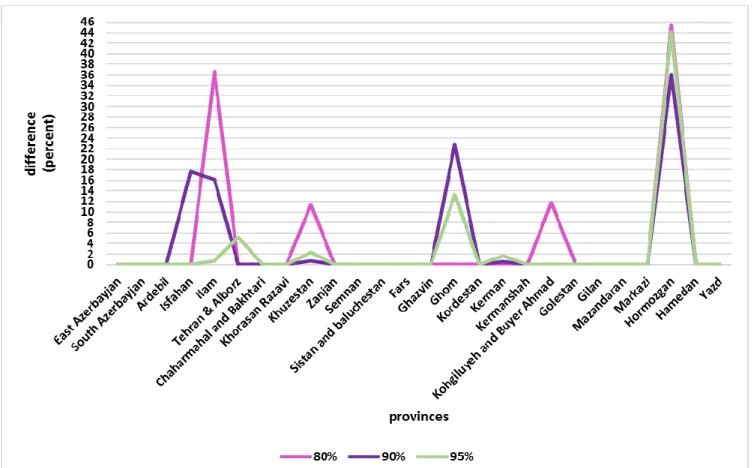
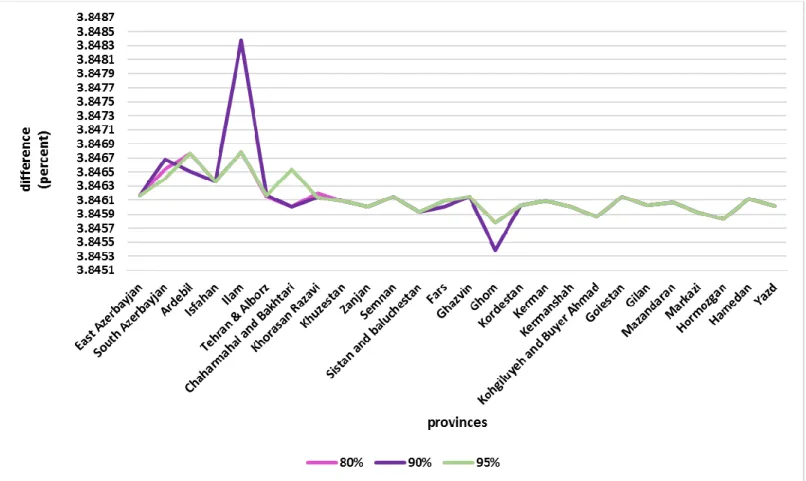
Table (10) and Figures (3) and (4) show the changes in workforce with changing α value. The values for α are considered equal to 80%, 90% and 95%. The Figures (3) and (4) compare these changes in both models for all provinces.
[Table 10 here]
[Figure 3 here]
[Figure 4 here]
The results of these two models indicate that GDP and energy consumption in transportation sector have unfavorable deviation values. Hence according to these results, it is necessary for the government to invest more in transportation system and planning to use renewable sources in this section.
4.1. Sensitivity Analysis
In this study, the relative goals are designed for GDP, electricity, energy and GHG emission by decision makers in Iran and the optimal workforce are determined with respect to 4% growth rate as set by the Government. With respect to the existence of international sanctions, in addition to decline of the growth rates, the Iranian economy suffered a radical shift during the years of the boycott. The oil, automotive, and construction sectors fell further than other sectors so that the growth rate of GDP was – 1.9% in 2013 (Devarajan & Mottaghi, 2015). In addition, available data reported by Statistical Center of Iran shows that the average energy and electricity consumption in four mentioned sectors are 1.2% and 1.63%, respectively in 2013. Also, the average of GHG emission in four sectors is 1.93%. The mean of growth rate of GDP for period 2001-2013 was 3.51 (www.amar.org.ir). Therefore, due to unsustainable economic condition in Iran, growth rate of GDP has been set to 4%.
Unfavorable trend of economic growth in Iran has led to increase in unemployment rate in recent years. The latest reports of Central Bank of Iran reveal that the unemployment rate is 12.4% while employment growth is close to 1%
20
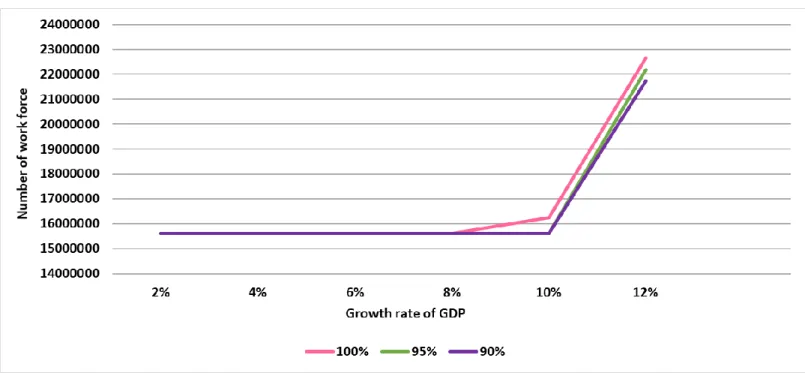
currently. The following items can be considered as factors which leads to low growth of employment in the Iran: economic fluctuations, the lack of adequate distribution between incomes and facilities, the lack of recruitment of workforce in industrial and manufacturing centers, the disparity between the growth rate of population and job opportunities, the weakness of laws and regulations and the lack of proportional training with the needs of the job market. Hence, in this study, the growth of workforce has not been considered in high level and it is set equal to 4%. To evaluate the trend of workforce changes, several growth rates for GDP, energy consumption, electricity consumption and GHG have been analysed at three recruitments rates-100%, 95% and 90%. Figure (5) shows the workforce changes under growth rates of 2%, 4%, 6%, 8%, 10% and 12% for GDP. As can be seen, there are no changes up to 10%, while noticeable changes have been observed in higher growth rates.
[Figure 5 here]
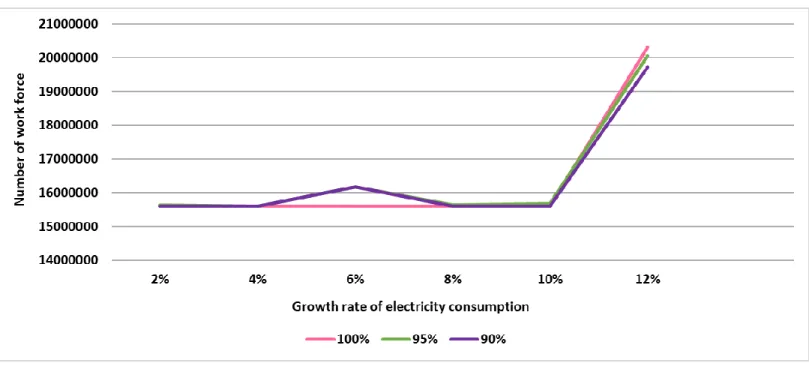
Figure (6) shows that workforce, for electricity consumption, there are no changes in range 2%-10% except in growth rate 8% under recruitment rates 90% and 95%. Similar to the GDP, in higher rates, the changes of workforce under three recruitments are observed.
[Figure 6 here]
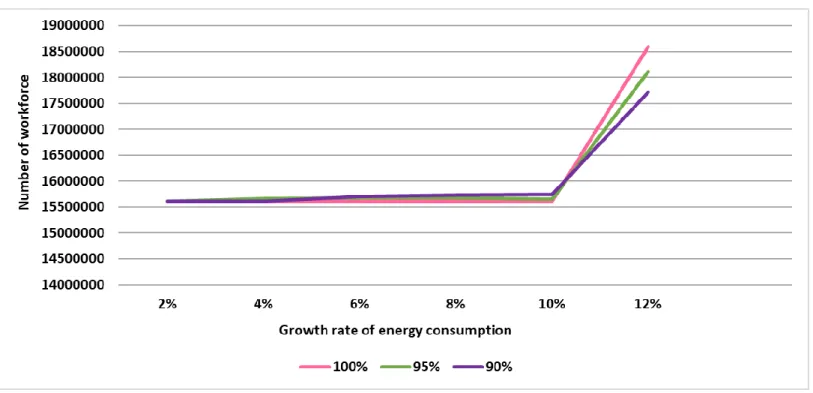
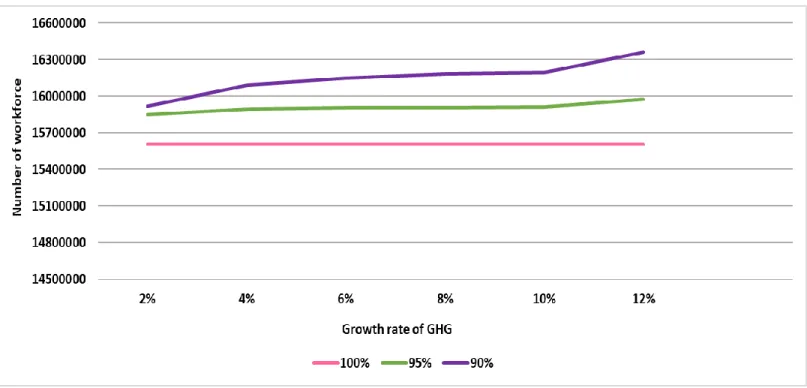
Figure (7) shows the workforce changes in seven mentioned growth rates and three recruitment rates in energy consumption. It expresses that changes pattern is similar to the GDP. Also, the workforce changes based on GHG growth rates are shown in Figure (8).
[Figure 7 here] [Figure 8 here]
21
5. Conclusions and direction for future research
This paper presents two weighted goal programming models for planning sustainable development in 26 provinces of Iran by the year 2030. Some important criteria include GDP, electricity and energy consumption, GHG and number of human resource in four sectors agriculture, industry, service and transportation are considered. The aim of this study is providing a framework for the authorities and government to studying the interaction between economic, environment and social items and make a suitable decision to macroeconomic and regional planning. The proposed WGP models allocate optimal level of workforce to simultaneously satisfy predefined multiple conflicting goalsincluding social, economic and environmental factors. In Iran, the government decides about the long-term planning, allocation of resources in required sectors and it is usually done by MOP which is a government-controlled agency. Both models show that the GDP and energy consumption in transportation sector need to be improved, hence it is important for the government to make serious decisions to achieve the goals. One way to take forward is a proper plan for the use of clean energy such as solar, wind, atomic, hydropower energy to attain goal of energy consumption.
Due to the existence political sanctions, indicators such as foreign labor forces and investments are not included in the proposed model which can be considered as a research limitation, this might be subject of future studies.
References
Abou-Ali, H., & Abdelfattah, Y. M. 2013. Integrated paradigm for sustainable development: A panel data study. Economic Modelling, 30, 334-342.
Bao, C., & Fang, C. L. 2013. Geographical and environmental perspectives for the sustainable development of renewable energy in urbanizing China. RENEW SUST ENERG REV, 27, 464-474.
Bečić, E., Mulej, E. M., & Švarc, J. 2012. Measuring social progress by sustainable development indicators: cases of Croatia and Slovenia. Procedia Soc. Behav. Sci,37, 458-465.
22
Beckerman, W. 1992. Economic growth and the environment: Whose growth? Whose environment? WORLD DEV, 20(4), 481-496.
Bolcárová, P., & Kološta, S. 2015. Assessment of sustainable development in the EU 27 using aggregated SD index.ECOL. INDIC, 48, 699-705.
Butnariu, A., & Avasilcai, S. 2015. The assessment of the companies’ sustainable development performance. PROC ECON FINANC, 23, 1233-1238.
Charnes, A., Cooper, W. W., & Ferguson, R. O. 1955. Optimal estimation of executive compensation by linear programming. MANAGE SCI,1(2), 138-151.
Ciegis, R., Ramanauskiene, J., & Startiene, G. 2015. Theoretical reasoning of the use of indicators and indices for sustainable development assessment. Engineering Economics, 63(4), 33-40.
Commission of the European Communities (CEC), 2001. A Sustainable Europe for a Better World: The European Union Strategy for Sustainable Development. Commission of the European Communities, Brussels.
Devarajan, S., & Mottaghi, L. 2015. MENA Quarterly Economic Brief, January 2015: Plunging Oil Prices. Washington, DC: World Bank.
Donnelly, A., Jones, M., O'Mahony, T., & Byrne, G. 2007. Selecting environmental indicator for use in strategic environmental assessment. ENVIRON IMPACT ASSES,27(2), 161-175.
Greaker, M., Stoknes, P. E., Alfsen, K. H., & Ericson, T. 2013. A Kantian approach to sustainable development indicators for climate change. ECOL. INDIC,91, 10-18.
Hak, T., Kovanda, J., & Weinzettel, J. 2012. A method to assess the relevance of sustainability indicators: Application to the indicator set of the Czech Republic's Sustainable Development Strategy.ECOL. INDIC, 17, 46-57.
Henriques, C. O., & Antunes, C. H. 2012. Interactions of economic growth, energy consumption and the environment in the context of the crisis–A study with uncertain data. Energy, 48(1), 415-422.
Iddrisu, I., & Bhattacharyya, S. C. 2015. Sustainable Energy Development Index: A multi-dimensional indicator for measuring sustainable energy development.RENEW SUST ENERG REV,50, 513-530.
23
Ifaei, P., Karbassi, A., Lee, S., & Yoo, C. 2017. A renewable energies-assisted sustainable development plan for Iran using techno-econo-socio-environmental multivariate analysis and big data. ENERG CONVERS MANAGE, 153, 257-277.
Iribarren, D., Martín-Gamboa, M., O’Mahony, T., & Dufour, J. 2016. Screening of socio-economic indicators for sustainability assessment: a combined life cycle assessment and data envelopment analysis approach. Int J Life Cycle Assess, 21(2), 202-214.
Jayaraman, R., Colapinto, C., Liuzzi, D., & La Torre, D. 2016a. Planning sustainable development through a scenario-based stochastic goal programming model. OPER. RES, 1-17. DOI: 10.1007/s12351-016-0239-8. Jayaraman, R., Colapinto, C., La Torre, D., & Malik, T. 2016b. A Weighted Goal Programming model for planning
sustainable development applied to Gulf Cooperation Council Countries. APPL ENERG. http://dx.doi.org/10.1016/j.apenergy.2016.04.065.
Jayaraman, R., La Torre, D., Malik, T., & Pearson, Y. E. 2015a. Optimal Work Force Allocation for Energy, Economic and Environmental Sustainability in the United Arab Emirates: A Goal Programming Approach. Energy Procedia, 75, 2999-3006.
Jayaraman, R., Liuzzi, D., Colapinto, C., & Malik, T. 2015b. A fuzzy goal programming model to analyze energy, environmental and sustainability goals of the United Arab Emirates. ANN OPER RES, 1-16. DOI: 10.1007/s10479-015-1825-5
Jones, D., & Tamiz, M. 2010. Case study: Application of goal programming in portfolio selection. In Practical Goal Programming. International series in operations research & management science (pp. 141.151-160). Springer US.
Karakosta, C., & Askounis, D. 2010. Developing countries' energy needs and priorities under a sustainable development perspective: A linguistic decision support approach. ENERGY SUSTAIN DEV, 14(4), 330-338. Kılkış, Ş. 2015. Sustainable development of energy, water and environment systems index for Southeast European
cities. J CLEAN PROD, 130,222-234.
Lee, S. M. 1972. Goal programming for decision analysis of multiple objectives. SLOAN MANAGE REV, 14, 11–24.
Lee, S. M., & Clayton, E. R. 1972. A goal programming model for academic resource allocation. MANAGE SCI, 18(8), B-395.
24
Limaei, S. M., Kouhi, M. S., & Sharaji, T. R. 2014. Goal programming approach for sustainable forest management (case study in Iranian Caspian forests). J FORESTRY RES, 25(2), 429-435.
Masih, A. M., & Masih, R. 1997. On the temporal causal relationship between energy consumption, real income, and prices: some new evidence from Asian-energy dependent NICs based on a multivariate cointegration/vector error-correction approach.J POLICY MODEL, 19(4), 417-440.
Munda, G. 2005. Multiple criteria decision analysis and sustainable development. In Multiple criteria decision analysis: State of the art surveys. Springer New York, 953-986.
Niemeijer, D., & de Groot, R. S. 2008. A conceptual framework for selecting environmental indicator sets. ECOL. INDIC,8(1), 14-25.
OECD, 2001. The Well Being of Nations: The Role of Human and Social Capital. OECD Publication Available at: http://www.oecd.org.
Ozyurt, O. 2010. Energy issues and renewables for sustainable development in Turkey. RENEW SUST ENERG REV, 14(9), 2976-2985.
Pérez, V., Hernández, A., Guerrero, F., León, M. A., da Silva, C. L., & Caballero, R. 2016. Sustainability ranking for Cuban tourist destinations based on composite indexes. Social Indicators Research, 129(1), 425-444. Ren, H., Zhou, W., Nakagami, K. I., Gao, W., & Wu, Q. 2010. Multi-objective optimization for the operation of
distributed energy systems considering economic and environmental aspects. APPL ENERG, 87(12), 3642-3651.
Rinne, J., Lyytimäki, J., & Kautto, P. 2013. From sustainability to well-being: Lessons learned from the use of sustainable development indicators at national and EU level.Ecol. Indic,35, 35-42.
San Cristóbal, J. R. 2012. A goal programming model for environmental policy analysis: Application to Spain. ENERG POLICY, 43, 303-307.
Sayed, H., Hamed, R., Ramadan, M. A. G., & Hosny, S. 2015. Using meta-goal programming for a new human development indicator with distinguishable country ranks. Social Indicators Research, 123(1), 1-27.
Sayed, H., Hamed, R., Hosny, S. H., & Abdelhamid, A. H. 2017. Avoiding Ranking Contradictions in Human Development Index Using Goal Programming. Social Indicators Research, 1-38. DOI: https://link.springer.com/article/10.1007/s11205-017-1663-8.
25
Sébastien, L., & Bauler, T. 2013. Use and influence of composite indicators for sustainable development at the EU-level.ECOL. INDIC,35, 3-12.
Tsai, W. H., & Chou, W. C. 2009. Selecting management systems for sustainable development in SMEs: A novel hybrid model based on DEMATEL, ANP, and ZOGP. EXPERT SYST APPL, 36(2), 1444-1458.
UNCED, 1992. Agenda 21, Programme of Action for Sustainable Development, adopted at the United Nations Conference on Environment and Development, Rio de Janeiro, Brazil.
Wilson, J., Tyedmers, P., & Pelot, R. 2007. Contrasting and comparing sustainable development indicator metrics.ECOL. INDIC,7(2), 299-314.
World Summit for Social development Copenhagen 1995, http://www.un.org/esa/socdev/wssd/index.html
Yang, H. Y. 2000. A note on the causal relationship between energy and GDP in Taiwan.ENERG ECON,22(3), 309-317.
Zhang, J. 2016. Weighing and realizing the environmental, economic and social goals of tourism development using an analytic network process-goal programming approach. J CLEAN PROD, 127, 262-273.
Zolfani, S. H., & Zavadskas, E. K. 2013. Sustainable development of rural areas’ building structures based on local climate. PROCEDIA ENGINEER, 57, 1295-1301.
26
27
28
29
30
31
32
33
34
Table 1: Summary statistics of indicators in each sector
Indicator / Sector Max Min Average SD
GDP per capita )Billion Riyals) Agriculture 0.513786 0.108241 0.229167 0.102543 Industry 5.692654 0.07992 0.625535 1.135482 Service 0.88175 0.244621 0.372751 0.131877 Transportation 1.98591 0.10338 0.291315 0.358402 Electricity per capita (Million KWh) Agriculture 3.294334 0.180941 1.053248192 0.804824919 Industry 40.29304 0.573714 4.058321038 7.493958881 Service 1.774497 0.078136 0.264412385 0.313174061 Transportation 0 0 0 0 Energy per capita (Thousand liters) Agriculture 4.073226 0.349984 1.254892 0.836899 Industry 38.05973 0.236651 5.059698 9.05681 Service 5.272885 0.031247 0.394463 0.992739 Transportation 10.97885 1.24943 3.032113 1.901455 GHG per
capita (Ton) All sectors 0.010733 0.002129 0.003749 0.001809
Number of employees Agriculture 354664 19579 133625.2 88574.33 Industry 960437 6815 118591.3 187215.4 Service 2062904 52605 282548.7 385772.4 Transportation 402336 9980 65412.73 76917.67
35
Table 2: Optimal workforce for each province based on the first WGP model (
=100%)Row Sector
Province Agriculture Industry Service Transportation
Total difference 1 East Azerbayjan 239859 238194 348592 84052 1 2 South Azerbayjan 234258 86373 274501 65350 1 3 Ardebil 123798 38664 159978 26603 1 4 Isfahan 149503 350706 505123 114606 1 5 Ilam 47280 6815 52606 9980 1
6 Tehran & Alborz 90734 960439 2216351 402336 160251
7 Chaharmahal and Bakhtari 49374 23362 76109 23362 0
8 Khorasan Razavi 354664 258431 610103 138884 0
9 Khuzestan 183600 120108 403770 86830 63745
10 Zanjan 84392 49272 89737 17284 0
11 Semnan 23031 30652 70666 13301 0
12 Sistan and baluchestan 66548 47897 171183 52341 7949
13 Fars 266713 168380 499750 146827 0 14 Ghazvin 75600 73150 111650 35700 0 15 Ghom 30716 73527 118747 24574 11140 16 Kordestan 115526 30454 137763 30868 0 17 Kerman 254509 59478 227537 48412 0 18 Kermanshah 110977 38059 194582 52023 0
19 Kohgiluyeh- Buyer Ahmad 27684 8486 54610 11153 0
20 Golestan 190625 87500 165625 51250 0 21 Gilan 212710 86298 274337 67302 0 22 Mazandaran 232521 110523 336482 83442 0 23 Markazi 81578 88613 123110 28394 0 24 Hormozgan 159267 9325 56407 16749 91435 25 Hamedan 130945 57573 153476 43935 0 26 Yazd 44460 12346 134944 25173 24816
36
Table 3: Positive and negative deviations in the first WGP model (
=100%)Value Value 1 d 0.127 d1 0 2 d 0.538 d2 0 3 d 0.046 d3 0 4 d 0 d4 22554.480 5 d 0 d5 0.495 6 d 0 d6 0.401 7 d 0 d7 0.174 8 d 0 d8 0 9 d 0 d9 0.203 10 d 0.44 d10 0 11 d 0 d11 0.753 12 d 3781827.930 d12 0 13 d 0 d13 0 14 d 0 d14 0
37
Table 4: Optimal workforce in each province based on the first WGP model with
= 90%Row
Sector
Province
Agriculture Industry Service Transportation
Total difference value difference value difference value difference value difference
1 East Azerbayjan 215873 -23985 305444 67250 313733 -34859 75647 -8405 1 2 South Azerbayjan 210833 -23425 77735 -8637 313098 38597 58815 -6535 0 3 Ardebil 111418 -12379 69700 31036 143981 -15997 23943 -2660 0 4 Isfahan 134553 -14950 315635 -35070 806114 300991 103146 -11460 239511
5 Ilam 42552 -4728 6134 -681 81396 28791 8982 -998 22384
6 Tehran & Alborz 75539 -8393 864395 -96042 2207573 144669 362103 -40233 1 7 Chaharmahal and Bakhtari 44437 -4937 38245 14883 68499 -7610 21026 -2336 0 8 Khorasan Razavi 319198 -35466 368795 110364 549093 -61010 124996 -13888 0 9 Khuzestan 230625 47025 101702 3191 325460 -36162 78147 -8683 5371 10 Zanjan 100020 15628 44345 -4927 80764 -8973 15556 -1728 0 11 Semnan 20728 -2303 27587 -3065 77364 6698 11971 -1330 0
12 Sistan and baluchestan 92894 26346 35954 -3994 154065 -17118 47107 -5234 0 13 Fars 269374 2661 230376 61996 449775 -49975 132145 -14682 0 14 Ghazvin 97650 22050 65835 -7315 100485 -11165 32130 -3570 0 15 Ghom 17622 -1957 159605 86079 106871 -11874 22117 -2457 69791 16 Kordestan 135433 19907 27409 -3045 123987 -13776 27782 -3086 0 17 Kerman 291379 36870 53531 -5947 204784 -22753 43571 -4841 3329 18 Kermanshah 99880 -11097 34254 -3805 214686 20104 46821 -5202 0 19 Kohgiluyeh-Buyer Ahmad 35107 7423 7638 -848 49151 -5459 10038 -1115 1 20 Golestan 171563 -19062 128249 40749 149063 -16562 46125 -5125 0 21 Gilan 191439 -21271 141732 55434 246904 -27433 60572 -6730 0 22 Mazandaran 209269 -23252 175767 65244 302834 -33648 75098 -8344 0 23 Markazi 105589 24011 79752 -8861 110799 -12311 25555 -2839 0 24 Hormozgan 149241 78651 8393 -932 62268 8619 15075 -1674 84664 25 Hamedan 117851 -13094 51816 -5757 176720 23244 39542 -4393 0 26 Yazd 57695 13235 9583 -1064 102173 -9654 22656 -2517 0
38
Table 5: Positive and negative deviations in the first WGP model with
= 90%Value Value 1 d 0 d1 0.128 2 d 0 d2 0.124 3 d 0 d3 0.088 4 d 0 d4 78937.273 5 d 0.15 d5 0 6 d 0 d6 0.811 7 d 0.291 d7 0 8 d 0 d8 0 9 d 0.049 d9 0 10 d 0.135 d10 0 11 d 2.475 d11 0 12 d 3359777.852 d12 0 13 d 0.141 d13 0 14 d 0 d14 0.04
39
Table 6: Optimal workforce in each province based on the second WGP model (
=100%)Row Sector
Province Agriculture Industry Service Transportation
Total difference 1 East Azerbayjan 239858 274622 348592 84052 36428 2 South Azerbayjan 234258 86373 300921 65350 26421 3 Ardebil 123798 52626 159979 26603 13964 4 Isfahan 149504 350706 549921 114606 44800 5 Ilam 47281 6883 57205 9980 4669
6 Tehran & Alborz 83932 1005291 2158434 402336 140384
7 Chaharmahal and Bakhtari 49374 23362 82997 23362 6888
8 Khorasan Razavi 374293 293285 610103 138884 54483
9 Khuzestan 189033 98511 385411 86830 29222
10 Zanjan 94019 49272 89737 17284 9627
11 Semnan 23031 30652 76172 13301 5506
12 Sistan and baluchestan 68400 41535 180944 52341 13200
13 Fars 295147 183213 499750 146827 43267 14 Ghazvin 87444 73150 111650 35700 11844 15 Ghom 19579 81136 120591 24574 9456 16 Kordestan 115526 30454 150347 30868 12584 17 Kerman 254509 59478 251134 48412 23597 18 Kermanshah 126802 38059 194582 52023 15825 19 Kohgiluyeh-Buyer Ahmad 27684 12563 54610 11153 4077 20 Golestan 190625 107300 165625 51250 19800 21 Gilan 212710 111923 274337 67302 25625 22 Mazandaran 248791 124771 336482 83442 30518 23 Markazi 81578 88613 135977 28394 12867 24 Hormozgan 76602 9325 53649 16749 6012 25 Hamedan 146382 57573 153476 43935 15437 26 Yazd 44460 10647 119511 25173 7684