Trois essais sur le risque syst´
emique
Sylvain Benoit
To cite this version:
Sylvain Benoit. Trois essais sur le risque syst´emique. Risk Management [q-fin.RM]. Universit´e d’Orl´eans, 2014. English. <NNT : 2014ORLE0508>. <tel-01206685v3>
HAL Id: tel-01206685
https://hal.archives-ouvertes.fr/tel-01206685v3
Submitted on 1 Apr 2016
HAL is a multi-disciplinary open access archive for the deposit and dissemination of sci-entific research documents, whether they are pub-lished or not. The documents may come from teaching and research institutions in France or abroad, or from public or private research centers.
L’archive ouverte pluridisciplinaire HAL, est destin´ee au d´epˆot et `a la diffusion de documents scientifiques de niveau recherche, publi´es ou non, ´emanant des ´etablissements d’enseignement et de recherche fran¸cais ou ´etrangers, des laboratoires publics ou priv´es.
ÉCOLE DOCTORALE SCIENCES DE L’HOMME ET DE LA SOCIÉTÉ
LABORATOIRE D’ÉCONOMIE D’ORLÉANS
THÈSE
présentée par :
Sylvain BENOIT
soutenue le :
11 Décembre 2014
pour obtenir le grade de : Docteur de l’université d’Orléans
Discipline/Spécialité : Sciences Économiques
Three Essays on Systemic Risk
THÈSE dirigée par :
M. Christophe HURLIN Professeur, Université d’Orléans
M. Christophe PÉRIGNON Professeur, HEC Paris
RAPPORTEURS :
M. Christophe BOUCHER Professeur, Université de Lorraine
M. Franck MORAUX Professeur, Université de Rennes 1
JURY :
M. Christophe BOUCHER Professeur, Université de Lorraine
M. Gunther CAPELLE-BLANCARD Professeur, Université Paris 1 Panthéon-Sorbonne
M. Alexis DIRER Professeur, Université d’Orléans
M. Christophe HURLIN Professeur, Université d’Orléans
M. Franck MORAUX Professeur, Université de Rennes 1
L’Université d’Orléans n’entend donner aucune approbation ni improbation aux opinions émises dans la thèse ; elles doivent être considérées comme propres à leurs auteurs.
Acknowledgements
First, I would like to thank my supervisors, Christophe Hurlin and Christophe Pérignon, for their guidance and support for more than four years. I am indebted to them since I have learned so much from their experience in research and their knowledge on a lot of fields. Their availability and complementarity has been fundamental in the completion of this dissertation. The talents in econometrics of Christophe Hurlin have given me discipline in my work and taste for coding, whereas the financial expertise of Christophe Pérignon allowed me to better the understand economic issues which surround us.
I would also like to thank my committee members: Christophe Boucher, Gunther Capelle-Blancard, Alexis Direr and Franck Moraux for carefully reading and providing sound comments, allowing me to improve the first version of this manuscript.
I am really grateful to all the colleagues of the Laboratoire d’Economie d’Orléans (LEO) for the seminars and discussions that allowed me to improve my research. Both my visiting positions at the University of California Santa Cruz (UCSC) and at Cass Business School have offered me the opportunity to exchange with foreign researchers. This is why I would especially like to thank Yin Wong Cheung and Alessandro Beber for sharing with me their feedbacks on my work.
I also need to thank the PhD students in Orléans for contributing to the friendly environment we have worked in, and for the constant stimulation during the long process of the thesis. My thanks also go to the friends that I met at UCSC for their warm and unforgettable welcome.
I would like to add some specific words to emphasize my gratitude to Denisa Ban-ulescu, Nicolas Debarsy, Jérémy Dudek, Armand Fouejieu, Anthony Gauthier, Cristina Jude, Aurélien Leroy, Grégory Levieuge, Yannick Lucotte and Manizha Sharifova for their valuable advice and strong encouragement.
Finally, a special thought goes to my parents, Christiane and Gilles, and my brother, Nicolas, who were present in good and bad times. Last but not least, I have to reward Alice for her patience, help and moral support, thank you for being by my side.
Contents
Acknowledgements i
List of Figures vii
List of Tables ix
Introduction 1
1 Where is the System? 15
1.1 Introduction . . . 15
1.2 Principles for SIBs . . . 18
1.2.1 Literature Review . . . 18
1.2.2 G-SIBs Assessment . . . 19
1.2.3 D-SIBs Assessment . . . 22
1.3 Systemic Risk Measures . . . 24
1.3.1 SRISK . . . 24 1.3.2 ∆CoVaR . . . 26 1.3.3 Correlation . . . 27 1.4 Empirical Results . . . 28 1.4.1 Dataset . . . 28 1.4.2 Cross-section . . . 29 1.4.3 Time series . . . 36 1.5 Conclusion . . . 42 1.6 Appendices . . . 44
1.6.1 Appendix: The Framework . . . 44
1.6.2 Appendix: The MES Formula . . . 46
1.6.3 Appendix: SRISK Formula . . . 47
1.6.4 Appendix: The CoVaR Formula . . . 49
2 A Theoretical and Empirical Comparison of Systemic Risk Measures 53
2.1 Introduction . . . 53
2.2 Methodology . . . 56
2.2.1 Definitions . . . 56
2.2.2 A Common Framework . . . 59
2.3 A Theoretical Comparison of Systemic Risk Measures . . . 59
2.3.1 MES . . . 59
2.3.2 SRISK . . . 61
2.3.3 ∆CoVaR . . . 61
2.3.4 Comparing Systemic-Risk Rankings . . . 62
2.4 An Empirical Comparison of Systemic Risk Measures . . . 64
2.4.1 Rankings: SIFI or not SIFI? . . . 64
2.4.2 Main Forces Driving Systemic Risk Rankings . . . 67
2.5 Conclusion . . . 74
2.6 Appendices . . . 75
2.6.1 Appendix: Proof of Proposition 1 (MES) . . . 75
2.6.2 Appendix: Proof of Proposition 2 (∆CoVaR) . . . 76
2.6.3 Appendix: Proof of Proposition 4 (Rankings MES-∆CoVaR) . . . 78
2.6.4 Appendix: Proof of Proposition 5 (Rankings SRISK-∆CoVaR) . . 80
2.6.5 Appendix: Dataset . . . 81
2.6.6 Appendix: Estimation Methods . . . 82
2.6.7 Appendix: Robustness Check . . . 85
3 Implied Risk Exposures 87 3.1 Introduction . . . 87
3.2 FIRE Methodology . . . 91
3.2.1 Theory . . . 91
3.2.2 The Main Assumption in the FIRE Methodology . . . 94
3.2.3 Case Study on Goldman Sachs . . . 94
3.2.4 Monte Carlo Simulations . . . 99
3.2.5 Commonality in Volatility Within an Asset Class . . . 102
3.3 Changes in Risk Exposures at Large Banks . . . 104
3.3.1 First Input: VaR . . . 104
3.3.2 Second Input: Volatility . . . 106
3.3.3 Implied Risk Exposures . . . 109
3.3.4 Robustness Checks . . . 112
3.4 Extensions . . . 116
3.4.1 Other Types of Risk Disclosures . . . 116
Contents
3.5 Conclusion . . . 118
3.6 Appendix: VaR Data . . . 120
Conclusion 123
Bibliography 129
List of Figures
1.1 Conditional correlation of Alpha Bank return . . . 28
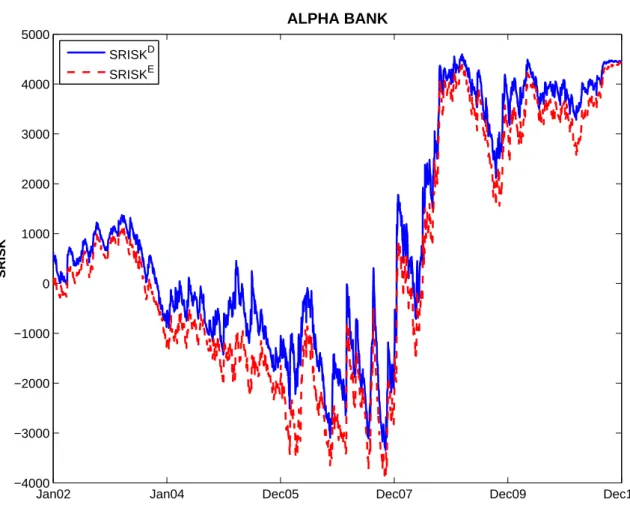
1.2 SRISK of Alpha Bank . . . 37
1.3 LRMES of Alpha Bank . . . 38
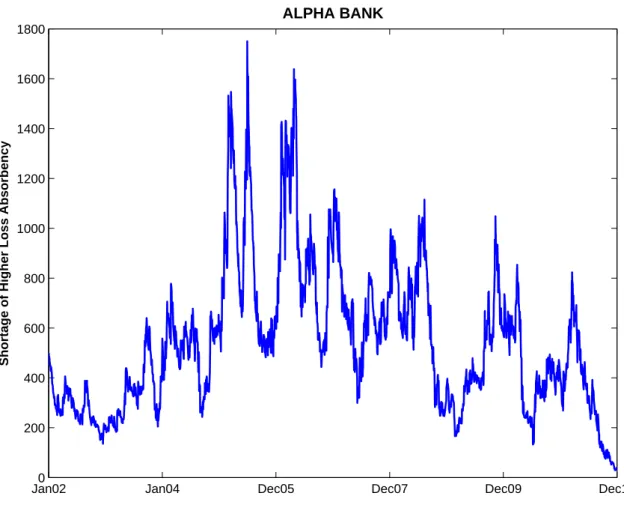
1.4 Shortage of HLA of Alpha Bank . . . 39
1.5 Radar plots of shortage of HLA per country . . . 40
1.6 ∆CoVaR of Alpha Bank . . . 41
2.1 Time Series Evolution of Systemic Risk Measures . . . 55
2.2 Different Risk Measures, Different SIFIs . . . 66
2.3 Driving Forces of Systemic Risk Rankings . . . 69
2.4 Systemic Risk or Systematic Risk? . . . 70
2.5 CoVaR is not Equivalent to VaR in the Cross-Section . . . 71
2.6 CoVaR is Equivalent to VaR in Time Series . . . 72
3.1 FIRE Analysis of Goldman Sachs’ Equity VaR . . . 95
3.2 Empirical Performance of the FIRE Methodology . . . 98
3.3 Evolution of the Factor VaR . . . 104
3.4 Evolution of the Factor Volatility Indices . . . 107
List of Tables
1.1 Systemic Risk Rankings: G-SIBs . . . 21
1.2 SRISK Systemic Risk Rankings per country and over the eurozone . . . . 30
1.3 Shortage of HLA Rankings per country and over the eurozone . . . 33
1.4 Shortage of Higher Loss Absorbency per country . . . 34
1.5 ∆CoVaR Systemic Risk Rankings per country and over the eurozone . . 35
2.1 Systemic Risk Rankings . . . 65
2.2 Systemic Risk Rankings and Firm Characteristics . . . 68
2.3 Explaining Systemic Risk Measures by Market Risk and Firm Characteristics 73 2.4 Systemic Risk Rankings (Top 20 Firms) . . . 85
3.1 Change in Factor VaR and Factor Volatility between 2008 and 2009 . . . 89
3.2 Changes in Equity Risk Exposure for Goldman Sachs . . . 97
3.3 Monte Carlo Experiments . . . 101
3.4 Commonality in Volatility Within an Asset Class . . . 103
3.5 Correlation in Factor VaR across Banks . . . 105
3.6 Correlation between Factor VaR and Factor Volatility . . . 108
3.7 Bank Risk Exposures and Volatility . . . 110
3.8 Commonality in Bank Risk Exposures . . . 111
3.9 Panel Regression Analysis of Changes in Risk Exposures . . . 113
3.10 Robustness Check . . . 114
Introduction
Systemic risk, defined in a broad sense as the risk of a global financial meltdown, has long been a subject of research in finance, both in economics and management. The classical example is the banking crisis and the Great Depression of the 1930s (see de Bandt and Hartmann, 2002, for a survey of major works on systemic risk at the time). But it is undoubtedly the 2007-08 financial crisis that has led to deeply renewing the interest of regulators and researchers in the concept of systemic risk, especially regarding the forthcoming macroprudential regulation.
This dissertation is part of the debate on systemic risk and banking supervision by
displaying three main purposes which are: (i) to evaluate the major systemic risk
meas-ures, (ii) to apply and evaluate them from a regulator point of view, and (iii) to suggest
new techniques to improve these measures or to propose new measures. Indeed, even if the concept of systemic risk is well-known, its measurement remains a challenge (see Bisias et al., 2012, for a definition and a survey of systemic risk measures). By
defini-tion, systemic risk is unobservable and only systemic events can be observed.1 However,
from a regulatory perspective, it is obvious that the risk of a system-wide collapse should be measured and expressed in a probabilistic environment. More specifically, setting a macroprudential regulation requires the evaluation of the contribution of each financial institution to systemic risk as an externality. How can the contribution of a financial institution to the system-wide risk be evaluated? How can such a measure such a meas-ure be validated? These issues and the dramatic consequences on the global economy of the bankruptcy of Lehman Brothers in 2008 have led to a profound questioning about the prudential regulations (so far mainly focused on the microprudential aspect in which the stability of each financial institution ensures the system-wide stability) as well as the academic notion of systemic risk (Hansen, 2014).
From an academic point of view, systemic risk is often related to the concept of contagion. To experience a systemic event, a trigger point is needed. According to the European Central Bank (ECB, 2009), this trigger point can come from two sources: an exogenous shock, i.e. an idiosyncratic event such as the failure of a market or a financial institution, or an endogenous shock within the financial system, i.e. a global 1To be more precise, we should mention the concept of systemic uncertainty (in the sense of Knight), since it is assumed
macroeconomic imbalance.2 These adverse effects are spread through the entire financial
system due to spillover effects which are local, and/or contagion effects which are global. Finally, a substantial part of the real economy is affected, leading to a lower economic
welfare. Thus, the systemic threat refers to the idea of negative externalities. The
risk-taking behavior of a financial institution may impact not only its shareholders and managers, but also other financial institutions (Lepetit, 2010). This interconnectedness arises from financial transactions in the interbank market (Rochet and Tirole, 1996), or asset commonality among banks (Allen, Babus and Carletti, 2012).
The general idea of a macroprudential regulation is based on the fact that a financial
institution has to internalize its negative externalities.3 This paradigm shift on the
regu-latory framework has been commissioned by a strong international political willpower, as illustrated by the six meetings of the G-20 heads of governments about financial markets and the world economy that took place from 2008 to 2011. This guideline has pro-duced significant updates to financial regulation that were materialized in 2010 by the Dodd-Frank Wall Street Reform and Consumer Protection Act in the United States, and by the third Basel Accord signed by the members of the Basel Committee on Banking
Supervision (BCBS).4
Hence, if the consumers’ protection against the risk of failure of their bank was at the heart of the microprudential banking regulations, the financial crisis of 2008 has prompted to take into account the protection of the whole financial market against a systemic crisis (Rochet, 2008). To limit the risk of failure of a given institution, the banks under the Basel II regulation have to satisfy to capital adequacy requirement set for market, counterparty and operational risks. Most of the time, these capital amounts are computed thanks to banks’ internal risk models. The transition to a macroprudential regulation (Basel III for example) involves the identification of the major financial institutions that contribute most to the overall risk of the financial system – the so-called Systemically Important Financial Institutions (SIFIs). As SIFIs pose a major threat to the system, they have to be subject to tighter supervision, extra capital requirements, and liquidity buffers (Financial Stability Board, 2011a). These additional capital requirements should be proportionate to the contribution of each financial institution to the system-wide risk.
Three crucial questions arise in this context: (i) how to identify Systemically
Import-ant Financial Institutions (SIFIs), (ii) how to measure the systemic risk contribution in
order to set the capital surcharge, and (iii) how to reveal banks’ commonalities in trading
in order to prevent systemic events.
2See de Bandt, Hartmann and Peydró (2012) for a clear distinction between a systemic event in the “narrow” and
“broad” senses, as well as its classification into “strong” or “weak”. Their updated survey on systemic risk focuses on contagion effects which are the consequence of a strong systemic event in the narrow sense.
3Whatever the source of its externalities, market risk, credit risk, liquidity risk or operational risk. 4The United States are members of the BCBS.
Identifying Systemically Important Financial Institutions
In some aspects, banking and biology have many similarities since they are both complex systems. This is probably why the contagion analogy between the spread of financial shocks and the transmission of infectious diseases has been so often used in the academic literature (Haldane and May, 2011). Banks are connected to each other (through their cross-asset and liability positions and their exposures to common risk factors) which means that they suffer from but also contribute to the spread of financial shocks. In case of pandemic the patient zero is looked for in order to figure out the cause of the infection; in case of a systemic event, it is the financial institutions whose characteristics (size, interconnectedness, specific role in the markets, etc.) and activity generate the greatest threat to the stability of the financial system as a whole, i.e. SIFIs or Global Systemically Important Financial Institutions (G-SIFIs), which are looked for. How to identify systemically important financial institutions? To assess the systemic importance of G-SIFIs, an indicator-based measurement approach has been developed by the regulators. The framework proposed by the BCBS (Financial Stability Board -International Monetary Fund - Bank for -International Settlements, 2009; FSB, 2011b; Financial Stability Oversight Council, 2012a) provides a score based on five systemic risk factors: size, interconnectedness, global (cross-jurisdictional) activity, substitutabil-ity/financial institution infrastructure, and complexity. The first three follow the recom-mendation of the FSB-IMF-BIS report of 2009, whereas the last two have been added by the BCBS itself, since complex and international SIFIs are more costly and longer to dis-entangle (BCBS, 2011a). In this approach based on scores, the fundamental question that arises, beyond the choice of the indicators that should be included in the score, is their relative weight. The BCBS has chosen an equally weighted score in which each factor has a total weight of 20% in the score construction. On the same principle, an equal weight is also assigned to all indicators used in the composition of a factor. These indicators are well-defined and correspond to precise accounting or market values (a detailed list of these individual indicators is provided by the BCBS, 2013b).
The individual score of a given financial institution is then used twice. First, the score is compared to a cutoff level, set by the BCBS given their supervisory judgment. Each financial institution with a score above this threshold is considered as a G-SIFI and is submitted to tighter supervision. Second, scores are used to set the regulatory capital surcharge. Thus, the next step is to introduce the G-SIFIs’ scores in a bucketing approach which allocates G-SIFIs into four buckets with their own systemic importance. Inside a bucket, the systemic importance of these G-SIFIs is homogeneous. Finally, the magnitude of the higher loss absorbency (HLA) requirement applied to cover the individual contribution to systemic risk varies according to the bucket where the G-SIFI is put. This higher level of capital, expressed as a percentage of the risk-weighted assets,
goes from 1% to 2.5%, corresponding to an increase of 0.5% per bucket. Since 2012, the list of G-SIFIs is disclosed once a year.
This regulatory framework becomes a kind of benchmark for the identification of SIFIs (Weistroffer, 2011) even if this indicator-based approach aggregates multiple indicators, including private data. However, this methodology raises a large number of issues. First, Hurlin and Pérignon (2013) show that an equally weighted score can lead to overstate the importance of the most volatile indicators. Second, beyond the methodology, publish a list of SIFIs may have unintended consequences. Like the investors’ perception of the too-big-to-fail theory, a too-systemic-to-fail view could also lead to positive valuation effects. Indeed, the market capitalization of such a financial institution may growth whatever its risk management efforts to reduce its contribution to systemic risk. In other words, banks may have an incentive to appear as a SIFIs even if it induces a surcharge of capital and a tighter monitoring from regulators. Moenninghoff, Ongena and Wieandt (2014) have contributed to this debate in a recent empirical study where they observe that the new regulation negatively affects the value of the newly regulated financial institutions, yet they highlight that the official designation of G-SIFIs has partly offset the desired impact. Third, only banks are taken into account within this framework. Nevertheless, the financial system is composed of heterogeneous agents, such as insurance companies (van Lelyveld, Liedorp and Kampman, 2009) and global hedge funds (Chan et al., 2006, attempt to quantify their potential impact on systemic risk), and both may be systemically important under certain circumstances. The collapse of Long Term Capital Management in 1998 shed light on the involvement of hedge funds in systemic risk.
Another issue with this approach lies in defining the scope of the financial system of reference (see Zigrand, 2014, for a definition of what “system” means in the notion of systemic risk). Have a European regulator to assess the risk of externalities generated by the activities of European banks on the Asian and American banks, or should be restricted to the analysis of impacts in the European financial system? More generally, this question about the appropriate level-playing field is part of the identification of G-SIFIs and Domestically Systemically Important Financial Institutions (D-G-SIFIs). This identification of D-SIFIs is paramount when a regulator wants to analyze the impact of a potential failure on a national or regional financial system. Thus, the topology of the system is important and we have to investigate and delimitate the area in which a financial institution has a potential impact in case of distress. For example, in August 2014, the Portuguese bank Banco Espirito Santos has been recapitalized with a state aid of 4.4 billion euros due to large exposures. This bank has never been identified as a G-SIFI in spite of its poor results in the 2011 stress tests. This institution may be only a D-SIFI since no European crisis has followed this bail-in. To address this domestic systemic risk, BCBS (2012) proposes a set of twelve principles to identify D-SIFIs and assess their
accurate magnitude of HLA. Unfortunately, this framework is not operational yet and a disaster, such as the one of August 2014 could happen again with potentially damaging consequences in Europe. Indeed, the identification of such a D-SIFI is a high priority for regulators but also for academic researchers (Brämer and Gischer, 2011; Engle, Jondeau and Rockinger, 2014). My PhD thesis contributes to this literature by proposing a way to establish the financial institutions which may be systemically risky at a nation level.
The methodology proposed by regulators is not the only way to point out systemically risky financial institutions. Researchers have proposed several measures to assess the systemic importance of a financial institution. Their main difficulty is that they usually do not have access to a set of data able to measure the interconnectedness in banks’ balance sheets (Cerutti, Claessens and McGuire, 2014). Therefore, systemic risk measures developped by researchers are mainly based on market data and on publicly available balance-sheet data.
Systemic Risk Measurement
As shown by the regulatory approach, systemic risk cannot be defined according to a single criterion. Zhou (2009) emphasizes this point when he studies the relation between the size of a financial institution and its systemic importance. His conclusion is that size is not a proxy of systemic risk. Additional characteristics have to be considered, relying on all the components making a financial institution systemically risky. Bisias et al. (2012) survey thirty-one measures of systemic risk in the economic and financial literature from the granular foundations and network measures to the forward-looking risk measurement, among others. De Bandt et al. (2013) also survey a large number
of quantitative indicators, particularly institution-level measures. This former set of
measures is well designed to identify SIFIs.
In order to gauge the contribution of a given institution to the overall systemic risk, two ways can be distinguished. On the one hand, measures based on market data, such as stock returns or Credit Default Swaps (CDS) data, and on the other hand measures based on balance-sheet and regulatory data (when they are available), such as bilateral exposures.
The first subset of measures focuses on market data. Adrian and Brunnermeier (2011) extend the traditional VaR through the CoVaR, the prefix Co meaning conditional, con-tagion, or comovement. The CoVaR captures the loss of the whole financial system conditional on the distress of a financial institution. To obtain the ∆CoVaR, which rep-resents the contribution of an institution to the system-wide risk, the authors compute the difference between the CoVaR obtained during a situation of distress for the institution and the CoVaR obtained during the median situation for the institution. Acharya et al. (2010) define the Marginal Expected Shortfall (MES) as well as the Systemic Expected Shortfall (SES). The marginal contribution of a financial institution captured by the MES
is equal to the historical average of its daily equity returns when daily market returns are
at their 5% or 1% lowest quantile.5 The SES of an institution corresponds to its amount
of equity which drops below its target level, in case of a systemic crisis. In other words, SES is the propensity of a financial institution to be undercapitalized when the system as a whole is undercapitalized. Brownlees and Engle (2012), Acharya, Engle and Richardson (2012) as well as Engle, Jondeau and Rockinger (2014) combine the MES with the market capitalization and the total amount of liabilities in order to build the SRISK. SRISK takes leverage and size into account and corresponds to the expected capital shortfall of a given
financial institution, conditional on a substantial market decline.6 The authors interpret
the SRISK as a capital shortfall making a clear relationship with the regulatory purpose to increase financial stability through higher capital requirement. Still, using asset re-turns, Billio et al. (2012) focus on time series and propose a Granger-causality measure of interconnectedness (interpreted as a spillover effect) to assess systemic risk. In the same vein, Diebold and Yilmaz (2014) present several connectedness measures obtained using variance decomposition based on stock returns volatility data. The two previous studies identify the network topology. Corradin, Manganelli and Schwaab (2011) intro-duce a framework of multivariate regression quantiles to assess the contribution of a given financial institution. Straetmans and Chaudhry (2012) apply a statistical multivariate extreme value analysis to realize a cross Atlantic comparison of the financial system-wide risk. As explained by Markose et al. (2010), CDS had a pernicious role in the financial crisis and systemic risk measurement based on CDS data have been proposed, such as their Systemic Risk Ratio. Otherwise, Huang, Zhou and Zhu (2009) provide an estim-ated risk-neutral probability of default with the Distress Insurance Premium (DIP) index, whereas Giglio (2012) compute the joint default risk of financial institutions. Beyond this large but non-exhaustive collection of market-based systemic risk measures, another way to gauge the systemic contribution of a given financial institution exists.
The second subset of measures focuses on balance-sheet and regulatory data. Green-wood, Landier and Thesmar (2012), on the basis of data published by the EBA on the banks’ exposures to the European sovereign debt, distinguish between the contribution of a given bank to financial sector fragility and its own vulnerability to systemic risk. Brunnermeier, Gorton and Krishnamurthy (2014) focus on liquidity to understand the crisis and argue that their Liquidity Mismatch Index (LMI) at the institutional level can provide valuable information to assess the systemic importance of a financial institution. As highlighted by Caballero (2010), systemic risk is intrinsically related to the degree of interconnectedness between financial institutions. Many studies follow this idea and 5Brownlees and Engle (2012) extend this measure to a time horizon of six months through the LRMES thanks to a
conversion formula or multiple simulations.
6Engle and Siriwardane (2014) extend the SRISK by incorporating the structural GARCH model which proposes a
model the financial system as a network to quantify the contagion generated by linkages between financial institutions. Cont, Moussa and Santos (2012) present the Contagion Index, a metric for the systemic importance of financial institutions defined as the ex-pected loss to the network triggered by the default of an institution in stress scenario. In their work, the systemic importance is based on counterparty exposures. Gouriéroux, Héam and Monfort (2012) also use a unique dataset of interbank bilateral exposures. Their methodology can separate the direct effects of a shock (such as a common asset shock or a specific shock to one bank) from the effects of contagion within the banking system. Identifying the most sensitive links is also the goal of Demange (2011), that is why he uses the Threat Index which reflects an externality imposed by a defaulting bank on the debt repayments of all other banks. This indicator is an alternative measure to the contagion risk of a bank, most of the time defined as the expected number of subsequent failures following its initial bankruptcy (see Upper 2011 for a survey). This identification methodology underlines that the contagion risk is not a one-dimensional issue. The network topography also matters, as emphasized by Acemoglu, Ozdaglar and Tahbaz-Salehi (2014) who shed light on the “robust yet fragile” (Haldane, 2009) nature of financial networks, meaning that a type of network can be very resilient to one type of shock but fragile under another.
This dissertation relies on a small subset of these individual systemic risk meas-ures. The chosen sample is composed of the following measures: MES, SES, SRISK and ∆CoVaR. This choice has been guided by their nice economic interpretations, the public availability of data, and the real-time investigation allowed by these market-based systemic risk measures. My purpose is then to contribute to the literature which attempts to verify whether or not these new individual systemic risk measures are well-designed to gauge the contribution of a given financial institution to the system-wide risk. Brunner-meier and Oehmke (2012) have also addressed this issue and they propose a definition of what a relevant systemic risk measure should be and argue that the allocation principle is primordial. In order to give a potential answer to this question, Brunnermeier and Cheridito (2013) suggest the SystRisk measure. An alternative approach is to develop an axiomatic framework for the measurement and management of systemic risk (Chen, Iyengar and Moallemi, 2013), as Artzner et al. (1999) have done for the individual risk measures. The approach presented in my dissertation is complementary to the two il-lustrated above since the abilities of these measures to identify SIFIs and to resume all characteristics of systemic risk in a single measure are compared.
Measuring systemic risk and identifying SIFIs requires an in-depth analysis of financial institutions. A significant part of the systemic risk can only be identified through a detailed analysis of common activities and strategies among financial institutions.
Commonality among Banks
Financial institutions contributing the most to systemic risk are subject to a tighter supervision. This means that market activities such as trading positions with their asso-ciated liquidity need and ongoing exposures are under scrutiny. Sound risk management is not a new pillar in the current regulation because internal models are already validated by regulators through the microprudential approach. However, supervisors are now aware of macroprudential issues, including the potential for systemic risk to arise from concen-tration risk and common exposures, even when institutions seem safe when considered individually (FSB, 2011a).
Correlated risk across banks is not rare and has several sources. First, banks have in-centives to over-invest in specific asset classes and this result may be exacerbated by the current regulation. For instance, policy makers have asked that Credit Defaults Swaps (CDS) be now clear through central counterparties (CCPs), that could dramatically in-crease the system-wide collateral demand leading to potential destabilizing effects since only few types of assets are eligible as collateral within CCP frameworks, such as sover-eign debt (Duffie, Scheicher and Vuillemey, 2014). Second, Hirshleifer, Subrahmanyam and Titman (1994) show that the sequential nature of information arrival has a significant impact on trading decisions. Investors who receive common and private information be-fore others do, become short-term “profit-takers” and have a tendency to trade the same group of stocks. Third, Acharya and Yorulmazer (2007, 2008) argue that banks have a strong incentive to herd, especially small banks, in order to maximize their probability of bailout. This type of behavior from banks increases the likelihood of a systemic risk crisis
and poses for regulators a too-many-to-fail problem.7 Farhi and Tirole (2012) argue that
private leverage choices depend on the anticipated policy reaction to the overall maturity mismatch. Thus, banks as a whole are doing too much maturity mismatch (too much short-term debt) leading to higher correlated risk.
To sum up, financial institutions have incentives to correlate their positions on the overvalued assets. However, these positions are not publicly disclose and only regulat-ors are able to monitor the degree of commonality among banks from these common exposures.
Obviously, correlated risks are particularly problematic during financial crises. In-deed, as market volatility spikes, regulatory capital and collateral requirements tend to mechanically increase for financial institutions. In response, many banks are forced to liquidate their positions. Adrian and Shin (2014) empirically illustrate this aspect, show-ing that to maintain a constant probability of default, financial institutions adjust their 7Brown and Dinç (2009) provide an empirical analysis of the too-many-to-fail effect thanks to a study of bank failures
in twenty-one emerging market countries in the 1990s. They show that this impact is robust to several factors, such as the too-big-to-fail effect.
risk exposures very sharply when the economic environment becomes more risky. Brun-nermeier and Pedersen (2009) propose a model to explain the fact that market liquidity has commonality across assets, which further amplifies market volatility. Morris and Shin (1999) explain that correlated risk exposures (interdependence) across banks leads to higher volatility since financial institutions tend to sell the same assets at the same time. This blind spot leads to adverse feedback effects which may have dramatic con-sequences in a crisis period (Persaud, 2000). Herding behavior is hard to prove given the lack of reliable data. Allen, Babus and Carletti (2012) develop a theoretical model to analyze the interaction between asset commonality and funding maturity in generat-ing systemic risk. Cai, Saunders and Steffen (2014) measure the similarity between the syndicated loan portfolios of two banks and they find positive correlation between this measure of banks’ interconnectedness and various market-based systemic risk measures including SRISK and CoVaR.
Commonality across financial institutions matters, but there are no accurate tools to identify risk exposures at their firm-wide level, across business lines and to other financial institutions. This challenge remains without standard measures while the need for such a measure is fundamental. Indeed, financial instability could be reduced by imposing exposures limits to financial institutions on certain asset classes. In this dissertation, I an innovative tool measure of risk exposures is proposed. This implied measure of changes in risk exposures is obtained for a broad spectrum of risks and established at a bank level. This new methodology could be an accurate way to track commonality in risk exposures across banks and then prevent a potential build-up of systemic risk.
Assessing the systemic risk is still at its beginnings and the main goal of this disser-tation is to contribute to this abundant and stimulating literature by proposing three essays on systemic risk.
Contributions
The first chapter fills in the gap existing in the identification of Domestic Systemic Important Banks (D-SIBs). This empirical chapter 1 offers an original adjustment of three systemic risk measures designed in a global framework to evaluate their abilities to identify D-SIBs as well as G-SIBs. Following the spirit of the Basel III agreement, this chapter also highlights the shortage of capital that a given bank may have when this financial institution is jointly identified as G- and D-SIB.
The second chapter provides a theoretical and empirical analysis of the major sys-temic risk measures (MES, CoVaR and SRISK) based on market data (daily returns). To do this, chapter 2 introduces a common framework and derive a number of theoretical properties on these measures. In particular, conditions under which the different meas-ures lead to similar rankings of SIFIs. This theoretical analysis is complemented by an empirical analysis on a sample of ninety-four American banks.
The third chapter proposes an implied measure of banks’ risk exposures to several risk factors. This new approach, described in chapter 3, extracts private information about the changes in banks’ risk exposures at an aggregate level from public risk disclosures, i.e. VaR disaggregated by major risk factors. Using this measure, commonality among ten international banks is investigated.
Chapter 1: Where is the System?
Chapter 1, entitled “Where is the System?”, provides a methodology to identify both
D-SIBs and G-SIBs.8 According to the fact that the usual market-based systemic risk
measures, such as SRISK and ∆CoVaR, are well designed to identify G-SIBs, this chapter offers a simple adjustment of these measures to investigate the systemic risk contribution of a given bank at the domestic level and extract specific additional policy for D-SIBs as required by the Basel Committee on Banking Supervision (BCBS, 2012).
In this context, even when the system of reference changes, these measures cannot be used to distinguish between D-SIB and/or G-SIB. This result shows on the one hand that SRISK is mainly sensitive to the total amount of liabilities of the bank, which does not depend on the size of the system. On the other hand, ∆CoVaR is highly sensitive to the choice of the system which leads to a clear distinction between the domestic and the global level-playing field.
This issue is illustrated within the eurozone where the identification of D-SIBs is very important. In order to do so, this chapter shows that the difference between two SRISKs computed at the national and at the European level is a promising tool to identify D-SIBs and evaluate the potential shortage of capital that a bank may have when this bank is simultaneously considered as D-SIB and G-SIB.
Chapter 2: A Theoretical and Empirical Comparison of Systemic Risk Measures
Chapter 2, entitled “A Theoretical and Empirical Comparison of Systemic Risk Meas-ures”, provides a comprehensive comparison of the major market-based systemic risk measures (MES, SES, SRISK and ∆CoVaR) that are currently used by central banks and banking regulatory agencies due to their nice economic interpretations. Although the Financial Stability Board (FSB) states that the score, measuring the contribution of a financial institution to the system-wide risk have to reflect size, leverage, liquidity, in-terconnectedness, complexity, and substitutability. The findings of this chapter indicate that these measures fall short in capturing the multifaceted nature of systemic risk. So far, the research in this chapter constitutes the first attempt at comparing, both theor-etically and empirically, these major systemic risk measures. The result obtained is that
most of the variability of these systemic measures can be captured by one market risk measure or a firm characteristic.
In a common framework, the analytical expressions of these measures allow to uncover the theoretical link between systemic risk and standard financial risks (systematic risk, tail risk, correlation and beta), as well as firm characteristics such as leverage and market capitalization. More precisely, it is shown that MES is highly related to the beta of a firm, ∆CoVaR is highly related to the Value-at-Risk (firm tail risk) whereas SRISK is related to the beta and the leverage. Conditions under which the different measures lead to similar rankings of SIFIs are also derived.
The theoretical analysis is completed by an empirical application focusing on a sample of ninety-four American banks over the period 2000-2010. Estimation methods from seminal papers are applied. It is shown that different systemic risk measures lead to identify different SIFIs. Moreover, the linear regression analysis shows that a one-factor model explains between 83% and 100% of the variability of the systemic risk estimates. In cross-section, MES and SRISK are explained by the traditional beta of a firm and its total amount of liabilities, respectively. In time series, ∆CoVaR is mainly explained by the VaR.
Chapter 3: Implied Risk Exposures
Chapter 3, entitled “Implied Risk Exposures”, introduces an innovative answer to the
data gap facing regulators and researchers.9 Indeed, to better assess the evolution of
the financial system, more data have to be disclosed by financial institutions (Cerutti, Claessens and McGuire, 2014). Even if the stress tests leading by the European Banking Authority (EBA) is a substantial opportunity to observe actual positions or risk exposures of banks, those tests are not done every year. To overcome this issue, this chapter develops the Factor Implied Risk Exposures (FIRE) methodology to infer banks’ risk exposures from current public risk disclosures.
The originality of this technique is to show how to reverse-engineer traditional banks’ risk disclosures, such as the Value-at-Risk (VaR), to obtain an implied measure of their exposures to equity, interest rate, foreign exchange, and commodity risks. As this chapter considers a broader spectrum of risks, it extends recent literature which focuses only on banks’ exposures to interest rate risk, as investigated by Begenau, Piazzesi and Schneider (2013) as well as Landier, Sraer and Thesmar (2013). It is also shown that the factor structure for the volatility of equity, documented by Herskovic et al. (2014), is persistent across the four asset classes, which highlight a certain degree of commonality in volatility across the assets within a given asset class. The performance of the method used in this chapter is assessed by systematically comparing the implied risk exposures given by the FIRE methodology, with statements made by a large financial institution about its
actual risk exposures in public filings. The biases on the implied exposures that could be induced by model risk and estimation risk are also studied by simulation.
The empirical application on ten large US and international banks shows that changes in risk exposures are negatively correlated with market volatility and changes in risk ex-posures are positively correlated across banks, which is consistent with banks exhibiting commonality in trading. The first finding suggests that banks actively manage their risk exposures according to market conditions, and this can be seen as an attempt to damper the procyclicality of their regulatory capital. The second finding indicates that banks rebalance their trading portfolios in a correlated way. However, a pool of large banks which have a growing common exposure to an asset class is a source of interconnected-ness between financial institutions that increase the systemic risk, and this concern is particularly relevant for banking regulators.
Chapter 1
Where is the System?
10
The aim of this paper is to determine the optimal size of the system (global, suprana-tional or nasuprana-tional) when measuring the systemic importance of a bank. Since 2011, the Basel Committee on Banking Supervision (BCBS) has tagged global systemically im-portant banks (G-SIBs) and has imposed a higher regulatory capital of loss absorbency (HLA) requirement. However, the identification of G-SIBs may overlook banks with major domestic systemic importance, i.e. the domestic systemically important banks (D-SIBs). This paper describes how to adjust market-based systemic risk measures to
identify D-SIBs. In an empirical analysis within the eurozone, we show that (i) the
SRISK methodology produces similar rankings whatever the system used. However, (ii)
the SRISK values greatly vary across systems, which calls for imposing the higher of
either D-SIB or G-SIB HLA requirements. Finally, (iii) the ∆CoVaR methodology is
extremely sensitive to the choice of the system.
1.1
Introduction
Since September 15, 2008 and the collapse of Lehman Brothers, extensive research has been done on systemic risk, considering its definition, measurement, or regulation. While there is no unanimous definition for systemic risk yet, most definitions agree on three points that are summarized in the 2001 G-10’s definition:
“Systemic financial risk is the risk that an event will trigger a loss of economic value or confidence in [sic] a substantial portion of the financial system that [sic] have significant adverse effects on the real economy.”
Thus, a systemic event corresponds to atrigger point which causes significant disruption
in the financial system and finally spreads out to the real economy. For instance, the initial shock can be the bankruptcy of a financial institution, which sets off wide turmoils propagating through the financial system and finally jeopardizing the local and/or global economy. The key element that concerns systemic risk is the identification of Systemically
Important Financial Institutions (SIFIs), which correspond to firms that threaten the system. The nature of the system is well addressed in the context of the United States because of its particularity as a federal state. However, in Europe, where we are faced with a sum of countries, the issue is much less obvious. Hence, considering global or domestic systemically important banks (G- or D-SIBs) does not lead to the same conclusions and raises numerous questions. Should we evaluate the contribution of a given financial institution to the risk of the system at a domestic, supranational, or global level? Is the list of SIBs identical if we change the system used in the analysis? Most importantly, which definition of the system should be used in the identification process of SIBs?
The objective of this paper is to determine the optimal size of the system when meas-uring the systemic importance of a bank. To answer the above questions which are crucial for banking regulators, we adjust market-based systemic risk measures, usually used to identify G-SIBs, to identify D-SIBs. This approach is closely tied to the current regulat-ory debate on systemic risk. Indeed, following a request made by the G20, the Financial Stability Board required an extension of the G-SIBs to include D-SIBs in October 2012. The Basel Committee on Banking Supervision (BCBS) published a framework for deal-ing with D-SIBs (BCBS, 2012) in line with its former methodology for assessdeal-ing G-SIBs (BCBS, 2011-2013b). This country-by-country approach requires regulators to take into account a set of new bank-specific factors such as size, interconnectedness, financial insti-tution infrastructure and complexity of a particular bank within its own financial system. BCBS emphasizes that national regulators should establish their own list of D-SIBs. By analogy, identifying the supranational-SIBs should be done by a supranational regulator while identifying the G-SIBs should be done by a global regulator which assesses the system in the global context like the BCBS currently does.
This top-down approach implies that additional capital and tighter monitoring of G-SIBs are of the utmost importance if we want to avoid a wave of major bankruptcies that would affect the entire global system. A G-SIB is usually so large, interconnected and non-substitutable that we cannot miss it in the identification process. However, the fact that a particular bank cannot be seen at the global level does not imply that its contribution to systemic risk is null. Thus a bank could be a D-SIB without being identified as a G-SIB and its impact on other domestic banks could be significant and eventually destabilize the local economy. This is why, a bottom-up approach should be adopted. Taking D-SIBs into account in elaborating the regulation is even more important if we think that, for a given bank, its systemic contribution is probably larger in its country than abroad. For this reason, BCBS requires national authorities to calibrate the level of Higher Loss Absorbency (HLA) needed for D-SIBs. Consequently, the identification of SIBs changes depending on the system we focus on.
1.1 Introduction
To deal with domestic systemic risk, two fundamental questions have to be addressed. First, what is the nature and the magnitude of the initial shock to identify D-SIBs? Should we consider a global systemic event or a domestic shock? Second, what should be the system? What should be the optimal perimeter of the system as well as its specific risk factors and the number of banks to be taken into account? Should we investigate the same banks at the global and domestic levels? Should we use a multi-industry system or only the banking system? This paper aims to answer these questions. Another important aspect of the systemic risk debate concerns the optimal taxation of SIBs. Indeed, as in the polluter pays principle, negative externalities created by SIBs have to be internalized by themselves and not by the taxpayer. In maximizing their private benefits, individual banks may rationally choose outcomes that are suboptimal on the system-wide level because they do not take into account these externalities (BCBS, 2013b). Thus, two aspects are studied by the BCBC to reduce these externalities, on the one hand reducing the probability of failure of a SIB with the HLA requirement and on the other hand reducing the impact of the failure of a SIB by improving resolution plans (FSB, 2011a).
This paper contributes to the literature on the identification of D-SIBs in Europe. Despite the fact that the BCBS would like D-SIBs to be identified, only a few papers tackle this issue. Elsinger, Lehar and Summer (2006) use a few individual bank charac-teristics which are easily observable to measure risk at the level of the banking system. Acharya and Steffen (2012) rank European banks using the Systemic Expected Shortfall (SES) measure based on the Marginal Expected Shortfall (MES), leverage, and total as-sets. Engle, Jondeau and Rockinger (2014) propose an adjustment of the Systemic Risk Measure (SRISK) to identify the D-SIBs but their main focus is still on G-SIB identific-ation. This paper uses public data and not private information as the BCBS does. The goal of this paper is to close the gap between the market-based systemic risk measure applied to identify the G-SIBs and the D-SIB identification.
The present paper puts forward a User-Guide to adjust the two major market-based systemic risk measures (SRMs) to the choice of the system, and highlight the consequences the choice of a system can have. This analysis relies on publicly available real-time data, using the Systemic Risk Measure (SRISK) of Brownlees and Engle (2012), Acharya, Engle and Richardson (2012) and Engle, Jondeau and Rockinger (2014), and the Delta Conditional Value-at-Risk (∆CoVaR) of Adrian and Brunnermeier (2011). Indeed, these popular measures of systemic risk contribution are easily adjustable to different systems, and the values in the former measure are expressed as an amount of money, allowing users to quantify the amount of the higher loss absorbency required for a given SIB. To avoid time lag and obtain results in the same currency, this paper considers the eurozone countries over the last decade, and this constitutes the global level. The domestic level
corresponds to each of the 10 member countries of this economic and monetary union.11
The main findings of this paper are the following. First, it shows that (i) the SRISK
measure produces similar rankings regardless of the system used. Second, (ii) the SRISK
values vary significantly across system definitions, which underlines the importance of
im-posing the higher of either D-SIB or G-SIB HLA requirements. Third, (iii) the ∆CoVaR
which mainly captures the degree of interconnectedness between a particular system and a bank that belongs to this system, is highly sensitive to the choice of the system.
The rest of the paper is organized as follows. Section 1.2 provides a brief literature review of systemic risk and introduces the general framework to identify G-SIBs and D-SIBs with their specific factors. Section 1.3 describes the SRISK and the ∆CoVaR methodologies. Section 1.4 presents the data and the main empirical findings. Section 1.5 offers a summary and a conclusion.
1.2
Principles for SIBs
This section sums up the two main approaches used to identify SIBs and shows that both are useful. Then its describes the assessment methodologies made by the BCBS to look for G- and D-SIBs.
1.2.1 Literature Review
In this paper, we do not want to oppose the two traditional approaches tackling sys-temic risk. In other words, we do not plan to dwell on the question of whether or not an approach may be more efficient. The first approach is only based on balance sheet and stock returns data (Acharya et al., 2010; Billio et al., 2011; Adrian and Brunner-meier, 2011; Acharya, Engle and Richardson, 2012; Brownlees and Engle, 2012), whereas the second approach requires balance sheet information disaggregated by class of assets and counterparties (Gouriéroux, Héam and Monfort, 2012, 2013; Greenwood, Landier and Thesmar, 2012). Furthermore, the Shapley Value can be applied to the two former approaches (Borio, Tarashev and Tsatsaronis, 2010; Drehmann and Tarashev, 2011a; Garratt, Webber and Willison, 2012; Gauthier, Lehar and Souissi, 2012; Cao, 2010). However, as this paper shows, there is an additional issue. Danielsson et al. (2011) ar-gue that these systemic risk measures contain a high degree of model risk due to their dependence to the VaR (or ES) which is a noisy riskometer. Our extra model risk is linked to the mathematical definition of the market index because this latter could be capitalization-weighted or equally weighted for example. We are going beyond this simple index construction issue because we use this matter to focus on the optimal size of the system and so transform it as a force of these market-based SRMs to enhance their ability to identify D-SIBs.
11Established in January 1, 1999, the eurozone is an economic and monetary union of 17 European Union member states
1.2 Principles for SIBs
The common feature of these different methods is that they are already included within a particular system which is interesting since the size of the network is particularly important to capture the degree of interconnectedness of a given financial institution with its neighbor. For example, Lopez-Espinosa et al. (2012a) derive the CoVaR at a global level whereas Cerutti, Claessens and McGuire (2014) emphasize the need for additional data to capture international dimensions of systemic risk. In contrast, Elsinger, Lehar and Summer (2006) and Acharya and Steffen (2012) apply Marginal Expected Shortfall, Conditional Expected Shortfall and Systemic Expected Shortfall at the European level. The only paper that focuses on domestic level, from Brämer and Gischer (2011), adjusts the indicator-based approach proposed by the BCBS and identifies D-SIBs in the context of the Australian banking system. Engle, Jondeau and Rockinger (2014) design a specific econometric multi-factor model to address asynchronous markets. To identify G-SIBs and D-SIBs among European financial banks with this new model, they explain the bank’s return by three drivers, a country-wide index, an European index and a world index. One of the contributions of this paper is to show that this multivariate model does not outperform the traditional bivariate model when the identification of D-SIBs is the purpose.
1.2.2 G-SIBs Assessment
To assess the global systemic risk based on data related to the consolidated group, BCBS has developed a framework (Financial Stability Board - International Monetary Fund - Bank for International Settlements, 2009; BCBS, 2013a; FSB, 2011b; Finan-cial Stability Oversight Council, 2012a) which incorporates a score based on systemic risk factors such as cross-jurisdictional activity, size, interconnectedness, substitutabil-ity/financial institution infrastructure and complexity (for a complete description, see BCBS, 2011a, 2013b). BCBS’s view is that global systemic importance should be cap-tured as a Loss-Given-Default (LGD) concept, which measures the systemic impact that a bank’s failure may have on the global financial system and the wider economy, rather than the probability of such a bank’s failure, which refers to the Probability of Default (PD) concept. Then, following an indicator-based measurement approach, banks get a score. This number defines the bucket in which they are thrown depending on their po-sition regarding the cutoff points which delimitate the bucket size. Given the bucket, a specific amount of HLA is required. This G-SIB’s HLA requirement, which is a minimum amount, will be added to the Common Equity Tier One of the G-SIB and correspond to a percentage of its Risk-Weighted Asset.
In addition to this bucketing approach based on the clustering of scores produced by the methodology, an approach leading to a capital surcharge, addressing systemic risk also implies being careful with the behavior of those banks. With this risk, the global financial system faces moral hazard, and being a G-SIB can be viewed as a good
opportunity because banks are sure to be well capitalized and more intensively monitored. However, this surcharge can be viewed either as a blessing or a punishment because financial institutions are explicitly too big and/or too interconnected to be saved (Markose et al., 2010), and have to quickly raise new capital, which can be very expensive. Even if banks wanted to reduce their contribution, they would have no strong incentive to do so. Indeed, their funding cost would increase and the reduction of their risk means a loss in the return of their market share, then these global actors become less competitive and could face opposition from shareholders against this strategy. With this public list of G-SIBs, banks have an explicit guarantee from a government support which may amplify risk-taking, reduce market discipline, create competitive distortions and so increase the probability of distress of those banks. For these reasons, a tightly additional supervision has been requested. Ancillary quantitative indicators relating to specific aspects and a supervisory judgement based on qualitative information are also used to gauge the potential effect of a G-SIB (BCBS, 2013b). For example, in 2011, 27 banks were identified by the score indicator and 2 have been added based on home supervisory judgement (BCBS, 2011a, 2013b).
Based on this regulatory framework, Table 1.1 reports the worldwide list of G-SIBs
published by the Financial Stability Board in 2011 using data as of end-2009.12 When the
SRISK is presented by its authors at a conference, they argue that this measure is close to this list of G-SIBs and show that the ranking which is obtained with the SRISK is not linked to the leverage, the MES (measure of interconnection) and the size (captured by the market capitalization). Unsurprisingly, SRISK allows to identify 23 out of 29 of these G-SIBs. Moreover, using this measure it is possible to pinpoint which banks are the riskiest. However we show that, at this date, the ranking based on the quarterly book value of liabilities reports 26 out of 29 of these G-SIBs, whereas 25 banks can be found
both in the SRISK and the quarterly book value of debt lists.13 In presenting this table,
our point is not to argue about the identification of G-SIBs, which is carefully done by the regulator using a thorough methodology to assess systemic risk. Instead, we just want to point out that a market model-based approach to estimate the contribution of individual bank to systemic risk (such as the SRISK) is not far from the BCBS output and could be an useful measure to proxy the systemic contribution of a given firm while this quantity is close to the total amount of liabilities. The SRISK is a daily measure designed to
gauge the expected capital shortfall that a given bank may have during a global financial
crisis. This quantity can be adjusted to deal with a domestic financial crisis and thus to potentially identify D-SIB. However, the SRISK as well as the MES and the ∆CoVaR 12An updated list of G-SIBs published in 2012 (Financial Stability Board, 2012), where two banks have been added to
the list (BBVA and Standard Chartered) and three removed (Commerzbank, Dexia and Lloyds, is available).
13According to the updated list of G-SIBs published in 2012 based on end of 2011 data, the SRISK and the quarterly
book value of liabilities identify 21 out of 28 G-SIBs tagged by the BCBS whereas the SRISK and the quarterly book value of liabilities rankings have 25 institutions in common among the first 28 G-SIBs.
1.2 Principles for SIBs
remain concerned by the robustness of its results. Danielsson et al. (2012) point out that the signal provided by the MES and the ∆CoVaR is highly unreliable and conclude that
Table 1.1 Systemic Risk Rankings: G-SIBs December 31, 2009
G-SIBs
FSB SRISK Liability
Bank of America Royal Bank of Scotland BNP Paribas
Bank of China2,3 BNP Paribas Royal Bank of Scotland
Bank of New York Mellon 2,3 Deutsche Bank Deutsche Bank
Banque Populaire CdE2,3 Group Crédit Agricole HSBC
Barclays Barclays Group Crédit Agricole BNP Paribas Mitsubishi UFJ FG Mitsubishi UFJ FG Citigroup Mizuho FG Barclays
Commerzbank ING Bank Bank of America Credit Suisse Lloyds Banking Group JP Morgan Chase Deutsche Bank Commerzbank Citigroup
Dexia Citigroup Mizuho FG Goldman Sachs2 Société Générale ING Bank
Group Crédit Agricole UBS Lloyds Banking Group HSBC Sumitomo Mitsui FG Santander
ING Bank HSBC Société Générale JP Morgan Chase Unicredit Group UBS
Lloyds Banking Group Bank of America Unicredit Group Mitsubishi UFJ FG Dexia Commerzbank Mizuho FG Santander Sumitomo Mitsui FG Morgan Stanley Credit Suisse Wells Fargo2
Nordea JP Morgan Chase Credit Suisse
Royal Bank of Scotland Natixis1,3 Intesa Sanpaolo SpA1
Santander Danske Bank A/S1 Dexia
Société Générale Morgan Stanley Goldman Sachs2
State Street2,3 Intesa Sanpaolo SpA1 Banco Bilbao V. A.1
Sumitomo Mitsui FG Nordea Morgan Stanley UBS KBC Groep NV1,3 Nordea
Unicredit Group Banco Bilbao V. A.1 Danske Bank A/S1
Wells Fargo2 Resona Holdings1,3 National Australia Bank1,2
Sources: FSB and V-Lab website. Notes: In the first column, labeled FSB, we report the list in alphabetic order of the 29 G-SIBs identified according to the methodology set out in the BCBS document “Global systemically important banks: Assessment methodology and the additional loss absorbency requirement”, using data as of end-2009. To be fair we report, in the second column labeled SRISK, the publicly available ranking (available on the VLab website) of the first 29 G-SIBs identified by the SRISK measure on December 31, 2009. In the third column, labeled Liability, we disclose the ranking based on the total amount of liabilities dated from December 31, 2009. The following1 tags banks which are not identified by the FSB,2 tags banks which are not identified by the SRISK and3 tags banks which are not identified by the total amount of liabilities.
a leverage ratio may offer a more sensible approach to deal with systemic risk. Drehmann and Tarashev (2011b) argue that simple indicators are able to gauge some aspects of systemic risk and Benoit et al. (2013) show that the SRISK does not encompass the multiple facets of systemic risk. In this case, the identification of G-SIB is mainly driven by the total amount of liabilities because at this global level, principal actors are large banks which are well-known worldwide.
Dealing with systemic risk means taking the multifaceted threat into account, and one of the main issues is probably not the identification of G-SIBs since one could reproduce almost every single future list of G-SIBs using only a combination of simple indicators such as the amount of liabilities and the leverage. The principal identification issue arises at a domestic level, where the number of banks which are concerned is different. Indeed, at the worldwide level, the 75 largest global banks based on the financial year-end Basel III leverage ratio exposure measure exceeding the threshold of 200 billion euros (BCBS, 2013a), are taken into account, as well as banks that have been classified as a G-SIB the previous year are included in the sample (BCBS, 2013b). At the domestic level, this number is smaller and at least the size indicator of the bank has to be updated. Furthermore, the degree of interconnection is certainly thinner and therefore difficult to be easily captured. Thus, the BCBS methodology as well as market-based SRMs have to be modified according to the domestic level-playing field.
1.2.3 D-SIBs Assessment
A set of 12 principles composes the D-SIB framework (BCBS, 2012). The two key aspects that shape this methodology are:
1. the reference system for the assessment of systemic impact; and 2. the unit of analysis, i.e. the bank which is being concerned.
The Committee responds clearly to these questions, the appropriate reference system should be the domestic economy whereas the unit of analysis are banks from a (globally) consolidated perspective. In other words, the localization of the systemic risk event is the
domestic market and its magnitude has to be calibrated to the country specifics. Banks’ subsidiaries are studied at the consolidated state when its banking group is hosted by the domestic jurisdiction. Indeed, a banking group involved in cross-border activities potentially has significant spillovers to the domestic economy when its subsidiaries fail. In contrast with the host authorities which have to assess these foreign subsidiaries at a local level or sub-consolidated basis from their domestic economy. For example, Emporiki Bank was a Greek subsidiary of Crédit Agricole until 2012, from the French authority Crédit Agricole has to be studied at the consolidated perspective, i.e. taking into account Emporiki Bank’s activities. But from the Greek authority point of view, Emporiki Bank is in its scope as well as all its foreign subsidiaries but Crédit Agricole is not.
1.2 Principles for SIBs
The D-SIB methodology is designed as the G-SIB approach, 4 bank-specific factors are used instead of 5, size, interconnectedness, financial institution infrastructure and complexity. The size of the domestic economy is also required because countries with a larger banking sector relative to GDP are more likely to suffer from a D-SIB failure in its own jurisdiction. Banks can be classified as D-SIBs but not as G-SIBs when their domestic activities have no impact on the global economy but only on the domestic financial system. A bank identified as a G-SIB can also be classified as a D-SIB in any of the countries in which the bank has significant operations. However, banks with large global operations can be classified as a G-SIB but not as a D-SIB if those activities have no significant impact in any domestic economy (Deloitte, 2013). When the banking group has been identified as a G-SIB as well as a D-SIB in the home jurisdiction, the national authorities should impose the higher of either the D-SIB or G-SIB HLA requirements (BCBS, 2012). Indeed, the BCBC is setting minimum standards of capital, so an asymmetric treatment is set out for banks which are not G-SIBs but D-SIBs or both at the same time.
For a given bank, one could argue G-SIB HLA has to be higher than the D-SIB HLA because at the global level, the totality of its interconnections are known and not only its domestic linkages. Thus a global shock should lead to a bigger HLA requirement. However, the marginal effect of this global shock is less than the domestic shock, a global shock is more spread out than the domestic shock. As in an earthquake where the seismic magnitude and damages are greater the closer you are to the epicenter, the D-SIB HLA has to be higher than the G-SIB HLA when you face a domestic shock. Moreover, D-SIB can be viewed as the worst case because a bank is penalized although it is not a global actor. Banks identified as domestic actors probably want to grow until becoming principal actors but their growth is reduced due to the HLA requirement. However, given the repartition of systemic risk in five equal parts, 20% for each systemic risk factor in the G-SIB methodology, a bank could reduce one of those factors to increase its degree of interconnectedness and become a global actor without being further penalized. So far, no incentives have been considered to reduce the degree of interconnectedness or common exposure of a given financial system to an exogenous source of risk, which is the key element of systemic risk at a domestic level.
At the domestic level, Brämer and Gischer (2011) replace the cross-jurisdictional activ-ity by the Domestic sentiment. Another attempt has been made by Engle, Jondeau and Rockinger (2014) to identify D-SIB with the SRISK measure. Even if they have worked at the consolidated perspective for each bank, they have used their classic SRISK di-vided by the GDP of the country to identify D-SIB and so compare and rank banks at the European level according to their adjusted SRISK. However, to accurately deal with D-SIB two modification have to be done. First a domestic shock, not a global one should be applied. Thus, their DRISK has to be preferred to their SRISK. Second, adjusting