Energy Procedia 74 ( 2015 ) 1248 – 1257
ScienceDirect
1876-6102 © 2015 The Authors. Published by Elsevier Ltd. This is an open access article under the CC BY-NC-ND license (http://creativecommons.org/licenses/by-nc-nd/4 .0/).
Peer-review under responsibility of the Euro-Mediterranean Institute for Sustainable Development (EUMISD) doi: 10.1016/j.egypro.2015.07.769
International Conference on Technologies and Materials for Renewable Energy, Environment and
Sustainability, TMREES15
DWT and Hilbert Transform for Broken Rotor Bar Fault Diagnosis
in Induction Machine at Low Load
B. Bessam
a,b, A. Menacer
a, M. Boumehraz
b, H. Cherif
*aLGEB Laboratory, Department of Electrical Engineering, University of Biskra, BP 145, 07000, Biskra, Algeria bLMSE Laboratory, Department of Electrical Engineering, University of Biskra, BP 145, 07000, Biskra, Algeria *LGEB Laboratory, Department of Electrical Engineering, institute of sciences and technology, University El-Oued, Algeria,
Abstract
In this paper a new technique for broken rotor bars diagnosis in induction machine at low load and non stationary state is proposed. The technique is used in order to remedy the problem from using the classical signal-processing technique FFT by analysis of stator current envelope. The proposed method is based from using discrete wavelet transform (DWT) and Hilbert transform. The Hilbert transform is used to extract the stator current envelope. Then this signal is processed via DWT. The efficiency of the proposed method is verified by simulation tests.
Keywords: Induction Motor, Diagnosis, Hilbert transform, discrete wavelet transform;
1. Introduction
Three-phase induction motors are the "workhorses" of industry. They are the most widely used electrical machines, for their reliability and simplicity of construction. In an industrialized nation, they can typically consume between 40% and 50% of all the generated capacity of that country [1]. But, they are subject to failures, which may be inherent in the machine itself, or due to operating conditions. Failure surveys [2], have reported that percentage failure by components in induction motors is typically:
• stator related (38%); • rotor related (10%); • bearing related (40%); • and others (12%).
But, in recent years, due to the need to support the severe voltage stresses of solid-state inverters, and to operate in highly corrosive and dusty environments, the design and build quality of stator windings have achieved marked
improvements, while cage rotor design has undergone little change [3]. So, nowadays, rotor failures account for a larger percentage of total induction motor failures, with broken rotor bars being one of the most common causes [4].
Traditionally, the monitoring and diagnostic of broken rotor bars based on motor current signature analysis (MCSA) [5] used as non invasive method to detect sidebands harmonics around the fundamental supply frequency expressed by:
frbb= (1 ± 2s)f (1) Where frbb is the related broken bar frequency, f is the power supply frequency and s is the slip.
However, at low load these components (1±2s)f are relatively close to the fundamental component, which makes their detection much more difficult. To avoid this problem, the amplitude modulation (AM) of stator current induced by rotor asymmetry is exploited in aid of diagnostic. In fact, the rotor fault effect can be localized in the stator current envelope spectrum at frequency expressed by [6]:
f0= 2ksf (2)
This last information has the ideal frequency location for a discrete wavelet transform (DWT) which has been already applied directly to stator current for diagnosis of broken rotor bar faults in induction machine [7]. In this case, the DWT is used as an efficient time-domain algorithm which gives optimal accuracy at low frequency and non-stationary state.
Wavelet transform is an analysis method for time varying or non-stationary signals and uses a description of spectral decomposition via the scaling concept. Wavelet theory provides a unified framework for a number of techniques which have been developed for various signal processing applications [8]. One of its features is multi-resolution signal analysis with a vigorous function of both time and frequency localization. This method is effective for stationary signal processing as well as non stationary signal processing.
The main objective of this paper is proposing a method for the rotor fault diagnosis based on wavelet and Hilbert transform. The proposed method consists in applying the DWT of stator current envelope, to compute the energy associated to the rotor fault in the frequency bandwidth where the total rotor fault effect is localized. Then, this energy computation is used to detect a rotor fault and to evaluate its severity at low load and non stationary state.
2. Hilbert transform of a phase stator current (HT)
The HT is a well-known signal analysis method, used in different scientific fields such as fault diagnosis [9], geophysical data processing, detection of mechanical load faults in induction motors [10], diagnosis of rotor cage faults in induction motors [11], and others.
The HT of a real signal x(t), such as the phase current, is used to emphasize its local properties. Mathematically, it is defined as a convolution with the function 1/t, as follows [2]:
³
+∞ ∞ − τ τ − τ π = × π = = d t ) ( x ) t ( x t ) t ( y )) t ( x ( HT 1 1 (3)The divergence at t = IJis allowed for by taking the Cauchy principal value of the integral. By coupling the x(t) and its HT, the so-called analytic signal (AS)→x(t)is created:
) t ( j e ) t ( a ) t ( jy ) t ( x ) t ( x θ → = + = (4) where
[
2 2]
1 2 °¯ ° ® = θ + = )) t ( y / ) t ( x arctan( ) t ( ) t ( y ) t ( x ) t ( a / (5)Where a(t) is the instantaneous amplitude of →
x
(
t
)
, which can reflect how the energy of x(t) varies with time and ș(t) is the instantaneous phase of →x
(
t
)
.3. Discrete wavelet transform (DWT)
The wavelet transform is a time–frequency analysis technique. It decomposes a signal in terms of oscillations (wavelets) in both time and frequency. Its main idea is the dyadic band pass filtering process carried out by this transform. Given a certain sampled signal S= (S1, S2 … Sn), the DWT decomposes it into several wavelet signals an approximation signal an, and n detail signals dj (j ∈ [1,n]) [12]. The frequencies of approximation and detail signals can be given by ] f , f [ ) d ( f s j s ) j ( j ∈ 2− + 2− 1 (6) ] f , [ ) a ( f n ∈ 0 2−(n+1) s (7)
More concretely, fs (samples/s): the sampling rate used for capturing S, the detail signal dj contains the information concerning the signal components with frequencies included in the interval.
Therefore, the DWT carries out the filtering process shown in figure. 1. Note that the filtering is not ideal, a fact leading to a certain overlap between adjacent frequency bands. This causes some distortions if a certain frequency component of the signal is close to the limit of band.
Fig. 1 Filtering process performed by the DWT.
Due to the automatic filtering performed by the DWT, the tool provides a very attractive flexibility for the simultaneous analysis of the transient evolution of rather different frequency components present in the same signal.
In comparison with other tools, the computational requirements are low. In addition, the DWT is available in standard commercial software packages. So no special or complex algorithm is required.
The wavelet energy (WE) is very usefully features for signal analysis [8]. The energy eigenvalue of each frequency band is defined as:
¦
= = =k n k j,k j D (n) E 1 2 (8)Where
j
=
1
,
2
,
2
n−1;n
is the discrete wavelet decomposition time; Di is the magnitude in each discrete point of the wavelet coefficient of the signal in the corresponding frequency band [13].The eigenvalue Ei contains information on the signal of the stator current for a motor behaviour. In addition, the amplitudes of the deviation of some eigenvalues indicate the severity of the defect, which makes Ej a good candidate for diagnosing broken bars of the rotor.
4. Model of Induction Machine with Broken Rotor Bars Faults
Fig.2 illustrates rotor fault circuit diagram of induction machine, with the equivalent resistance, in the case of broken bars. The model of a three phase induction motor in the reference frame (d-q) related to the rotor is [14]:
¯ ® = + ⋅ ω = ) t ( Cx ) t ( y ) t ( Bu ) t ( x ) ( A ) t ( x (9)
with
[
]
T qr dr qs ds i i x= φ φ , » ¼ º « ¬ ª = qs ds U U u , » ¼ º « ¬ ª = qs ds i i y » » » » » ¼ º « « « « « ¬ ª − ω + − ω − ω ω + − = ω − − − − − − − − − − 1 1 1 1 1 1 1 1 1 1 0 0 0 0 m eq eq m eq eq f m eq f r f eq s r f r f m eq r f eq s L R R L R R L L R L L ) R R ( L L L R L ) R R ( ) ( A » » » » » ¼ º « « « « « ¬ ª = − − 0 0 0 0 0 0 1 1 f f L L B , » ¼ º « ¬ ª = 0 0 1 0 0 0 0 1 C r r eqR
Q
R
R
(
)
1
θ
0α
α
−
+
=
» ¼ º « ¬ ª θ θ θ θ θ θ = θ 2 0 0 0 0 0 2 0 0 ) sin( ) sin( ) cos( ) sin( ) cos( ) cos( ) ( Q and 0 3 2 η = α , b bc n n 3 0 = η P r ω =Ω : is mechanical speed of the motor.
bc
n and nb represent the number of broken bars and the total number of bars in the rotor respectively. 0
θ
: an absolute localization of the faulty winding according to the first rotor phase.Fig. 2 Broken rotor bars mode
The expression of the torque is given by:
) i i ( p Te= qsφdr− dsφqr (10)
5. Simulation Results
5.1. Spectrum of stator current envelope analysis
The motor used in the simulation study is a 1.1 KW, 220V, 50 Hz, 4-pole induction motor, with a rotor with 28 bars. The system parameters of the induction motor tested in this study are given in Appendix. Fig. 3 shows time variations of motor currents in cases of a healthy rotor and faulted motors. When compared to the healthy motor, the currents of faulted motors show significant fluctuations.
Several tests, for healthy and faulty rotor were carried out. In each case, after acquisition of one phase stator current and extraction of its envelope via Hilbert transform, the FFT is applied to obtain the envelope spectrum. In Fig. 4, the result of rotor broken bars sees an increase in the magnitude of harmonics amplitude of the stator current envelope.
Fig. 4 Spectrum of stator current envelope at low load (s=1%) :(a) healthy rotor; (b) one broken rotor bar; (c) two broken rotor bars
5.2 Application of the discrete wavelet transform DWT
Before the application of the DWT, first we have to select the type of mother wavelet and the number of decomposition levels.
• Selection of the mother wavelet
An important step is the selection of the mother wavelet to carry out the analysis. There are several wavelet families with different mathematical properties have been developed [15].
For extraction of fault components, after development of multiple tests shows that a wide variety of wavelet families can give the satisfactory results. In our case we have used Daubechies-44 as the mother wavelet for the DWT analyses.
• Specification of the Number of Decomposition levels
The number of decomposition levels is determined by the low frequency components. For the extraction of the frequency components caused by broken rotor bars, the number of decomposition level should be equal. This number of decomposition level, Nf is given by [8].
1 2 + ¸ ¸ ¸ ¸ ¸ ¹ · ¨ ¨ ¨ ¨ ¨ © § ¸¸ ¹ · ¨¨ © § > f log( ) f log int N s f (11)
Considering f = 10000 samples/sec and fs = 50Hz, The frequency bands associated with each wavelet signal are shown in Table 1.
Table 1.Frequency bands for wavelet signal. Level Approximations Details
J=9 a9 0-9.765 d9 9.765-19.53 J=10 a10 0-4.88 d10 4.88-9.765 J=11 a11 0-2.44 d11 2.44-4.88 J=12 a12 0-1.22 d12 1.22-2.44
5.3DWT of the Stator Current envelope analysis
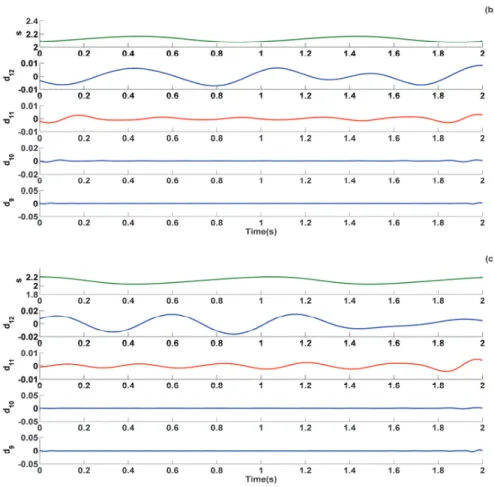
The "Daubechies wavelets" of different order are used to decompose the stator current of each machine. Fig. 5 shows the detail and approximation signals (d12, d11, d10, and d9) obtained by db44. The calculation of the energy eigenvalue E indicates the variation of this energy, as shown in figure .6.
Fig. 5 Details and approximation at low load (s=1%) for (a) healthy, (b) one broken bar, (c) two broken bars
In Fig.5 is displayed, the DWT of Stator Current envelope , the evolution in the observed frequency bands of the relative signal to the rotor defect can be analyzed using coefficients d12, d11 and d10 to d9. While analyzing the effect of the rotor defect in the bands of the frequencies of interest, one can see that the energy depends on the type of defect. The difference between the healthy rotor and the deficient rotors is clearly shown in Fig.6.
In Fig. 5, the analysis of the signals resulting from the wavelet decomposition shows a particular variation at the d12 level, which fits the characteristic pattern mentioned before, caused by the fault (broken rotor bars) in the machine. We could find important differences for the motor broken rotor bars since they contain the frequency components 2ksf, where give d12 all the information in the frequency band (1.22-2.44Hz) (Table 1). From this, it can be affirmed that the method provides information about the presence of broken rotor bars at low load and non stationarystate.
Fig. 6 Eigenvector changes at various levels of decomposed signals at low load (s=1%).
Fig.6 clearly shows the variation of the energy eigenvalue. One can observe that the energy stored in band 12 depends on the degree of the default. Obviously, the energy in level 12 represents the number of broken bars of the squirrel-cage rotor.
6. Conclusion
In this paper, the approach signal analysis is used for broken rotor bar diagnosis in an induction motor based on the stator current envelope. The approach uses two techniques such as, Hilbert transform and DWT. The proposed method consists in applying the DWT of Stator Current envelope, to compute the energy associated to the rotor fault in the frequency bandwidth where the total rotor fault effect is localized. Then, this energy computation is used to detect a rotor fault and to evaluate its severity at low load and non stationarystate. According the test results, that the DWT provides a means of indicating the degree of asymmetry within the induction motor. Nevertheless, it does not provide a clear indication about the severity of the fault. For that, we use the eigenvector as the indicator for determining fault severity.
Appendix A. Parameters for induction machine
P Output power 1.1 KW VsStator voltage 220/380 V IsNominal current 2.6/4.3 A nnNomina speed 1425 rpm Rs Stator resistance 9.81 Rsrotor resistance 3.83 LmMutual inductance 436 Mh
Lf Leakage inductance of stator 76.2 mH P Number of pole pairs 2 n Number of stator slots 48 nb Number of rotor bars 28 nsNumber of turns per stator phase 464
References
[1] W. T. Thomson and M. Fenger. Current signature analysis to detect induction motor faults. IEEE Ind. Appl. Mag., vol. 7, no. 4, pp. 26–34, Jul./Aug. 2001.
[2] R. Puche-Panadero, M. Pineda-Sanchez, M. Riera-Guasp,J. Roger-Folch, Hurtado-Perez, and J. Perez-Cruz. Improved Resolution of the MCSA Method Via Hilbert Transform, Enabling the Diagnosis of Rotor Asymmetries at Very Low Slip. IEEE Trans.Energy Convers , vol. 24, no.1, March 2009.
[3] A. H. Bonnett and T. Albers. Squirrel-cage rotor options for ac induction motors. IEEE Trans . Ind . Appl. vol. 37, no. 4, pp. 1197–1209, Jul./Aug. 2001.
[4] M. E. H. Benbouzid and G. B. Kliman. What stator current processing based technique to use for induction motor rotor faults diagnosis. IEEE Trans. Energy Convers., vol. 18, no. 2, pp. 238–244, Jun.2003.
[5] R.Kechida , A.Menacer,H.Talhaoui. Approach Signal for Rotor Fault Detection in Induction Motors. J Fail. Anal. and Preven,vol. 13, March 2013.
[6] S.H, Kia, H. Henao, G.A. Capolino. Diagnosis of Broken Bar Fault in Induction Machines Using Discrete Wavelet Transform without Slip Estimation. IEEE. Trans. Application, vol. 45, no. 4, july/August 2009.
[7] A. Menacer, R. Kechida, H. Talhaoui, S. Tnani. Application of the Fourier and the Wavelet Transform for the Fault Detection in Induction Motors at the Startup Electromagnetic Torque. 8th IEEE International Symposium on Diagnostics for Electrical Machines, Power Electronics & Drives, SDEMPED 2011, Bologna,Italy September 5-8, 2011.
[8] A. Bouzida, O. Touhami, R. Ibtiouen, A. Belouchrani, M. Fadel and A. Rezzoug. Fault Diagnosis in Industrial Induction Machines through Discrete Wavelet Transform. IEEE Trans. Industrial Electronics, vol. 58, no.09, pp. 4385-4395, 2011.
[9] Z. K. Peng, P. W. Tse, and F. L. Chu. A comparison study of improved Hilbert–Huang transform and wavelet transform: Application to fault diagnosis for rolling bearing. Mech. Syst. Signal Process., vol. 19, pp. 974– 988, 2005.
[10] M. Blodt, M. Chabert, J. Regnier, and J. Faucher. Mechanical load fault detection in induction motors by stator current time-frequency analysis. IEEE Trans. Ind. Appl., vol. 42, no. 6, pp. 1454–1463, Nov./Dec. 2006.
[11] Z. Liu, X. Zhang, X. Yin, and Z. Zhang. Rotor cage fault diagnosis in induction motors based on spectral analysis of current Hilbert modulus. In: Proc. IEEE Power Eng. Soc. Gen. Meeting, Jun. 3–10, 2004, vol. 2, pp. 1500–1503.
[12] H.Talhaoui, A.Menacer, A;Kessal , R.Kechida. Fast Fourier and discrete wavelet transforms applied to sensor less vector control induction motor for rotor bar faults diagnosis. ISA Transactions; pp,1639–1649,( 2014).
[13] S. R. Kapoor, N. Khandelwal, P. Pareek. Bearing fault analysis by signal energy calculation based signal processing technique in Squirrel Cage Induction Motor. International Conference on Signal Propagation and Computer Technology, pp. 33–38 (2014).
[14] S. Bachir, S. Tnani, J-C. Trigeassou, G. Champenois. Diagnosis by parameter estimation of stator and rotor faults occurring in induction machines. IEEE Trans. Indus. Electronics, vol.53, no.3, pp.973-973, June 2006.
[15] C. S. Burrus, R. A. Gopinath, and H. Guo. Introduction to Wavelets and Wavelet Transforms. A Primer. Englewood Cliffs, NJ: Prentice Hall, 1998.