(will be inserted by the editor)
A Multi-Tier Adaptive Grid Algorithm for the Evolutionary
Multi-Objective Optimisation of Complex Problems
Shahin Rostami · Alex Shenfield
Received: date / Accepted: date
Abstract The multi-tier Covariance Matrix Adapta-tion Pareto Archived EvoluAdapta-tion Strategy (m-CMA-PAES) is an evolutionary multi-objective optimisation (EMO) algorithm for real-valued optimisation problems. It com-bines a non-elitist adaptive grid based selection scheme with the efficient strategy parameter adaptation of the elitist Covariance Matrix Adaptation Evolution Strat-egy (CMA-ES). In the original CMA-PAES, a solution is selected as a parent for the next population using an elitist adaptive grid archiving (AGA) scheme derived from the Pareto Archived Evolution Strategy (PAES). In contrast, a multi-tiered AGA scheme to populate the archive using an adaptive grid for each level of non-dominated solutions in the considered candidate population is proposed. The new selection scheme im-proves the performance of the CMA-PAES as shown using benchmark functions from the ZDT, CEC09, and DTLZ test suite in a comparison against the (µ+λ) Multi-Objective Covariance Matrix Adaptation Evolu-tion Strategy (CMA-ES). In comparison to MO-CMA-ES, the experimental results show that the pro-posed algorithm offers up to a 69% performance in-crease according to the Inverse Generational Distance (IGD) metric.
Keywords Multi-objective optimisation· evolution-ary algorithms · evolution strategies · covariance matrix adaptation·adaptive grid archiving
S. Rostami
Dept of Computing and Informatics, Bournemouth Univer-sity, Bournemouth, BH12 5BB, United Kingdom
Tel.: (+44) 01202 962403
E-mail: [email protected] A. Shenfield
Department of Engineering and Mathematics, Sheffield Hal-lam University, Sheffield, S1 1WB
1 Introduction
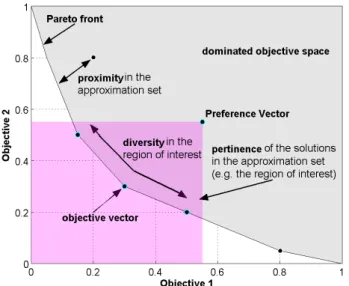
The quality of the set of candidate solutions to a multi-objective optimisation problem can be assessed using three criteria: proximity to the true Pareto front (i.e. how close the set of candidate solutions is to the true global solution set), diversity (i.e. how well distributed the set of candidate solutions is over the true Pareto-optimal front), and pertinency (i.e. how relevant the set of candidate solutions is to a decision maker). An ideal approximation set should be uniformly spread across the true Pareto-optimal front (Deb, 2001), or - in real-world problems at least - that part of it that represents a useful subset of solutions to the problem1(Purshouse and Fleming, 2007).
The vast majority of the current state-of-the-art Evolutionary Multiobjective Optimisation (EMO) al-gorithms employ elitism to enhance convergence to the true Pareto-optimal front. Elitism ensures some or all of the fittest individuals in a population at generationg are inserted into generationg+ 1. Using this method, it is possible to prevent the loss of the fittest individuals which are considered to have some of the most valu-able chromosomes in the population. However, in many multi-objective optimisation problems, solutions exist which may not be considered elite due to their objec-tive value in regards to the population, but may contain useful genetic information. This genetic information can be utilised later in the search to move into unexplored areas of the objective-space, but due to elitism and
non-1 For example, in the design of automotive engines there is
typically a trade-off between torque generated and emissions produced. Designs at the extreme ends of this trade-off sur-face (i.e. with good emissions but poor torque - or vice versa) are usually not very useful for production automobiles.
dominated sorting schemes it may be abandoned in the early stages of the search.
The aim of this study is to counter the potential negative effects resulting from elitist approaches to se-lection (for example, the bounded Pareto archive used in the Covariance Matrix Adaption - Pareto Archived Evolution Strategy (CMA-PAES)) by not only preserv-ing elite solutions but also focuspreserv-ing part of the function evaluation budget on non-elitist solutions that have the potential to contribute useful genetic information in the future. To achieve this, a novel multi-tier adaptive grid selection scheme is developed and combined with the existing CMA-PAES algorithm, in a new augmented al-gorithm named the Multi-tier Covariance Matrix Adap-tation Pareto Archived Evolution Strategy. This novel algorithm sacrifices a portion of the function evaluation budget in favour of producing diverse approximation sets consisting of solutions from areas of the objective space which are difficult or impossible to obtain with an elitism approach. With this feature, the final approxi-mation set offers a better representation of the trade-off surface, therefore allowing the decision maker to make a more informed selection. The performance of this new algorithm is then evaluated on several benchmarking test suites from the literature.
The paper is organised as follows: Section 2 intro-duces the field of evolutionary multi-objective optimisa-tion and its performance characteristics, Secoptimisa-tion 3 in-troduces the CMA-PAES algorithm and novel multi-tier adaptive grid algorithm, Section 4 contains the ex-perimental set-up and methods of performance assess-ment, Section 5 presents and discusses the results, and Section 6 draws some conclusions as well as suggesting future research direction.
2 Background
2.1 Evolutionary algorithms
Evolutionary Algorithms (EAs) are an optimisation te-chnique inspired by some of the concepts behind natural selection and population genetics and are capable of it-eratively evolving a population of candidate solutions to a problem (Goldberg, 1989). They both explore the solution space of a problem (by using variation opera-tors such as mutation and recombination) and exploit valuable information present in the previous generation of candidate solutions (by using a selection operator which gives preference to the best solutions in the pop-ulation when creating the next generation of solutions to be evaluated).
One of the main reasons evolutionary algorithms are applicable across many different problem domains
(including those where conventional optimisation tech-niques struggle) is their direct use of evaluation function information, rather than derivative information or other auxiliary knowledge. Derivative information (for exam-ple) can be extremely difficult to calculate in many real-world problems because the evaluation of candidate so-lutions can be expensive. Evolutionary algorithms are also robust to noisy solution spaces because of their population based nature. This means that each gen-eration contains more information about the shape of the fitness landscape than would be available to con-ventional, non-population based optimisation methods (Michalewicz and Fogel, 2000).
Evolutionary algorithms have also been used in com-bination with other approaches to optimisation to form hybrid algorithms which have been applied successfully to real-world problems (Sfrent and Pop, 2015). Hyper-heuristics are a methodology in search and optimisa-tion which are concerned with choosing an appropriate heuristic or algorithm in any given optimisation context (Burke et al, 2003), and can operate on meta-heuristics. Hybrid algorithms indicate the benefits of using an ap-proach which aim to combine existing algorithms and heuristics such that a more general approach can be taken to optimisation.
2.2 Evolutionary multi-objective optimisation
Many real-world optimisation problems involve the sat-isfaction of several objectives which, in a general form, can be described by a vector of objective functions f and a corresponding set of decision variablesv, as illus-trated in equation 1.
min
f (v) = (f1(v), f2(v), . . . , fM(v)) (1)
In many problems conflicts occur between objectives such that it is not possible to find a single ideal solution to the problem. In this case, the solution consists of a set of Pareto optimal points - where any improvement in one objective will lead to a deterioration in one or more of the other objectives.
The quality of the set of non-dominated solutions (known as theapproximation set) can be characterised by considering three main measures (Purshouse, 2003):
– Theproximityof the approximation set to the true Pareto front.
– Thediversityof the distribution of solutions in the approximation set.
– Thepertinenceof the solutions in the approxima-tion set to the decision maker.
These concepts are illustrated graphically in Fig. 1, where a single objective value is defined as xm and an
objective vector ofM objectives can be defined as X = hx1, x2, . . . , xMi. A preference vector can be defined as
P = hρ1, ρ2, . . . , ρMi, where every entry ρm refers to
the goal which the corresponding objective values xm
must satisfy.
An ideal approximation set should contain solutions that are as close as possible to the true Pareto front (i.e. having goodproximity) and provide a uniform spread of solutions across the region of interest of the decision maker (i.e. having a diverse set of candidate solutions that arepertinent to the decision maker).
Fig. 1: Characterising the approximation set for a bi-objective problem
Conventional multi-objective optimisation methods often fail to satisfy all these requirements, with meth-ods such as the weighted sum method (Hwang and Ma-sud, 1979) and the goal attainment method (Gembicki, 1974) only capable of finding a single point from the approximation set rather than a diverse distribution of potential solutions. This means that such algorithms do not fully capture the shape of the trade-off space without running the optimisation routine many times. In contrast, Evolutionary Algorithms (EAs) iteratively evolve a population of candidate solutions to a prob-lem in parallel and are thus capable of finding multiple non-dominated solutions. This results in a diverse set of potential solutions to choose from, rather than a single solution that may not meet the required performance criteria.
2.3 Obtaining good proximity
The primary goal in evolutionary multi-objective opti-misation is finding an approximation set that has good proximity to the Pareto front. This ensures that the candidate solutions in this approximation set represent optimal trade-offs between objectives. The early ap-proaches to evolutionary multi-objective optimisation were primarily concerned with guiding the search to-wards the Pareto front, reflecting the importance of this goal.
Convergence to the Pareto front is mainly driven by selection for variation, where the best candidate solu-tions are assigned the highest fitness (and thus have the best chance of contributing to the next genera-tion). Several techniques have been proposed to solve the problem of assigning scalar fitness values to indi-viduals in the presence of multiple objectives - with Pareto-based methods generally being considered the best. Several variants of Pareto based fitness assignment methods exist (see Zitzler et al (2004) for more informa-tion), but the general procedure is to rank individuals in the approximation set according to some dominance criterion, and then map fitness values to these ranks (of-ten via a linear transformation). Mating selection then proceeds using these fitness values.
The proximity of the approximation set to the true Pareto front can be enhanced by the use of elitism. Elitism aims to address the problem of losing good so-lutions during the optimisation process (Zitzler et al, 2004), either by maintaining an external population of non-dominated solutions (commonly referred to as anarchive), or by using a (µ+λ) type environmental selection mechanism. Studies have shown that elitist MOEAs perform favourably when compared to their non-elitist counterparts (Zitzler and Thiele, 1999; Zit-zler et al, 2000a). Elitism has also been shown to be a theoretical requirement to guarantee convergence of an MOEA in the limit condition (Rudolph and Agapie, 2000).
In archive based elitism, the archive can be used either just to store good solutions generated by the MOEA, or can be integrated into the algorithm with individuals from the archive participating in the selec-tion process. Some mechanism is often needed to control the number of non-dominated solutions in the archive, since the archive is usually a finite size and the number of non-dominated individuals can potentially be infi-nite. Density based measures to preserve diversity are commonly used in this archive reduction - for example, the Pareto Archived Evolution Strategy (Knowles and Corne, 2000a) uses an adaptive crowding procedure to preserve diversity (see later).
An alternative elitist strategy is the (µ+λ) popu-lation reduction scheme, where the parent popupopu-lation and the child population compete against each other for selection. This scheme originated in Evolution Strate-gies and forms the basis of the environmental selection scheme used in algorithms such as NSGA-II (Deb et al, 2002a) and, more recently, the Multi-Objective Covari-ance Matrix Adaptation Evolutionary Strategy (MO-CMA-ES) (Igel et al, 2007). In both these algorithms a two level sorting process is used, with Pareto dom-inance as the primary sorting criteria and population density as a secondary sorting criteria (used as a tie-breaker amongst individuals having the same level of non-dominance).
MO-CMA-ES is a state-of-the-art elitist multiob-jective evolutionary optimisation technique that builds upon the powerful covariance matrix adaptation evo-lution strategy (CMA-ES) real-valued single objective optimiser (Hansen and Ostermeier, 2001; Hansen et al, 2003). The key features of CMA-ES are that it is invari-ant against linear transformations of the search space, performs extremely well across a broad spectrum of problems in the continuous domain (Auger and Hansen, 2005), and is robust to the initial choice of parameters (due to its advanced self-adaptation strategy). These make the CMA-ES algorithm an excellent choice to base a multi-objective evolutionary optimisation on.
Two variants of MO-CMA-ES exist in the literature: the s-MO-CMA-ES which achieves diversity using the contributing hypervolume measure (or s-metric) intro-duced by (Zitzler and Thiele, 1998), and the c -MO-CMA-ES which achieves diversity using the crowding-distance measure introduced in NSGA-II. Whilst ini-tial results have shown that MO-CMA-ES is extremely promising, it is as yet mostly untested on real-world en-gineering problems. Some results show that MO-CMA-ES struggles to converge to good solutions on prob-lems with many deceptive locally Pareto-optimal fronts - a feature that can be common in real-world problems (Voß et al, 2010).
In the original MO-CMA-ES, a mutated offspring solution is considered to be successful if it dominates its parent. In contrast, (Voß et al, 2010) introduces a new MO-CMA-ES variant which considers a solution suc-cessful if it is selected to be in the next parent popula-tion, introduces a new update rule for the self-adaptive strategy, and conducts a comparison of MO-CMA-ES variants on synthetic test functions consisting of up to three objectives. MO-CMA-ES with the improved up-date rule is shown to perform substantially better than the original algorithm and is thus is used for compari-son in Section 5 of this paper.
2.4 Obtaining good diversity
Most EMO algorithms use density information in the selection process to maintain diversity in the approx-imation set. However, diversity preservation has often been seen as a secondary consideration (after obtaining good proximity to the Pareto front). This is because, as Bosman and Thierens (2003) state:
“. . . since the goal is to preserve diversity along an approximation set that is as close as possi-ble to the Pareto optimal front, rather than to preserve diversity in general, the exploitation of diversity should not precede the exploitation of proximity.”
Goldberg (1989) initially suggested the use of a nic-hing strategy in EMO to maintain diversity, with most of the first generation of Pareto based EMO algorithms using the concept of fitness sharing from single objec-tive EA theory (Fonseca and Fleming, 1993; Horn et al, 1994; Srinivas and Deb, 1994). However, the success of fitness sharing is strongly dependent on the choice of an appropriate niche size parameter, σshare. Whilst
several authors proposed guidelines for choosingσshare
(Deb and Goldberg, 1989; Fonseca and Fleming, 1993), Fonseca and Fleming (1995) were the first to note the similarity between fitness sharing and kernel density estimation in statistics which then provided the EMO community with a set of established techniques for au-tomatically selecting the niche size parameter, such as theEpanechnikov estimator (Silverman, 1986).
A large number of the second generation of Pareto-based MOEAs include advanced methods of estimating the population density, inspired by statistical density estimation techniques. These can be mainly classified into histogram techniques (such as that used in PAES (Knowles and Corne, 2000a)) ornearest neighbour den-sity estimators (such as that used in SPEA2 (Zitzler et al, 2001) and NSGA-II (Deb et al, 2002a)). Other approaches to diversity preservation include the use of hybrid algorithms, such as the Hybrid Immune-Genetic-Algorithm (HIGA) Istin et al (2011), which uses an im-mune component to continuously evolve new solutions and then inject them back into the population of an EA. These estimates of population density can be used in both mating selection and environmental selection. In mating selection these density estimates are com-monly used to discriminate between individuals of the same rank. Individuals from a less dense part of the population are assigned higher fitness and thus have a higher chance of contributing to the next generation.
Density estimation in environmental selection is co-mmonly used when there exists more locally non domi-nated solutions than can be retained in the population.
For example, in archive based elitism, density based clustering methods are often used to reduce the archive to the required size. Non-dominated solutions from spa-rser regions of the search space are again preferred over those from regions with higher population densities, with the aim being to ensure that the external pop-ulation contains a diverse set of candidate solutions in close proximity to the Pareto front.
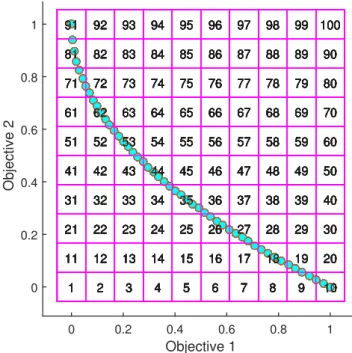
The Pareto Archived Evolution Strategy (Knowles and Corne, 2000a) uses an adaptive crowding procedure to preserve diversity that recursively divides up the ob-jective space into grid segements. This bounded Pareto archiving technique then uses this adaptive grid to keep track of the density of solutions within sections of the objective space (Knowles and Corne, 1999). Since it is adaptive, this crowding procedure does not require the critical setting of a niche size parameter which was a common problem with traditional kernel based methods of diversity preservation. This Adaptive Grid Archiving (AGA) scheme uses a grid with a pre-configured num-ber of divisions to divide the objective space and, when a solution is generated, its grid location is identified and associated with it. Each grid location is considered to contain its own sub-population, and information on how many solutions in the archive are located within a certain grid location is available during the optimisa-tion process. Fig. 2 illustrates this grid archiving scheme in two dimensions, in this example it can be observed that the sub-population at grid location 91 holds a sin-gle solution whereas the sub-population at grid location 62 contains many more. With this additional informa-tion, it is possible to discard a solution from one of the more densely populated sub-populations in favour of a candidate solution which will be located in a sparsely populated sub-population e.g. the one located at grid location 91.
When an archive has reached capacity and a new candidate solution is to be archived, the information tracked by the AGA is used to replace a solution in the grid location containing the highest number of so-lutions. When a candidate solution is non-dominated in regards to the current solution and the archive, the grid information is used to select the solution from the least populated grid location as the current (and par-ent) solution.
The AGA concept used in PAES later inspired sev-eral researchers and was altered and deployed in multi-ple EMO algorithms such as the Pareto Envelope-based Selection Algorithm (PESA) (a population based ver-sion of PAES) (Corne et al, 2000), the Micro Genetic Algorithm (Coello Coello and Pulido, 2001), and the Domination Based Multi-Objective Evolutionary Algo-rithm (-MOEA) (Deb et al, 2005).
Objective 1 0 0.2 0.4 0.6 0.8 1 Objective 2 0 0.2 0.4 0.6 0.8 1 1 2 3 4 5 6 7 8 9 10 11 12 13 14 15 16 17 18 19 20 21 22 23 24 25 26 27 28 29 30 31 32 33 34 35 36 37 38 39 40 41 42 43 44 45 46 47 48 49 50 51 52 53 54 55 56 57 58 59 60 61 62 63 64 65 66 67 68 69 70 71 72 73 74 75 76 77 78 79 80 81 82 83 84 85 86 87 88 89 90 91 92 93 94 95 96 97 98 99 100 1 2 3 4 5 6 7 8 9 10 11 12 13 14 15 16 17 18 19 20 21 22 23 24 25 26 27 28 29 30 31 32 33 34 35 36 37 38 39 40 41 42 43 44 45 46 47 48 49 50 51 52 53 54 55 56 57 58 59 60 61 62 63 64 65 66 67 68 69 70 71 72 73 74 75 76 77 78 79 80 81 82 83 84 85 86 87 88 89 90 91 92 93 94 95 96 97 98 99 100 1 2 3 4 5 6 7 8 9 10 11 12 13 14 15 16 17 18 19 20 21 22 23 24 25 26 27 28 29 30 31 32 33 34 35 36 37 38 39 40 41 42 43 44 45 46 47 48 49 50 51 52 53 54 55 56 57 58 59 60 61 62 63 64 65 66 67 68 69 70 71 72 73 74 75 76 77 78 79 80 81 82 83 84 85 86 87 88 89 90 91 92 93 94 95 96 97 98 99 100 1 2 3 4 5 6 7 8 9 10 11 12 13 14 15 16 17 18 19 20 21 22 23 24 25 26 27 28 29 30 31 32 33 34 35 36 37 38 39 40 41 42 43 44 45 46 47 48 49 50 51 52 53 54 55 56 57 58 59 60 61 62 63 64 65 66 67 68 69 70 71 72 73 74 75 76 77 78 79 80 81 82 83 84 85 86 87 88 89 90 91 92 93 94 95 96 97 98 99 100 1 2 3 4 5 6 7 8 9 10 11 12 13 14 15 16 17 18 19 20 21 22 23 24 25 26 27 28 29 30 31 32 33 34 35 36 37 38 39 40 41 42 43 44 45 46 47 48 49 50 51 52 53 54 55 56 57 58 59 60 61 62 63 64 65 66 67 68 69 70 71 72 73 74 75 76 77 78 79 80 81 82 83 84 85 86 87 88 89 90 91 92 93 94 95 96 97 98 99 100 1 2 3 4 5 6 7 8 9 10 11 12 13 14 15 16 17 18 19 20 21 22 23 24 25 26 27 28 29 30 31 32 33 34 35 36 37 38 39 40 41 42 43 44 45 46 47 48 49 50 51 52 53 54 55 56 57 58 59 60 61 62 63 64 65 66 67 68 69 70 71 72 73 74 75 76 77 78 79 80 81 82 83 84 85 86 87 88 89 90 91 92 93 94 95 96 97 98 99 100 1 2 3 4 5 6 7 8 9 10 11 12 13 14 15 16 17 18 19 20 21 22 23 24 25 26 27 28 29 30 31 32 33 34 35 36 37 38 39 40 41 42 43 44 45 46 47 48 49 50 51 52 53 54 55 56 57 58 59 60 61 62 63 64 65 66 67 68 69 70 71 72 73 74 75 76 77 78 79 80 81 82 83 84 85 86 87 88 89 90 91 92 93 94 95 96 97 98 99 100 1 2 3 4 5 6 7 8 9 10 11 12 13 14 15 16 17 18 19 20 21 22 23 24 25 26 27 28 29 30 31 32 33 34 35 36 37 38 39 40 41 42 43 44 45 46 47 48 49 50 51 52 53 54 55 56 57 58 59 60 61 62 63 64 65 66 67 68 69 70 71 72 73 74 75 76 77 78 79 80 81 82 83 84 85 86 87 88 89 90 91 92 93 94 95 96 97 98 99 100 1 2 3 4 5 6 7 8 9 10 11 12 13 14 15 16 17 18 19 20 21 22 23 24 25 26 27 28 29 30 31 32 33 34 35 36 37 38 39 40 41 42 43 44 45 46 47 48 49 50 51 52 53 54 55 56 57 58 59 60 61 62 63 64 65 66 67 68 69 70 71 72 73 74 75 76 77 78 79 80 81 82 83 84 85 86 87 88 89 90 91 92 93 94 95 96 97 98 99 100
Fig. 2: An example plot of a population and visualisa-tion of grid divisions managed by an AGA.
2.5 Issues with elitism
Whilst elitism has been almost universally adopted in the current state-of-the-art for evolutionary multi ob-jective optimisers, in many multi-obob-jective optimisation problems solutions may exist which are not considered elite due to their objective value in regards to the popu-lation but may still contain useful genetic information. This genetic information can be utilised later in the search to move into unexplored areas of the objective-space but, due to elitism and non-dominated sorting schemes, it may be abandoned in the early stages of the search.
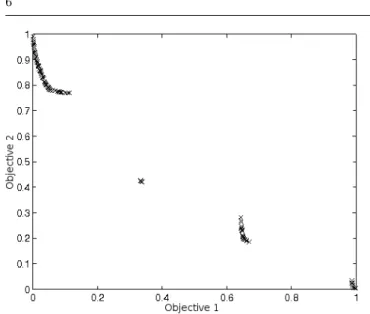
The consequences of elitism and non-dominated so-rting can be seen in Figure 3, where an elitist EMO algorithm has produced an approximation set for the CEC09 UF1 (Zhang et al, 2008b) test function with a budget of 300,000 function evaluations (in compliance with the CEC09 competition rules).
By observing this two-objective plot of the approx-imation set, it can be seen that the elitist EMO al-gorithm has converged to an approximation set which is missing three distinct areas containing solutions in comparison to the true Pareto-optimal front plotted in Figure 4. The genetic information which would have potentially found these missing areas was discarded by the algorithm during the search process due to the use of elitism and non-dominated sorting. This is a diffi-culty that occurs in the CEC09 UF1 test problem be-cause of its complicated Pareto-optimal set, which has
Fig. 3: An approximation set found using an elitist EMO algorithm after 300,000 function evaluations on CEC09 UF1.
some regions that are easier to reach. In these cases, eli-tist EMO algorithms will focus selection on these more dominant solutions and converge further into that area of the Pareto-optimal-set, discarding individuals which may have been only a few generations away from pro-ducing non-dominated solutions in unexplored areas of the objective-space.
Fig. 4: The true optimal front (left) and Pareto-optimal set (right) for CEC09 UF1.
Figure 5 illustrates an example of elitist and non-dominated selection discarding an individual that may contain valuable genetic information, which could have been exploited to produce a better quality approxi-mation set. In this example a Pareto AGA selection scheme has been used to select parent individuals for the next generation. Because of the scheme’s elitist na-ture, the individual between 0.6 and 0.7 on the x-axis has not been selected for reproduction, and therefore the scheme has discarded genetic information which may have ultimately produced solutions towards the missing area of the approximation set. This behaviour
over many generations can lead to convergence to in-complete approximation sets.
Fig. 5: An example of elitist and non-dominated selec-tion, circled points indicate a selected individual.
3 CMA-PAES
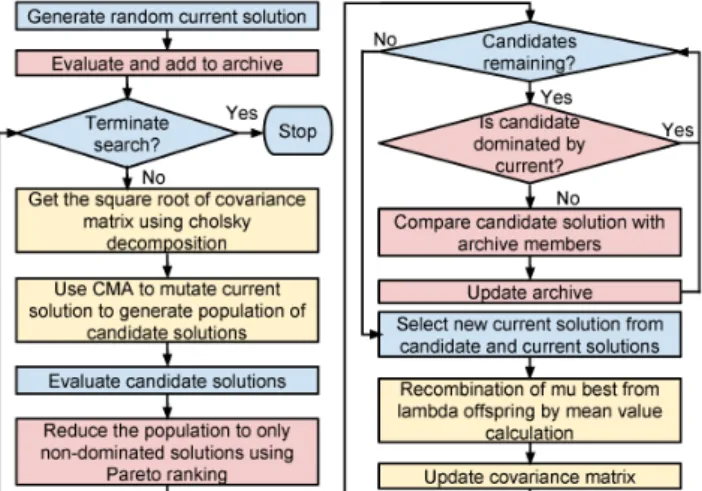
The Covariance Matrix Adaptation Pareto Archived Evolution Strategy is an extensible EMO algorithm fra-mework (Rostami and Shenfield, 2012) inspired by the simplicity of PAES (Knowles and Corne, 2000b). As a result the execution life-cycle of the optimisation pro-cess does not have a high computational cost in re-gards ot algorithm overhead. The modular structure of the algorithm has allowed for the Covariance Matrix Adaptation (CMA) operator to be easily incorporated in order to achieve fast convergence through the power-ful variation of population solutions. To manage these populations at each generational iteration, an Adaptive Grid Algorithm (AGA) approach is used in conjunction with bounded Pareto archiving with the aim of diver-sity preservation.
The algorithm execution life-cycle for CMA-PAES has been illustrated in Figure 6. CMA-PAES begins by initializing the algorithm variables and parameters, these include the number of grid divisions used in the AGA, the archive for storing Pareto-optimal solutions, the parent vectorY and the covariance matrix. An ini-tial current solution is then generated at random, which is evaluated and then the first to be archived (without being subjected to the PAES archiving procedure). The generational loop then begins, the square root of the covariance matrix is resolved using Cholsky decompo-sition (as recommended by Beyer and Sendhoff (2008))
which offers a less computationally demanding alter-native to spectral decomposition. The λcandidate so-lutions are then generated using copies of the current solution and the CMA-ES procedure for mutation be-fore being evaluated. The archive is then merged with the newly generated offspring and subjected to Pareto ranking, this assigns a rank of zero to all non-dominated solutions, and a rank reflecting the number of solutions that dominate the inferior solutions. The population is then purged of the inferior solutions so that only non-dominated solutions remain before being fed into the PAES archiving procedure. After the candidate solu-tions have been subjected to the archiving procedure and the grid has been adapted to the new solution cov-erage of objective space, the archive is scanned to iden-tify the grid location with the smallest population, this is considered the lowest density grid population (ldgp). The solutions from the lowest density grid population are then spliced onto the end of the first µ−ldgp of the Pareto rank ordered population to be included in the adaptation of the covariance matrix, with the aim to improve the diversity of the next generation by en-couraging movement into the least dense area of the grid. After the covariance matrix is updated, the gen-erational loop continues onto its next iteration until the termination criteria is satisfied (maximum number of generations).
Fig. 6: Execution life-cycle for the CMA-PAES algo-rithm.
CMA-PAES has been benchmarked against NSGA-II and PAES in Rostami and Shenfield (2012) on the ZDT synthetic test suite. Two performance metrics were used to compare the performance in terms of proximity (using the generational distance metric) and diversity (using the spread metric). CMA-PAES displayed su-perior performance (the significance of which was
sup-ported with randomisation testing) in returning an ap-proximation set close to or on the true Pareto-optimal front as well as maintaining diversity amongst solutions in the set.
CMA-PAES has also been benchmarked against the MO-CMA-ES algorithm in Rostami (2014), using the hypervolume indicator as a measure of performance. In this study, both the algorithms considered demon-strated comparable performance across multiple test problems. the significance of which was supported by the use of non-parametric testing.
3.1 A Novel Multi-Tier Adaptive Grid Algorithm
The new multi-tier AGA aims to prevent a population from prematurely converging as a result of following only the dominant (i.e. elite) solutions which may be discovered early in the optimisation process. This com-mon optimisation scenario often results in genetic drift and consequently a final approximation set with solu-tions clustered around these elite solusolu-tions. This pre-vention is achieved by dividing an optimisation function evaluation budget and investing a percentage of this budget in to non-elite solutions. This solutions which appear non-elite early on in the optimisation process may potentially contain genetic information that would contribute to finding undiscovered areas of the objec-tive space later in the search.
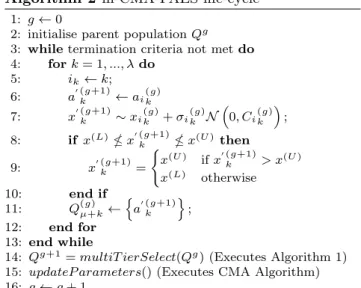
The algorithm pseudo-code for this new multi-tier approach is listed in Algorithm 1, which is executed from line 14 of the Multi-tier Covariance Matrix Adap-tation Pareto Archived Evolution Strategy (m-CMA-PAES) execution life-cycle presented in Algorithm 2. This new optimisation algorithm which builds upon the algorithmic components (AGA and CMA) outlined in Fig. 6 is referred to as the m-CMA-PAES. First, the candidate population is divided into sub-populations based on their non-dominated rank using NSGA-II’s fast non-dominated sort. If the size of any sub-population exceedsµ, then the standard AGA scheme is applied to it with a maximum archive capacity ofµ, resulting in a number of rank-ordered archives each with a maximum capacity of µ. Then, a single population of sizeµplus the budget for non-elite individuals β is produced, for example if β is set as 10% for a µ population of 100, then a population of size 100×1.10 is to be produced. Next the multi-tier archives containing the first µ×β solutions are merged with no size restriction (meaning the merged archive size can be greater than µ×β). This merged archive is then subjected to a non-elite AGA (ensuring non-elite solutions are not instantly dis-carded) with an archive capacity ofµ, producing a
pop-ulation of individuals to be selected as parents for the next generation.
The configuration ofβ is important to the conver-gence of the algorithm - if it is too high (for example if it is greater than half ofµ), then the majority of the function evaluation budget is spent on solutions which are dominated and the search does not progress in a positive direction, and may instead move away from the Pareto-optimal front. However ifβ is too small, the benefits of investing in non-elite solutions are not ex-ploited to an extent which will significantly impact the performance of the optimisation process. The result of this new grid selection scheme has been illustrated in Figure 7, where the solution which may potentially con-tain valuable genetic information is selected, in contrast to it being discarded in Figure 5.
Fig. 7: An example of the multi-tiered grid selection, circled points indicate a selected individual.
Algorithm 1 Pseudo-code of Multi-Tier Adaptive Grid Algorithm: multiTierSelect()
1: nonDominatedFronts = nonDominatedSort(population) 2: spaceRemaining =µ×β
3: for allnonDominatedFront in nonDominatedFrontsdo 4: if spaceRemaining >0then
5: tierArchive = adaptiveGridSelec-tion(nonDominatedFront,µ)
6: archive = archive + tierArchive
7: spaceRemaining = spaceRemaining - size(archive) 8: end if
parentPopulation = adaptiveGridSelection(archive, µ)
9: end for
In m-CMA-PAES, a population of candidate solu-tion individuals ai(g) are initialized as the structure
h xi(g),p¯ (g) succ,i, σi(g), p (g) i,c,C (g) i i
, where each individual is assigned a randomly generated problem variablexi(g)∈
Rn between the lower (x(L)) and upper (x(U)) vari-able boundaries, ¯p(succ,ig) ∈[0,1] is the smoothed success probability,σi(g)∈R+0 is the global step size,p
(g)
i,c ∈R
n
is the cumulative evolution path, and C(ig) ∈ Rn×n is
the covariance matrix of the search distribution.
Algorithm 2m-CMA-PAES life-cycle 1: g←0
2: initialise parent populationQg
3: whiletermination criteria not metdo 4: fork= 1, ..., λdo 5: ik←k; 6: a0(g+1)k ←ai(g)k 7: x0(g+1)k ∼xi (g) k +σi (g) k N 0, Ci (g) k ; 8: if x(L) x 0(g+1) k x(U)then 9: x0(g+1)k = ( x(U) ifx0(g+1) k > x(U) x(L) otherwise 10: end if 11: Q(g)µ+k←na0(g+1)k o; 12: end for 13: end while
14: Qg+1=multiT ierSelect(Qg) (Executes Algorithm 1)
15: updateP arameters() (Executes CMA Algorithm) 16: g←g+ 1
4 Experimental design and performance assessment
4.1 Experimental set-up
In order to evaluate the performance of m-CMA-PAES on multi-objective test problems, a pairwise comparison between m-CMA-PAES and MO-CMA-ES on selected benchmark problems from the literature (consisting of upto 3 objectives) has been conducted. MO-CMA-ES (as outlined in Section 2.3) is a state-of-the-art algo-rithm which uses the CMA operator for variance much like m-CMA-PAES.
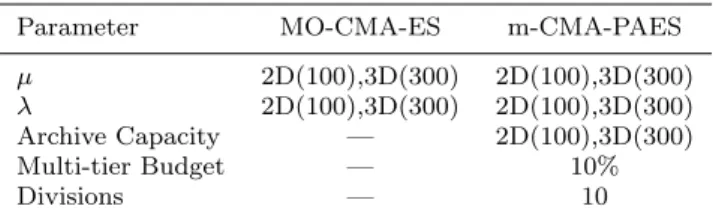
Both m-CMA-PAES and MO-CMA-ES have been configured with a budget of 300,000 function evalua-tions per algorithm execution, and were executed 30 times per test function as per the CEC2009 competition guidelines. The algorithm configurations are presented in Table 1, and the finer configurations for the CMA operator and MO-CMA-ES have been taken from Voß et al (2010), where the version of MO-CMA-ES used incorporates the improved step-size adaptation.
Table 1: Algorithm configurations used when bench-marking MO-CMA-ES and m-MA-PAES.
Parameter MO-CMA-ES m-CMA-PAES µ 2D(100),3D(300) 2D(100),3D(300) λ 2D(100),3D(300) 2D(100),3D(300) Archive Capacity — 2D(100),3D(300)
Multi-tier Budget — 10%
Divisions — 10
The ZDT, DTLZ, and CEC2009 test suites have been selected for the benchmarking and comparison of m-CMA-PAES and MO-CMA-ES (see Section 4.2). These test suites will pose both MOEAs with difficul-ties which are likely to be encountered in many real-world multi-objective optimisation problems, in both two-dimensional and three-dimensional objective spaces (allowing for feasible comparison with MO-CMA-ES which relies on the hypervolume indicator for secondary sorting and is thus computationally expensive in high-dimensional search spaces).
The metric used for performance assessment is the popular Inverted Generational Distance (IGD) indica-tor described in Section 4.3. The IGD indicaindica-tor will be used at each generation in order to assess perfor-mance, and compare both algorithms on not just the IGD quality of the final approximation set, but also the IGD quality over time. In order to comply with the CEC2009 competition rules (as described in Zhang et al (2008b)), both m-CMA-PAES and MO-CMA-ES have been executed 30 times on each test function to reduce stochastic noise. This sample size is seen as sufficient because of the limited benefit of producing more than 25 samples (discussed in Section 4.1.1).
4.1.1 Sample Size Sufficiency
Selecting a sufficient number of samples when compar-ing optimisers is critical. The sample size of 25, in order to reduce stochastic noise, is re-occurring in the evolu-tionary computation literature (e.g. Yang et al (2008); Zamuda et al (2007); De Falco et al (2012); Garc´ıa et al (2009); Wang et al (2011)). To prove the sufficiency of this sample size, a large number of hypervolume indi-cator value samples have been produced by executing m-CMA-PAES 200 times on the DTLZ1 synthetic test problem.
These 200 samples were then used to identify the relationship between the Standard Error of the Mean (SEM) and the sample size using:
SEM = √SD
N (2)
This relationship has been illustrated in Figure 8, which shows the limited benefit of more than 25 inde-pendent executions of the algorithm on the synthetic test problem.
Fig. 8: Relationship between Standard Error of the Mean (SEM) and the sample size of hypervolume in-dicator values from 200 executions of m-CMA-PAES on the DTLZ1 synthetic test problem.
sizes, evolution paths and covariance matrices of the successful solutions are updated.
4.2 Multi-objective Test Suites
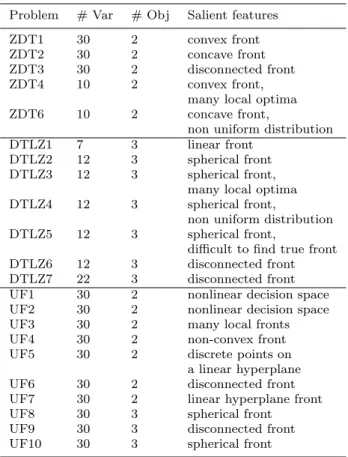
The performance of the novel m-CMA-PAES algorithm is compared to MO-CMA-ES across three different real-valued, synthetic, test suites: the widely used ZDT bi-objective test suite proposed in Zitzler et al (2000b), the scalable DTLZ multi-objective test suite proposed in Deb et al (2002b); and the unconstrained functions from the CEC2009 multi-objective competition test suite pro-posed in Zhang et al (2008b). The configurations used for these test problems and some of their slaient fea-tures are shown in Table 2
Each of these test suites incorporates a different balance of features that MOEAs may find difficult to overcome during the optimisation process (for example, multi-modal search landscapes, deceptive local Pareto-fronts, non-convex Pareto-Pareto-fronts, etc.). The ZDT and DTLZ test suites provide well defined Pareto-optimal fronts that have been widely used in the literature -thus allowing easy comparison with previous work. The CEC2009 multi-objective optimisation competition test suite is more recent and is predominantly made up of problems with solution sets that consist of complex curves through decision variable space. These test
prob-Table 2: Parameter configurations used for the ZDT, DTLZ and CEC09 test suites.
Problem # Var # Obj Salient features ZDT1 30 2 convex front ZDT2 30 2 concave front ZDT3 30 2 disconnected front ZDT4 10 2 convex front,
many local optima ZDT6 10 2 concave front,
non uniform distribution DTLZ1 7 3 linear front
DTLZ2 12 3 spherical front DTLZ3 12 3 spherical front,
many local optima DTLZ4 12 3 spherical front,
non uniform distribution DTLZ5 12 3 spherical front,
difficult to find true front DTLZ6 12 3 disconnected front DTLZ7 22 3 disconnected front UF1 30 2 nonlinear decision space UF2 30 2 nonlinear decision space UF3 30 2 many local fronts UF4 30 2 non-convex front UF5 30 2 discrete points on
a linear hyperplane UF6 30 2 disconnected front UF7 30 2 linear hyperplane front UF8 30 3 spherical front UF9 30 3 disconnected front UF10 30 3 spherical front
lems contain variable linkages and present many diffi-culties for multi-objective optimisation routines.
4.3 Performance Assessment
As the EMO process is stochastic by nature, each algo-rithm was executed 30 times against each test function, in an effort to minimise stochastic noise and increase the integrity of the comparison between the algorithms (see Section 4.1.1). The performance of each algorithm execution was then measured using the Inverted Gen-erational Distance (IGD) performance metric to assess the quality of the approximation set, in terms of prox-imity to the true Pareto-optimal front and the diversity of solutions in the population.
The IGD metric measures how well the obtained approximation set represents the true Pareto-optimal front which is provided as a large reference set. This is calculated by finding the minimum Euclidean distance of each point of the approximation set to points in the reference set. Lower IGD values indicate a better qual-ity approximation set with IGD values of 0 indicating all the solutions in the approximation set are in the reference set and cover all the Pareto front.
The IGD was introduced in Coello Coello and Cort´es (2005) as an enhancement to the generational distance metric, measuring the proximity of the approximation set to the true Pareto-optimal front in objective space. The IGD can be defined as:
IGD= q Pn0 i=1d 2 i n0 (3)
wheren0 is the number of solutions in the reference set, anddis the Euclidean distance (in objective space) between each solution in the reference set and the near-est solution in the approximation set. A GD value equal to zero indicates that all members of the approxima-tion set are on the true Pareto-optimal front, and any other value indicates the magnitude of the deviation of the approximation set from the true Pareto-optimal front. This implementation of the GD solves an issue in its predecessor so that it will not rate an approxi-mation set with a single solution on the reference set as better than an approximation set which has more non-dominated solutions that are close in proximity to the reference set.
Much like the GD measure, knowledge regarding the true Pareto-optimal front is required in order to form a reference set. The selection of solutions for the ref-erence set will have an impact on the results obtained from the IGD, and therefore the reference set must be diverse. The calculation of the IGD can be computa-tional expensive when working with large reference sets or a high number of objectives.
The IGD measure has been employed in the perfor-mance assessment of algorithms in much of the multi-objective optimisation and evolutionary computation literature (e.g. Zhang et al (2008a, 2010); Tiwari et al (2009); Chen et al (2009); Nasir et al (2011)).
4.4 Statistical comparison of stochastic optimisers
Statistical comparison of the performance of the algo-rithms was conducted by computing the t-values 2 of the IGD metric produced by both the algorithms. How-ever, when analysing stochastic systems (such as EAs) the initial conditions that ensure the reliability of para-metric tests cannot be satisfied (Li et al, 2012) - there-fore a non-parametric test (encouraged by Derrac et al (2011); Epitropakis et al (2012)) for pairwise statisti-cal comparison must be used to evaluate the signifi-cance of results. The Wilcoxon signed-ranks (Wilcoxon,
2 The t-value is the difference between the means of the
1945) non-parametric test (counter-part of the paired t-test) can be used with the statistical significance value (α = 0.05) to rank the difference in performance be-tween two algorithms over each approximation set.
Non-parametric testing is becoming more commonly used in the literature to statistically contrast the per-formance of evolutionary algorithms in many experi-ments (Garc´ıa et al, 2010; Derrac et al, 2012; Li et al, 2012; Epitropakis et al, 2012; Hatamlou, 2013; Civi-cioglu, 2013).
5 Results
The results from the experiments described in Section 4 have been produced and presented in a number of formats in order to allow for a better assessment of each algorithms performance.
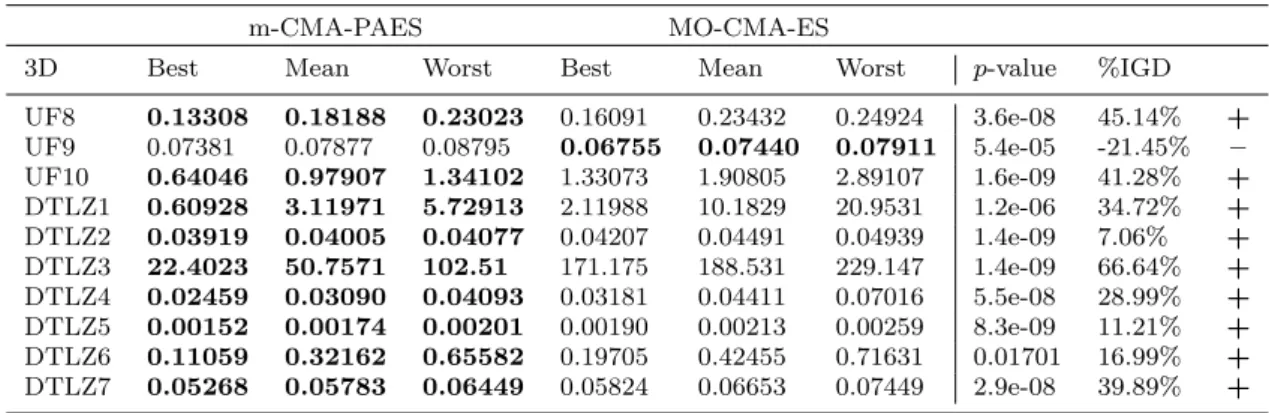
The worst, mean, and best IGD indicator results for the final approximation set of each algorithm are presented in Table 3 for the two-objective test tions, and in Table 4 for the three-objective test func-tions. Tables 3 and 4 also present information regard-ing the p-value resolved by the Wilcoxon signed-ranks non-parametric test for the final approximation sets of the considered synthetic test problems, and a sym-bol indicating the observation of the null hypothesis. A ’+’ symbol indicates that the null hypothesis was rejected, and m-CMA-PAES displayed statistically su-perior performance at the 95% significance level (α = 0.05) on the considered synthetic test function. A ’−’ symbol indicates that the null hypothesis was rejected, and m-CMA-PAES displayed statistically inferior per-formance. An ’=’ symbol indicates that there was no statistically significant difference between both of the considered algorithms on the synthetic test problem. The table column ”%IGD” indicates the difference in performance between m-CMA-PAES and MO-CMA-ES using m-CMA-PAES as the benchmark. This percent-age can be calculated by finding the normalised mean performance of each algorithm:
%IGD= 100× meana−worst best−worst − meanb−worst best−worst (4)
wheremeana is the mean performance for
m-CMA-PAES,meanb is the mean performance for
MO-CMA-ES,worst is the highest IGD achieved by either algo-rithm, and best is the lowest IGD achieved by either algorithm. A positive %IGD indicates the percentage of which m-CMA-PAES outperformed MO-CMA-ES, whereas a negative %IGD indicates the percentage of
which m-CMA-PAES was outperformed by MO-CMA-ES.
Overall, m-CMA-PAES outperformed MO-CMA-ES on all but 3 (ZDT3, UF6 and UF9) of the 22 test func-tions, producing better performing worst, mean, and best approximation sets.
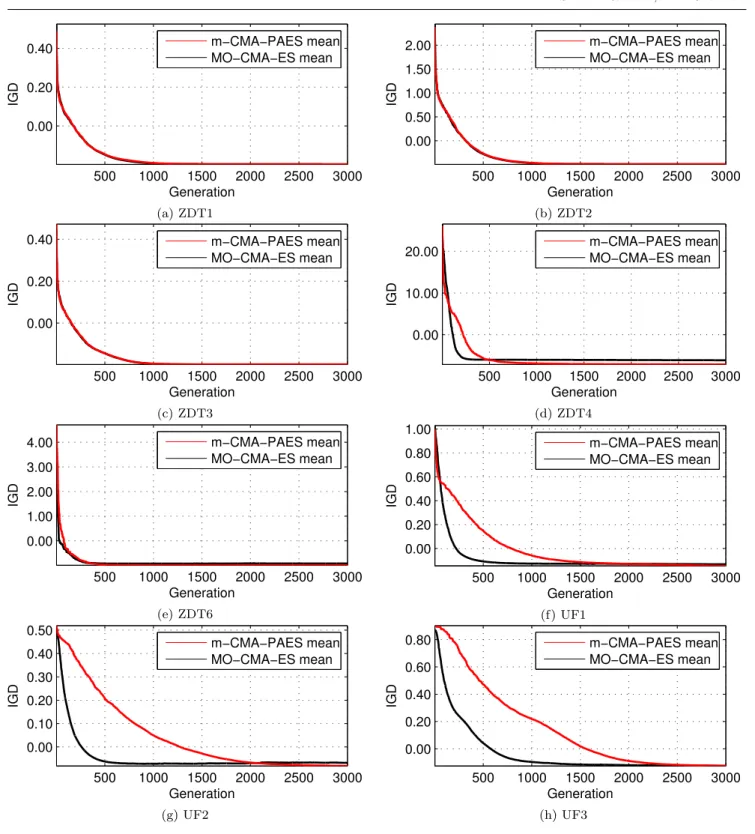
The mean of the IGD metric at each generation has been plotted and presented in Figure 9 for the two-objective test functions, and Figure 11 for the three-objective test functions. These plots illustrate the rate of IGD convergence from the initial population to the final population.
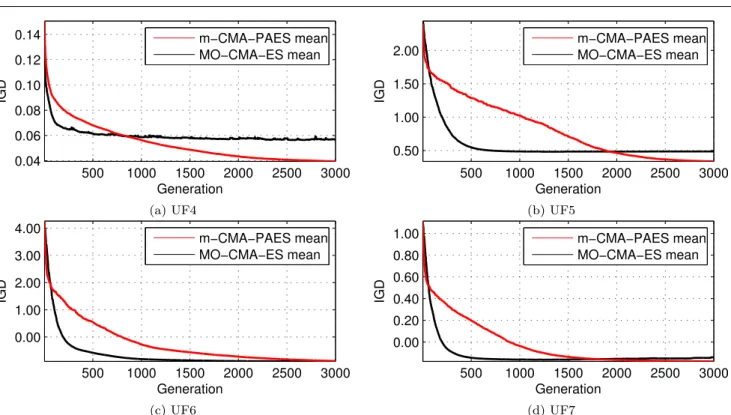
m-CMA-PAES significantly outperforms the MO-CMA-ES on most of the test-functions used in this comparison. However, as a consequence of investing a percentage of the maximum number of function evalu-ations in non-elite solutions, it can be observed in Fig-ures 9 and 11 that the convergence of the algorithm is slower in most cases (more so in the two-objective test functions). This suggests that in experiments where the number of function evaluations are not constrained to a low number, the m-CMA-PAES will outperform MO-CMA-ES.
It can be observed in Figures 9 and 11 that the mean IGD for MO-CMA-ES oscillates or rises on some test functions over time. This issue is most visible on UF4 (where the mean IGD for MO-CMA-ES can be seen to oscillate over time) and on DTLZ3 (where the mean IGD for MO-CMA-ES can be seen to improve in perfor-mance until 200 generations and then worsen gradually until termination). This issue is due to MO-CMA-ES being dependent on the hypervolume indicator entirely for diversity preservation which, when paired with its elitism scheme, ends up gradually reducing the IGD quality of an approximation set once a difficult area of the search space is encountered.
The results presented in Table 3 and Table 4, as well as the box plots presented in Figure 13 and Figure 14, show that on 18 of the 22 considered test functions m-CMA-PAES significantly outperformed MO-CMA-ES in regards to the achieved mean and median IGD. The box plots show that the interquartile ranges for the m-CMA-PAES results are significantly better than the in-terquartile ranges for the MO-CMA-ES results. Across all test functions m-CMA-PAES produces fewer outliers - indicating a more reliable and robust algorithm than MO-CMA-ES on the considered test functions.
On the UF3 test function, it can be observed (in Fig-ure 13) that, although the MO-CMA-ES median IGD outperforms m-CMA-PAES, m-CMA-PAES achieved a better interquartile range and a far better total range -achieving the best approximation set for that test func-tion. A similar result can be seen in the performance
500 1000 1500 2000 2500 3000 0.00 0.20 0.40 IGD Generation m−CMA−PAES mean MO−CMA−ES mean (a) ZDT1 500 1000 1500 2000 2500 3000 0.00 0.50 1.00 1.50 2.00 IGD Generation m−CMA−PAES mean MO−CMA−ES mean (b) ZDT2 500 1000 1500 2000 2500 3000 0.00 0.20 0.40 IGD Generation m−CMA−PAES mean MO−CMA−ES mean (c) ZDT3 500 1000 1500 2000 2500 3000 0.00 10.00 20.00 IGD Generation m−CMA−PAES mean MO−CMA−ES mean (d) ZDT4 500 1000 1500 2000 2500 3000 0.00 1.00 2.00 3.00 4.00 IGD Generation m−CMA−PAES mean MO−CMA−ES mean (e) ZDT6 500 1000 1500 2000 2500 3000 0.00 0.20 0.40 0.60 0.80 1.00 IGD Generation m−CMA−PAES mean MO−CMA−ES mean (f) UF1 500 1000 1500 2000 2500 3000 0.00 0.10 0.20 0.30 0.40 0.50 IGD Generation m−CMA−PAES mean MO−CMA−ES mean (g) UF2 500 1000 1500 2000 2500 3000 0.00 0.20 0.40 0.60 0.80 IGD Generation m−CMA−PAES mean MO−CMA−ES mean (h) UF3
Fig. 9: IGD results at each generation visualising performance of m-CMA-PAES and MO-CMA-ES over 300,000 function evaluations on two-objective test problems, 30 runs.
Table 3: IGD results from 30 executions of m-CMA-PAES and MO-CMA-ES on the ZDT and CEC09 test suites with two problem objectives.
m-CMA-PAES MO-CMA-ES
2D Best Mean Worst Best Mean Worst p-value %IGD
ZDT1 0.00628 0.00657 0.00686 0.00813 0.00936 0.01031 1.4e-09 69.23% + ZDT2 0.00592 0.00614 0.00639 0.00989 0.01172 0.01511 1.4e-09 60.72% + ZDT3 0.00574 0.00609 0.00676 0.00552 0.00594 0.00643 0.0625 -12.10% = ZDT4 1.80044 6.17983 11.44563 2.85512 8.35397 14.56593 0.0232 17.03% + ZDT6 0.01132 0.01279 0.01406 0.04788 0.08938 0.20901 1.4e-09 38.74% + UF1 0.03762 0.05824 0.06579 0.05044 0.07228 0.12375 1.1e-06 17.00% + UF2 0.01359 0.02006 0.02687 0.02117 0.03496 0.05235 5.5e-08 38.44% + UF3 0.04869 0.07992 0.12647 0.06044 0.08129 0.10133 0.7269 1.76% = UF4 0.05925 0.06431 0.06942 0.07661 0.08261 0.09722 1.4e-09 48.20% + UF5 0.49880 0.72982 1.04816 0.87997 1.04873 1.26644 8.3e-09 41.54% + UF6 0.08817 0.12736 0.22802 0.09314 0.11268 0.22469 0.010432 -10.50% – UF7 0.01791 0.02431 0.03226 0.03306 0.06434 0.12773 1.4e-09 36.45% +
Table 4: IGD results from 30 executions of m-CMA-PAES and MO-CMA-ES on the DTLZ and CEC09 test suites with three problem objectives.
m-CMA-PAES MO-CMA-ES
3D Best Mean Worst Best Mean Worst p-value %IGD
UF8 0.13308 0.18188 0.23023 0.16091 0.23432 0.24924 3.6e-08 45.14% + UF9 0.07381 0.07877 0.08795 0.06755 0.07440 0.07911 5.4e-05 -21.45% – UF10 0.64046 0.97907 1.34102 1.33073 1.90805 2.89107 1.6e-09 41.28% + DTLZ1 0.60928 3.11971 5.72913 2.11988 10.1829 20.9531 1.2e-06 34.72% + DTLZ2 0.03919 0.04005 0.04077 0.04207 0.04491 0.04939 1.4e-09 7.06% + DTLZ3 22.4023 50.7571 102.51 171.175 188.531 229.147 1.4e-09 66.64% + DTLZ4 0.02459 0.03090 0.04093 0.03181 0.04411 0.07016 5.5e-08 28.99% + DTLZ5 0.00152 0.00174 0.00201 0.00190 0.00213 0.00259 8.3e-09 11.21% + DTLZ6 0.11059 0.32162 0.65582 0.19705 0.42455 0.71631 0.01701 16.99% + DTLZ7 0.05268 0.05783 0.06449 0.05824 0.06653 0.07449 2.9e-08 39.89% +
on UF6 where m-CMA-PAES also achieves the best ap-proximation set but is outperformed by MO-CMA-ES on the median values of the IGD results.
The MO-CMA-ES significantly outperforms the m-CMA-PAES on UF9. This function (as well as ZDT3 and UF6) consists of disjoint true Pareto-optimal fronts as shown in Figure 15. The comparison in performance on these problems shows that the m-CMA-PAES has performance issues on some problems consisting of mul-tiple parts in their Pareto-optimal fronts.
6 Conclusion
In this paper, a multi-tier AGA scheme has been intro-duced and incorporated into the CMA-PAES algorithm to create m-CMA-PAES. m-CMA-PAES improves the quality of the produced final approximation set by in-vesting a percentage of the allowed function evaluation budget in non-elite but potentially successfully solu-tions. With this approach, m-CMA-PAES is able to
find portions of the Pareto-optimal front which remain unexplored by elitist approaches. Experiments and sta-tistical analysis presented in this study show that with CEC09 competition compliant benchmarking configu-rations, m-CMA-PAES significantly outperforms MO-CMA-ES on all but 4 of the 22 considered synthetic test problems, and out of these 4, MO-CMA-ES only performs statistically significantly better on 2 test func-tions.
When observing the IGD values at each generation, it can be seen that in some cases the IGD of the final population is higher than some of the generations be-fore it, this is due to the non-elite solutions invested in at each generation being a factor right to the end of the algorithm. This suggests that in further work the algorithm may benefit from either an offline archive which the algorithm selects from at the end of the opti-misation process or a final approximation set selection scheme which uses the last two generations of the
op-500 1000 1500 2000 2500 3000 0.04 0.06 0.08 0.10 0.12 0.14 IGD Generation m−CMA−PAES mean MO−CMA−ES mean (a) UF4 500 1000 1500 2000 2500 3000 0.50 1.00 1.50 2.00 IGD Generation m−CMA−PAES mean MO−CMA−ES mean (b) UF5 500 1000 1500 2000 2500 3000 0.00 1.00 2.00 3.00 4.00 IGD Generation m−CMA−PAES mean MO−CMA−ES mean (c) UF6 500 1000 1500 2000 2500 3000 0.00 0.20 0.40 0.60 0.80 1.00 IGD Generation m−CMA−PAES mean MO−CMA−ES mean (d) UF7
Fig. 10: IGD results at each generation visualising performance of m-CMA-PAES and MO-CMA-ES over 300,000 function evaluations on two-objective test problems, 30 runs.
timisation process, including non-dominated solutions only.
The results indicate a clear trade-off between m-CMA-PAES and MO-CMA-ES. In the majority of the benchmarks MO-CMA-ES appears to offer a faster rate of convergence. However, this comes at the cost of pre-mature convergence very early in the optimisation pro-cess. In contrast, m-CMA-PAEs offers a slower rate of convergence throughout the entire optimisation pro-cess, with steady improvement until the end of the func-tion evaluafunc-tion budget. Unlike MO-CMA-ES, m-CMA-PAES does not subject the entire non-dominated pop-ulation to the contributing hypervolume indicator. By not doing so m-CMA-PAES remains computationally lightweight, unlike MO-CMA-ES which becomes com-putationally infeasible as the number of problem objec-tives increase. By investing a portion of the function evaluation budget in non-elite solutions, areas of the Pareto-optimal front which are difficult to obtain can be discovered later on in the optimisation process. This results in improved diversity and coverage in the pro-duced approximation sets.
Future works will further investigate the possibil-ity for self-adaptation of the m-CMA-PAES algorithm parameter which defines the budget for non-elite in-dividuals (β). A current limitation of m-CMA-PAES requires the manual configuration of the β parameter,
which may result in inefficient usage of the function evaluation budget when parameters such as the popula-tion size and the number of problem objectives change.
Compliance with Ethical Standards:
Conflict of Interest: Dr. Shahin Rostami declares that he has no conflict of interest. Dr. Alex Shenfield declares that he/she has no conflict of interest.
Ethical approval: This article does not contain any studies with human participants or animals performed by any of the authors.
References
Auger A, Hansen N (2005) A restart cma evolution strategy with increasing population size. In: Evolu-tionary Computation, 2005. The 2005 IEEE Congress on, IEEE, vol 2, pp 1769–1776
Beyer H, Sendhoff B (2008) Covariance matrix adap-tation revisited–the cmsa evolution strategy–. In: Parallel Problem Solving from Nature–PPSN X, Springer, pp 123–132
Bosman PAN, Thierens D (2003) The balance between proximity and diversity in multiobjective
evolution-250 500 750 1000 0.50 1.00 1.50 2.00 2.50 Generation IGD m−CMA−PAES mean MO−CMA−ES mean (a) UF8 250 500 750 1000 0.50 1.00 1.50 2.00 2.50 Generation IGD CMA−PAES mean MO−CMA−ES mean m-CMA-PAES mean (b) UF9 250 500 750 1000 2.00 4.00 6.00 8.00 10.00 12.00 14.00 Generation IGD m−CMA−PAES mean MO−CMA−ES mean (c) UF10 250 500 750 1000 5.00 10.00 15.00 20.00 25.00 Generation IGD m−CMA−PAES mean MO−CMA−ES mean (d) DTLZ1 250 500 750 1000 0.05 0.10 0.15 Generation IGD m−CMA−PAES mean MO−CMA−ES mean (e) DTLZ2 250 500 750 1000 60.00 80.00 100.00 120.00 Generation IGD m−CMA−PAES mean MO−CMA−ES mean (f) DTLZ3 250 500 750 1000 0.05 0.10 0.15 0.20 Generation IGD m−CMA−PAES mean MO−CMA−ES mean (g) DTLZ4 250 500 750 1000 0.05 0.10 0.15 0.20 0.25 0.30 Generation IGD m−CMA−PAES mean MO−CMA−ES mean (h) DTLZ5
Fig. 11: IGD results at each generation visualising performance of m-CMA-PAES and MO-CMA-ES over 300,000 function evaluations on three objective test problems, 30 runs.
250 500 750 1000 0.50 1.00 1.50 Generation IGD m−CMA−PAES mean MO−CMA−ES mean (a) DTLZ6 250 500 750 1000 1.00 2.00 3.00 4.00 5.00 6.00 Generation IGD m−CMA−PAES mean MO−CMA−ES mean (b) DTLZ7
Fig. 12: IGD results at each generation visualising performance of m-CMA-PAES and MO-CMA-ES over 300,000 function evaluations on three objective test problems, 30 runs.
7 8 9 10 x 10−3 1 2 ZDT1 0.006 0.008 0.01 0.012 0.014 1 2 ZDT2 5.5 6 6.5 x 10⁻³ 1 2 ZDT3 5 10 15 1 2 ZDT4 0.05 0.1 0.15 0.2 1 2 ZDT6 0.04 0.06 0.08 0.1 0.12 1 2 UF1 0.02 0.03 0.04 0.05 1 2 UF2 0.06 0.08 0.1 0.12 1 2 UF3 0.06 0.07 0.08 0.09 1 2 UF4 0.6 0.8 1 1.2 1 2 UF5 0.1 0.15 0.2 1 2 UF6 0.02 0.04 0.06 0.08 0.1 0.12 1 2 UF7
Fig. 13: Box plots of IGD indicator results for two-objective test problems (1: m-CMA-PAES; 2: MO-CMA-ES) 300,000 function evaluations, 30 runs.
0.15 0.2 0.25 1 2 UF8 0.07 0.075 0.08 0.085 1 2 UF9 1 1.5 2 2.5 3 1 2 UF10 0 5 10 15 20 1 2 DTLZ1 0.04 0.042 0.044 0.046 0.048 1 2 DTLZ2 50 100 150 200 1 2 DTLZ3 0.03 0.04 0.05 0.06 0.07 1 2 DTLZ4 1.5 2 2.5 x 10⁻³ 1 2 DTLZ5 0.2 0.4 0.6 1 2 DTLZ6 0.055 0.06 0.065 0.07 0.075 1 2 DTLZ7
Fig. 14: Box plots of IGD indicator results for three-objective test problems (1: m-CMA-PAES; 2: MO-CMA-ES) 300,000 function evaluations, 30 runs.
ary algorithms. IEEE Transactions on Evolutionary Computation 7(2):174–188
Burke E, Kendall G, Newall J, Hart E, Ross P, Schulen-burg S (2003) Hyper-heuristics: An emerging direc-tion in modern search technology. Internadirec-tional se-ries in operations research and management science pp 457–474
Chen CM, Chen Yp, Zhang Q (2009) Enhancing moea/d with guided mutation and priority update for multi-objective optimization. In: Evolutionary Com-putation, 2009. CEC’09. IEEE Congress on, IEEE, pp 209–216
Civicioglu P (2013) Backtracking search optimization algorithm for numerical optimization problems. Ap-plied Mathematics and Computation 219(15):8121– 8144
Coello Coello CA, Cort´es NC (2005) Solving multiob-jective optimization problems using an artificial im-mune system. Genetic Programming and Evolvable Machines 6(2):163–190
Coello Coello CA, Pulido GT (2001) A micro-genetic algorithm for multiobjective optimization. In: Evo-lutionary multi-criterion optimization, Springer, pp 126–140
Corne DW, Knowles JD, Oates MJ (2000) The pareto envelope-based selection algorithm for multiobjective optimization. In: Parallel Problem Solving from Na-ture PPSN VI, Springer, pp 839–848
De Falco I, Della Cioppa A, Maisto D, Scafuri U, Tarantino E (2012) Biological invasion–inspired mi-gration in distributed evolutionary algorithms. Infor-mation Sciences 207:50–65
Deb K (2001) objective optimization. Multi-objective optimization using evolutionary algorithms pp 13–46
Deb K, Goldberg DE (1989) An investigation of niche and species formation in genetic function optimiza-tion. In: Schaffer JD (ed) Proceedings of the Third
In-Fig. 15: True Pareto-optimal fronts plotted for problems ZDT3 (left), UF6 (middle) and UF9 (right).
ternational Conference on Genetic Algorithms, Mor-gan Kaufmann, pp 42–50
Deb K, Pratap A, Agarwel S, Meyarivan T (2002a) A fast and elitist multiobjective genetic algorithm: NSGA-II. IEEE Transactions on Evolutionary Com-putation 6(2):182–197
Deb K, Thiele L, Laumanns M, Zitzler E (2002b) Scal-able multi-objective optimization test problems. In: Proceedings of the Congress on Evolutionary Com-putation (CEC-2002),(Honolulu, USA), Proceedings of the Congress on Evolutionary Computation (CEC-2002),(Honolulu, USA), pp 825–830
Deb K, Mohan M, Mishra S (2005) Evaluating the ε -domination based multi-objective evolutionary algo-rithm for a quick computation of pareto-optimal so-lutions. Evolutionary computation 13(4):501–525 Derrac J, Garc´ıa S, Molina D, Herrera F (2011) A
prac-tical tutorial on the use of nonparametric statisprac-tical tests as a methodology for comparing evolutionary and swarm intelligence algorithms. Swarm and Evo-lutionary Computation 1(1):3–18
Derrac J, Cornelis C, Garc´ıa S, Herrera F (2012) En-hancing evolutionary instance selection algorithms by means of fuzzy rough set based feature selection. In-formation Sciences 186(1):73–92
Epitropakis M, Plagianakos V, Vrahatis M (2012) Evolving cognitive and social experience in particle swarm optimization through differential evolution: A hybrid approach. Information Sciences: an Interna-tional Journal 216:50–92
Fonseca CM, Fleming PJ (1993) Genetic algorithms for multi-objective optimization: Formulation, dis-cussion and generalization. In: Forrest S (ed) Pro-ceedings of the Fifth International Conference on Ge-netic Algorithms, Morgan Kaufmann, pp 416–423 Fonseca CM, Fleming PJ (1995) Multiobjective genetic
algorithms made easy: Selection, sharing, and mat-ing restriction. In: Zalzala AMS (ed) Proceedmat-ings of the First International Conference on Genetic
Algo-rithms in Engineering Systems: Innovations and Ap-plications (GALESIA), pp 42–52
Garc´ıa S, Molina D, Lozano M, Herrera F (2009) A study on the use of non-parametric tests for analyzing the evolutionary algorithms behaviour: a case study on the cec2005 special session on real parameter op-timization. Journal of Heuristics 15(6):617–644 Garc´ıa S, Fern´andez A, Luengo J, Herrera F (2010)
Advanced nonparametric tests for multiple compar-isons in the design of experiments in computational intelligence and data mining: Experimental analysis of power. Information Sciences 180(10):2044–2064 Gembicki FW (1974) Vector optimization for control
with performance and parameter sensitive indices. PhD thesis, Case Western Reserve University, Cleve-land, Ohio
Goldberg DE (1989) Genetic Algorithms in Search, Op-timization and Machine Learning. Addison-Wesley, Reading, MA.
Hansen N, Ostermeier A (2001) Completely derandom-ized self-adaptation in evolution strategies. Evolu-tionary computation 9(2):159–195
Hansen N, M¨uller SD, Koumoutsakos P (2003) Reduc-ing the time complexity of the derandomized evo-lution strategy with covariance matrix adaptation (cma-es). Evolutionary Computation 11(1):1–18 Hatamlou A (2013) Black hole: A new heuristic
opti-mization approach for data clustering. Information Sciences 222:175–184
Horn J, Nafpliotis N, Goldberg DE (1994) A niched Pareto genetic algorithm for multiobjective optimiza-tion. In: Proceedings of the Congress on Evolutionary Computation (CEC) 1994, IEEE Press, pp 82–87 Hwang CL, Masud ASM (1979) Multiple Objective
De-cision Making - Methods and Applications, Lecture Notes in Economics and Mathematical Systems, vol 164. Springer-Verlag, Berlin
Igel C, Hansen N, Roth S (2007) Covariance matrix adaptation for multi-objective optimization.
Evolu-tionary computation 15(1):1–28
Istin M, Pop F, Cristea V (2011) Higa: Hybrid immune-genetic algorithm for dependent task scheduling in large scale distributed systems. In: Parallel and Dis-tributed Computing (ISPDC), 2011 10th Interna-tional Symposium on, IEEE, pp 282–287
Knowles J, Corne D (1999) The pareto archived evo-lution strategy: A new baseline algorithm for pareto multiobjective optimisation. In: Evolutionary Com-putation, 1999. CEC 99. Proceedings of the 1999 Congress on, IEEE, vol 1
Knowles JD, Corne DW (2000a) Approximating the nondominated front using the Pareto archived evo-lution strategy. Evoevo-lutionary Computation 8(2):149– 172
Knowles JD, Corne DW (2000b) Approximating the nondominated front using the pareto archived evo-lution strategy. Evoevo-lutionary computation 8(2):149– 172
Li K, Kwong S, Cao J, Li M, Zheng J, Shen R (2012) Achieving balance between proximity and diversity in multi-objective evolutionary algorithm. Information Sciences 182(1):220–242
Michalewicz Z, Fogel DB (2000) How to Solve It: Mod-ern Heuristics. Springer, Berlin
Nasir M, Mondal AK, Sengupta S, Das S, Abraham A (2011) An improved multiobjective evolutionary algorithm based on decomposition with fuzzy dom-inance. In: Evolutionary Computation (CEC), 2011 IEEE Congress on, IEEE, pp 765–772
Purshouse RC (2003) On the evolutionary optimisation of many objectives. PhD thesis, Department of Auto-matic Control and Systems Engineering, University of Sheffield, Sheffield, UK, S1 3JD
Purshouse RC, Fleming PJ (2007) On the evolu-tionary optimization of many conflicting objectives. Evolutionary Computation, IEEE Transactions on 11(6):770–784
Rostami S (2014) Preference focussed many-objective evolutionary computation. PhD thesis, Manchester Metropolitan University, Manchester, UK
Rostami S, Shenfield A (2012) Cma-paes: Pareto archived evolution strategy using covariance ma-trix adaptation for multi-objective optimisation. In: Computational Intelligence (UKCI), 2012, IEEE, pp 1–8
Rudolph G, Agapie A (2000) Convergence properties of some multi-objective evolutionary algorithms. In: Proceedings of the Congress on Evolutionary Com-putation (CEC) 2000, IEEE Press, pp 1010–1016 Sfrent A, Pop F (2015) Asymptotic scheduling for many
task computing in big data platforms. Information Sciences 319:71–91
Silverman BW (1986) Density Estimation for Statistics and Data Analysis. Chapman and Hall, London Srinivas N, Deb K (1994) Multiobjective optimization
using nondominated sorting in genetic algorithms. Evolutionary Computation 2(3):221–248
Tiwari S, Fadel G, Koch P, Deb K (2009) Perfor-mance assessment of the hybrid archive-based micro genetic algorithm (amga) on the cec09 test problems. In: Evolutionary Computation, 2009. CEC’09. IEEE Congress on, IEEE, pp 1935–1942
Voß T, Hansen N, Igel C (2010) Improved step size adaptation for the mo-cma-es. In: Proceedings of the 12th annual conference on Genetic and evolutionary computation, ACM, pp 487–494
Wang Y, Cai Z, Zhang Q (2011) Differential evolu-tion with composite trial vector generaevolu-tion strategies and control parameters. Evolutionary Computation, IEEE Transactions on 15(1):55–66
Wilcoxon F (1945) Individual comparisons by ranking methods. Biometrics bulletin pp 80–83
Yang Z, Tang K, Yao X (2008) Large scale evolutionary optimization using cooperative coevolution. Informa-tion Sciences 178(15):2985–2999
Zamuda A, Brest J, Boskovic B, Zumer V (2007) Differ-ential evolution for multiobjective optimization with self adaptation. In: IEEE Congress on Evolutionary Computation, pp 3617–3624
Zhang Q, Zhou A, Jin Y (2008a) Rm-meda: A regular-ity model-based multiobjective estimation of distri-bution algorithm. Evolutionary Computation, IEEE Transactions on 12(1):41–63
Zhang Q, Zhou A, Zhao S, Suganthan PN, Liu W, Ti-wari S (2008b) Multiobjective optimization test in-stances for the cec 2009 special session and com-petition. University of Essex, Colchester, UK and Nanyang Technological University, Singapore, Spe-cial Session on Performance Assessment of Multi-Objective Optimization Algorithms, Technical Re-port
Zhang Q, Liu W, Tsang E, Virginas B (2010) Ex-pensive multiobjective optimization by moea/d with gaussian process model. Evolutionary Computation, IEEE Transactions on 14(3):456–474
Zitzler E, Thiele L (1998) An evolutionary algorithm for multiobjective optimization: The strength pareto approach. Citeseer
Zitzler E, Thiele L (1999) Multiobjective evolution-ary algorithms: A comparative case study and the strength Pareto approach. IEEE Transactions on Evolutionary Computation 3(4):257–271
Zitzler E, Deb K, Thiele L (2000a) Comparison of multiobjective evolutionary algorithms: Empirical re-sults. Evolutionary Computation 8(2):173–195
Zitzler E, Deb K, Thiele L (2000b) Comparison of multiobjective evolutionary algorithms: Empirical re-sults. Evolutionary computation 8(2):173–195 Zitzler E, Laumanns M, Thiele L (2001) SPEA2:
Im-proving the strength Pareto evolutionary algorithm. TIK Report 103, TIK Institut fur Technische Infor-matik und Kommunikationsnetze, Computer Engi-neering and Networks Laboratory, ETH, Swiss Fed-eral Institute of Technology, Gloriastrasse 35, 8092 Zurich, Switzerland
Zitzler E, Laumanns M, Bleuler S (2004) A tuto-rial on evolutionary multiobjective optimization. In: Gandibleux X, Sevaux M, S¨orensen K, T’Kindt V (eds) Methaheuristics for Multiobjective Optimisa-tion, Springer-Verlag, Berlin, Lecture Notes in Eco-nomics and Mathematical Systems, vol 535