RELATIONSHIP OF SPECIFIC LEAF AREA AND CARBON ISOTOPE
DISCRIMINATION WITH DRY MATTER PRODUCTION AND POD YIELD IN
GROUNDNUT GENOTYPE UNDER MOISTURE STRESS
M. ASALATHA, P. V. REDDY AND RAMAN A RAO, D. V.
Regional Agriculture Research Station, Timpati-517 507, A.P. Received on 18 Nov., 1998, Revised on 24 July, 1999
SUMMARY
The relationship of specific leaf area and carbon isotope discrimination with dry matter production and partitioning in groundnut was studied under adequately irrigated and simulated drought treatments. The study was conducted utilising twenty selected groundnut genotypes differing in their transpiration efficiency and was repeated with seven selected genotypes in the second season. Specific leaf area (SLA) and carbon isotope discrimination (CID) exhibited significant positive relationship indicating that specific leaf area can be utilised as a surrogate to CID. Specific leaf area was negatively related with transpiration efficiency, while it was positively related with partitioning suggesting that selection for low SLA might result in production of more dry matter with minimal influence on pod weight.
Key words: Carbon isotope discrimination, dry matter, groundnut, specific leaf area.
INTRODUCTION
Carbon isotope discrimination (CID) \vas show11 to be strongly related to transpiration use efficiency in groundnut genotypes (Hubick et a!.. 1986: Nageswara Rao eta!., 1993; Wright eta!., 1988). Specific leaf area (SLA), an easily measurable trait, v-.·as identified as a surrogate trait to carbon isotope discrimination· in groundnut (N ageswara Rao and Wright I 994: N ageswara Rao etal., 1995). Field studies examining the relationships of these traits with other yield contributing factors are necessary to utilise these traits for developing moisture stress tolerant cultivars. A positive association between SLA and HI reported by earlier studies (Wright et a!., 1988; 1993) suggests that selection for low SLA might result in production of more TOM than pod yield.
MATERIALS AND METHODS
The field experiments were conducted at the dry land fann of the Regional Agricultural Research Station,
lndianJ. Plant Physiol., Vol. 4, No.3, (N.S.) pp. 161-166 (July-Sept., 1999)
Timpati, A.P. ( 13
°
N latitude, 79° E longitude and altitude of 182.9M from MSL), during the rainy seasons of 1993 and 1994. The soils of the experimental field were typical red sandy loams, low in organic carbon, low to mediurr in available phosphoms, medium to low in available potassium with slightly acidic soil reaction. The water holding capacity of the soils was low with PWP of 5% and FC of 12-14%. Twenty selected groundnut genotypes differing in their water use efficiency were utilised for the study in 1993, and seven among these genotypes \vere used for the 1 994 experiment. The number of genotypes were reduced in the 1994 due to inclusion of moisture depletion studies which required larger plot size and the limitation of space in rain out shelters. Each genotype was grovm under two-moisture regimes i.e. irrigated (T1) andsimulated drought (T2) utilising rain out shelters. The
experiment was replicated thrice with irrigation regimes as main treatments and genotypes as sub treatments with a split plot design. In the irrigated treatment (T) irrigation was given once in four days by replacing 80% of
M. ASALATHA eta/.
cumulative pan evaporation (CPE) taking into account the rainfall received during the period. In simulated drought (T
2) moisture stress imposed between 40 and 80
days after sowing (DAS) by replacing 25% of the CPE once in four days. During the rest of the crop growth period T~ received normal irrigation like that ofT1. Each
genotype was planted in three rows of 4m length with 30 em row spacing and 10 em intra-row spacing. Sampling
for specific leaf area was done at 40, 70 and 90 DAS utilising the Jrd or 4111 leaf from the tip on the main axis as
per Rao et al. (1995). The samples from the 70 DAS sampling were utilised for analyses of carbon isotope discrimination. Samples '"ere dried, powdered and sieved through a l 00 11m sieve and analysed for CID at the Research school of Biological sciences, Canberra, Australia as described by Hubick et a!., (1986).
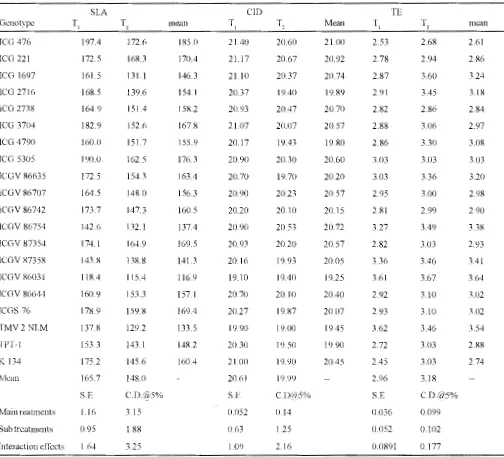
TABLE I : Specific leaf area ( cnr2g.·1
), carbon isotope discrimination and transpiration efficiency (glkg·1) of different groundnut genotypes
as int1uenced by irrigation treatments ( 1993 ).
Genotype
ICG 476
ICG 221
ICG 1697
ICG 2716
iCG 2738
ICG 3704
ICG 4790
ICG 5305
ICGV 86635
iCGV 86707
iCGV 86742
ICGV 86754
!CGV 87354
ICGV 87358
ICGV 86031
ICGV 86644
ICGS 76
TMV2 NLM
TPT-1
K 134
Mean SLA 197.4 172.5 161.5 168.5 164.9 182.9 160.0 190.0 172.5 164.5 173.7 142.6 174.1 143.8 118.4 160.9 178.9 137.8 153.3 175.2 165.7 S.E
]\-fain reatments I .16
Subtreatments 0.95
Interaction effects I .64
162 172.6 168.3 13l.l 139.6 151.4 152.6 151.7 162.5 154.3 148.0 147.3 132.1 164.9 138.8 115.4 153.3 159.8 129.2 143.1 145.6 148.0 3.15 1.88 3.25 mean
185 ()
170.4 146.3 154.1 158.2 167.8 155.9 176.3 163.4 156.3 160.5 137.4 169.5 141.3 116.9 157.1 169.4 133.5 148.2 160.4 CID 21.40 2l.l7 2l.l0 20.37 20.93 21.07 20.17 20.90 20.70 20.90 20.20 20.90 20.93 20.16 19.10 20.70 20.27 19.90 20.30 21.00 20.61 S.1·: 0.052 0.63 1.09 20.60 20.67 20.37 19.40 20.47 20.()7 19.43 20.30 19.70 20.23 20.10 20.53 20.20 19.93 19.40 20.10 19.87 19.00 19.50 19.90 19.99 0.14 1.25 2.16 Mean 21.00 20.92 20.74 19.89 20.70 20.57 19.80 20.60 20.20 20.57 20.15 20.72 20.57 20.05 19.25 20.40 20.07 19.45 19.90 20.45 2.53 2.78 2.87 2.91 2.82 2.88 2.8ti 3.03 3.03 2.95 2.81 3.27 2.82 3.36 3.61 2.92 2.93 3.62 2.72 2.45 2.96 S.E TE 0.036 0.052 0.0891 2.68 2.94 3.60 3.45 2.8ti 3.0ti 3.30 3.03 3.36 3.00 2.99 3.49 3 03 3.46 3.67 3.10 3.10 3.46 3.03 3.03 3.18 CD(ri\5% 0.099 0.102 0.177 mean 2.61 2.86 3.24 3.18 2.84 2.97 3 08 3.03 3.20 2.98 2.90 3.38 2.93 3.41 3.64
3 02 3 02
3.54
2.88
2.74
Transpiration efficacy (TE) was estimated as per Wright
et al., (1995) utilising the SLA values recorded in the study. The procedure involves the following steps for estimating the transpiration efficiency.
l) TE - K/(ei-ea) where K is the constant of proportionality and (ei-ea) the vapour pressure deficit (VPD).
2) K = 1.44-0.53
(.M
being the relationship ofK with actually measured Ll, where Ll is the carbon isotope discrimination.3) Ll = 0.03 (SLS) + 14.0 being the relationship of Ll
with actual SLA values.
RESULTS AND DISCUSSION
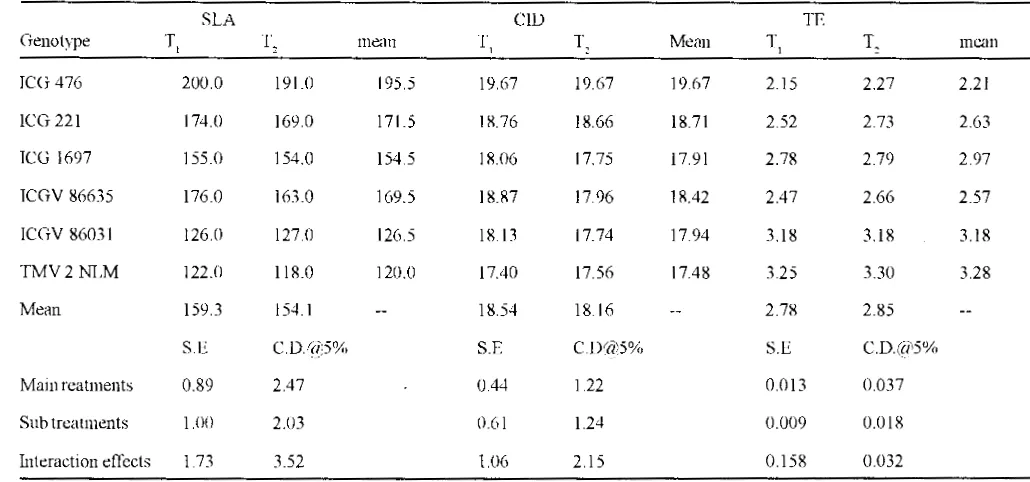
Specific leaf area and carbon isotope discrimination values >vere higher and transpiration efficiency lower under adequately irrigated treatment (T) compared to simulated drought treatment (T) in both the years of study (Tables I and II). Specific leaf area varied from
116.9to 195.5 cm·2g., amongthegenotypestested. whereas
the transpiration efficiency ranged from 2.21 to 3.64 g. kg·1 . Irrespective of the irrigation treatment ICGV 86031
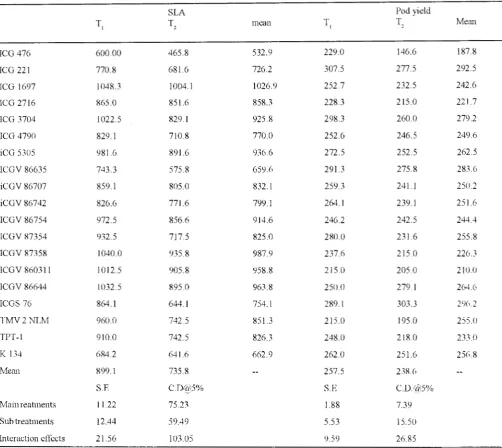
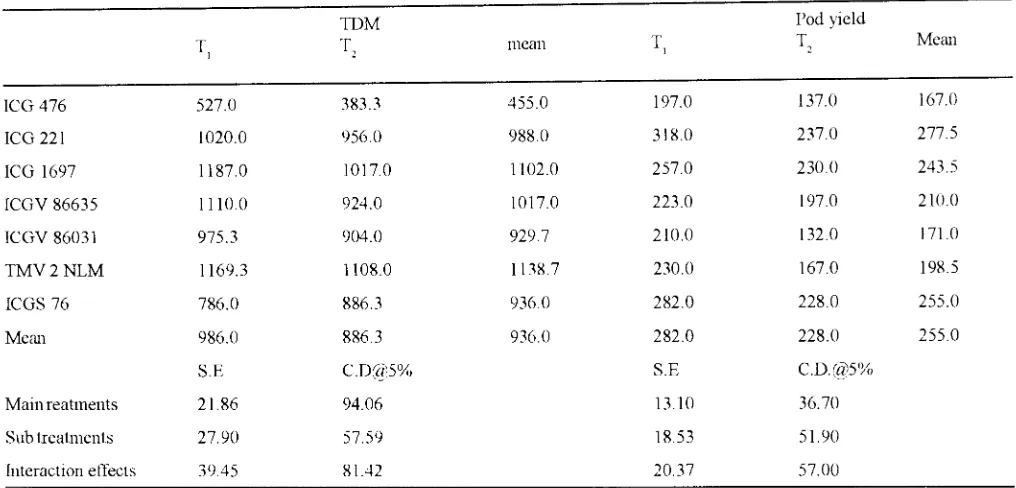
and TMV2NLM had lower SLA, CID values and higher TE compared to the ICG476. The TE of these genotypes was higher by 27 to 32% compared to ICG 476. The total dry matter production and pod yield were higher under T 1 compared to T 2. The groundnut genotypes tested exhibited
large variation in total dry matter production ( 455 to 1102 g. m·2
) and pod yield (167.0 to 292.5 g.m-2) The specific
leaf area of the genotypes (Fig. 1) had a significant positive relationship with CID under both T1 and T2• SLA
exhibited a strong negative relationship with TOM (Fig. 2) under T1 and T2. However, SLA had a significant
positive relationship with pod yield under only T1• In T 2
the relationship, though positive, was non significant.
In groundnut many studies have shown negative relationship of CID with TE and TDM (Hubick et a!., 1986, 1988: Hubick 1990: Wright eta!., 1988, 1994). Subsequently it was shown that specific leaf area, an easily measurable trait has a strong positive relationship with CID and can serve as a surrogate to the CID \Vhich
TABLE II : Specific leaf area ( cm'g·' ), carbon isotope discrimination and transpiration efficiency ( glkg·') in groundnut genotvpes as affected by irrigation treatments ( 1994 ).
SLA CID TE
Genotype T, T. mean T, T. Mean T l T. mean
ICG 476 200.0 191.0 195.5 19.67 19.67 19.67 2.15 2.27 2.21
ICG 221 174.0 169.0 171.5 1R.76 1R.66 18.71 2.52 2.73 2.63
ICG 1697 155.0 154.0 154.5 18J)6 17.75 17.91 2.78 2.79 2.97
ICGV 86635 176.0 163.0 169.5 1R.87 17.96 18.42 2.47 2.66 2.57
ICGV 86031 126 () 127.0 126.5 18.13 17.74 17.94 3.18 3.18 3.18
TMV2NLM 122.0 118.0 120.0 17.40 17.56 17.48 3.25 330 3.28
Mean 159.3 154.1 18.54 18.16 2.78 2.85
S.E CDI{/15% S.E CDI{/15%, S.E C.D.(Zi>5%
Mainreatments 0.89 2.47 0.44 1.22 0.013 0.037
Sub treatments 1.00 2.03 0.61 1.24 0.009 0.018
Interaction effects 1.73 3.52 1.06 2.15 0.158
o.cm
M. ASALATHA eta/.
TABLE III: Total dry matter production and pod yield (g. m') of groundnut genotypes as aflected by irrigation treatments ( 1993). SLA
T, T,
ICG 476 600.00 465.8
ICG 221 770.8 681.6
ICG 1697 1048.3 1004.1
ICG 2716 865.0 851.6
ICG 3704 1022.5 829.1
ICG 4790 829.1 710.8
iCG 5305 981.6 891.6
1CGV 86635 743.3 575.8
iCGV 86707 859.1 805 ()
iCGV86742 826.6 771.6
ICGV 86754 972.5 856.6
ICGV 87354 932.5 717.5
ICGV 87358 1040.0 935.8
ICGV 860311 1012.5 905.8
ICGV 86644 1032.5 895.0
ICGS 76 864.1 644.1
TMV2NLM 960.0 742.5
TPT-1 910.0 742.5
K 13--t 684.2 641.6
Mean 899.1 735.8
S.E C.DI(/:5%
Main reatments 11.22 75.23
Sub treatments 12.44 59.49
Interaction etTects 21.56 103.05
requires the use of mass spectrometer. (Nageswara Rao and Wright 1994; NageswaraRaoetal., 1995). Nageswara Rao and Wright ( 1994) have observed consistent relationship (negative) between CID and SLA across locations and genotypes in groundnut. The negative relationship between CID and TDM is due· to the differences in photosynthetic capacity of genotype. This was in turn supported by their observation on the specific leaf nitrogen, which was negatively correlated with CID.
164
Pod yield
mean T, T, Mem1
532.9 229.0 146.6 187.8
726.2 307.5 277.5 292.5
1026.9 252.7 232.5 242.6
858.3 228.3 215.0 221.7
925.8 298.3 260.0 279.2
770.0 252.6 246.5 249.6
936.6 272.5 252.5 262.5
659.6 291.3 275.8 283.6
832.1 259.3 241.1 250.2
799.1 264.1 239.1 251.6
914.6 246.2 242.5 2444
825.0 280.0 231.6 255.8
987.9 237.6 215.0 226.3
958.8 215 () 205.0 210.0
963.8 250.0 279.1 264 (,
754. I 289.1 303.3 2'.!6.2
85!.3 215.0 195.0 255.0
826.3 248.0 218.0 233.0
662.9 2fi2.0 251.6 250.8
257.5 238.6
S.E C.D.@5%
188 7.39
5.53 15.50
9.59 26.85
Most of the variation in CID in groundnut genotypes was ascribed to variation in Rubisco (Nages,vara Rao eta!, 1995). A decline in Rubisco and the photosynthetic activity has been shown with leaf age (Evans, 1996: Cmmor et a!., 1993). Hence the position of leaf for analyses of CID or SLA is important. The present study that utilised a large number of genotypes confirms these results. There was significant positive relationship bet\\een SLA and CID, and negative association between SLA and
TABLE IV : Total dry matter production and pod vield (g. m') in groundnut gcnotvpes as affected by irrigation treatments (1994 ).
TDM
T, T,
ICG 476 527.0 383.3
ICG 221 1020.0 956.0
ICG 1697 1187.0 1017.0
ICGV 86635 1110.0 924.0
ICGV 86031 975.3 904.0
TMV2NLM 1169.3 1108.0
ICGS 76 786.0 886.3
Mem1 986.0 886.3
S.E C.D@5%
Mainreatments 21.86 94.06
Sub treatments 27.90 57.59
Interaction etTects 39.45 81.42
TOM (Figs. 1, 2). I is evident from the present study that it is possible to identify genotypes with high TE by screening for SLA. The positive relationship of SLA with pod yields in T1 and positive trend of relationship in T::. though non-significant pose problems in breeding for genotypes with high TE and high pod yield. Positive relationship of SLA with pod yield means that the genotypes \vith lmv SLA are poor in partitioning. Such observations have been reported by other \Yorkers in
22~~~---,
~
218
2019
•
18 L _ _ _ _ _ _ _ _ _ _ _ _ _ _ _ _ j
100 150 200 250
SLA(cm-21g.)
20 r - - - ,
§ 19 T2("94) ~
18 ~·
17L---~ 100 120 140 ~60 180 200 220
SLA1cm-2/g)
Fig. 1. Relationship between SLA and CID (,'\ x 10') in groundnut nenotypes under adequately irrigated and simulated
drought treatments.
IndianJ. Plant Physiol., Vol. 4, No.3, (N.S.) pp. 161-166 (July-Sept., 1999)
Pod yield
mean T, T, Mean
455.0 197.0 137.0 167.0
988.0 318.0 237.0 277.5
1102.0 257.0 230.0 243.5
1017.0 223.0 197.0 210 0
929.7 210.0 132 () 171.0
1138.7 230.0 167.0 198.5
936.0 282.0 228.0 255.0
936.0 282.0 228.0 255.0
S.E C.D.@5%
1310 36.70
18.53 51.90
20.37 57.00
groundnut (Wright eta/., 1988: 1993). Development of low partitioning lines will have a yield cost particularly when droughts do not occur. However. in some of the screening studies conducted at this station genotypes like TAG 24. TG26 and TCGS 320 were identified as possessing moderately high levels of TE with good partitioning. In a recent study on the genetic analyses of these trials Jayalakshmi eta!., ( 1998) have observed no significant relationship between TE and pod yield in F-3
1000
N
t
~ 800~
.. ..
T1 ('93J
600 ~---~
-;oo 150 20C
1100
120 140 160 200 SLA (crn-2. g.)
Fig. 2.Relationship between SLA and TDM in groundnut genotypes under adequately irrigated and simulated droughts.
M. ASALATHA et a/.
material indicating the possibility for concurrent improvement of both the traits.
ACKNOWLEDGEMENTS
The authors acknowledge the financial support from the ACIAR-ICRSAT-ICAR Collaborators.
REFERENCES
Cmmor, D.J. HalL A.J. and Sadras, V.O. (1993) Efect of nitrogen content on the photosynthetic characteristics of suntlower leaves. Aust. J. Plant Physiol. 20. 251-263.
Evans, J.R. (1986). The relationship between the carbon-dioxide limited photosynthetic rate and ribulose- I, 5-biposphate-carboxylase content in two nuclear-cytoplasm substitution lines of-wheat, and the co-ordination ofribulose-biphosphate-corboxylalation and electron transport capacities. Plcmta. 167 • 351-358.
Hubick, K. T. ( 1990 ). Effects of nitronge source and water limitation on growth, transpiration ct11ciency and carbon-isotope dicrimination in peanut cultivars. Aust. J. Plant Physiol., 17: 413-430.
Hubick, K.T., Farquhar, G.D. and Shorter, R. ( !986 ). Correlation between water-usc ctliciency and carbon discrimination in diversepeanut(A.rachis) gennplasm. :iust.J. Plant phy5iol., 13 • 803-816.
Hubick,K.T. Shorter, R. and Farquhar, G.D. ( 1988). Heritability and genotvpe x environment interactions of carbon isotope
166
discrimination and transpiration etiiciencv in peanut (.-lrachis
h1pogaca L.) Aust. J. !'/ant physiol .. 15 • 799-813.
Nagcswara Rao, R.C.. Williams, J.H., Wadia, K.D R. llubick, K.T and Farquhar. G.D. ( 1993 ). Crop gro\\1h, water u~e efficiencY and carbon isotope discrimination in groundnut r.-lrachis h}pogaea L.) genotypesunderendofscason drought conditions.
Ann. Appl. Bioi., 122 • 357-367.
Nageswara Rao, R.C. and Wright, G.C. ( 1994 ). Stabilitv of the
r~lationship between specific leaf area and carbon isotope discrimination across cnviromnents in peanut. Crop. Sci .. 3~ ·
98-103.
Neges\vara, Rao, R.C., Udaya Kumar, M., Farquhar, G.D .. Talwar. H.S. and Prasad, T.G. (I 9SJ5). Variation in carbon isotope discrimination and its relationship to specific leaf area and ribulose- I, 5-photosphate carboxilase content in groundnut genotwes. Aust . .!. Plant Physiol.. 22 • 545-5 l.
Wright, G. C., Hubick, K. T. and Farquhar, G.D. ( 1988 ). Discrimination in carbon isotopes in leaves correlates with water use etliciencv offieldgr0\\11 peanut cullivars .. ·Just. J. Plant Plrvsiol .. 15 • 815-25.
Wright, G.C.,NegaswaraRao,R.C. andFarqulwr,GD. ( 1994 ). Water use etliciencv and carbon isotope discrimination in peanut water deficit conditions. Crop. Sci., 3~ . 92-97.
Wright, G.C. Nageswara Rao, R.C. and l3asu, M.S. (1995) A
phvsiological approach tor the understanding of genot:vve x environment interactions - a case study on improvement of drought in groundnut. In • M Cooper and G.L. Hammer ( eds)" Crop Adaptation and Improvement" CAB Jntemational pp. 365-382.