PERFORMANCE ANALYSIS OF
WAVELET THRESHOLDING
METHODS IN DENOISING OF AUDIO
SIGNALS OF SOME INDIAN MUSICAL
INSTRUMENTS
NEEMA VERMA
Electronics and Communication Engg. Department Hindustan Institute of Technology and Management
Keetham, Agra, UP, India [email protected]
A. K. VERMA
Electrical Engineering Department Faculty of Engg., Dayalbagh Educational Institute
Dayalbagh, Agra, UP, India [email protected]
Abstract:
It is known that signals obtained from the real world environment are corrupted by the noise. This noise causes poor performance of the relevant system and therefore must be removed effectively before further processing of signal. Research in the area of wavelets showed that wavelet shrinkage method performs well and efficiently as compared to other methods of denoising. In this paper, a comparative analysis of the performance of various wavelet coefficients thresholding methods in denoising of audio signals of various Indian musical instruments is presented. For thresholding of the wavelet coefficients, performance of some well-known thresholding methods i.e. Minimax, SURE (Heuristic and Rigorous) and Square-Root-Log are investigated in the presence of white Gaussian noise. The effect of wavelet decomposition levels is also investigated. For wavelet decomposition, Coif5 wavelet is used. The quality of denoised speech signal is expressed in terms of Peak Signal to Noise Ratio (PSNR) as compared to original noiseless speech signal.
Keywords: Wavelets; Coif5; Minimax; Heursure; Rigrsure; Sqtwolog; Level of Decomposition.
1. Introduction
Signal processing suffers with a major problem of distortions created by noise. A noise is an unwanted signal which deteriorates the characteristics of original signal. There are various types of noises present in environment such as colored noise, burst noise, White noise etc. Therefore, noise signal may occupy either some specific frequency band or entire frequency band. When noise also share the frequency band of signal, then it becomes very difficult to remove this noise without losing some signal information. Therefore, noise removal without losing original features of signal is a challenging task and has become an active area of research.
thresholding is given in [1]. It suggests that non-linear wavelet coefficients shrinkage of high frequency components performs well over conventional frequency selective filter approach. The threshold values for correlated noise signals are calculated by a method proposed by Johnston and Silverman [2].A modified threshold selection method is reported in [3]. It suggests that high threshold values for audio signals cuts part of the original signal too. Therefore, to maintain high quality output signal the threshold values are multiplied by a factor ranging 0 and 1. Another method which improves SNR of a signal in presence of transients and harmonics utilizing block thresholding is proposed in [4]. Further to preserve transients and element wise thresholding, an optimal block size and thresholding level is given in [5] using complex wavelets. The gain factor of linear filter system and non-linear energy operator with soft thresholding in wavelet domain is demonstrated in [6] for song retrieval system. The algorithm reduces White Gaussian noise in audio samples and presents enhanced version of accurate songs retrieval system. An alternative method of denoising musical signals is implemented in [7]. In this system the windowed signal is first decomposed and lowest entropy tree is selected. The wavelet coefficients representing non-coherent parts of signal are then suppressed to remove noise. A comparative analysis of three methods based on subtractive technique is given in [8]. It suggests an effective method based on perceptual wavelet transform. A novel approach in audio denoising is presented in [9] by grouping signal blocks together. These blocks are then filtered and replaced in their original positions. The blocks overlap each other and therefore, detail estimation of every element is obtained. In transformation procedure noise is removed and signal is further reconstructed with the application of Haar wavelet transform. It gives good denoising performance both in terms of PSNR and audible quality of the audio signal.
The rest of the paper is organized as follows, section II gives brief introduction to wavelet transform analysis, section III describes denoising schemes, section IV displays the experimental results, section V represents the conclusion and references are given in section VI.
2. Discrete Wavelet Transform
The Wavelet Transform (WT) is a mathematical tool useful in the analysis of signals. Its representation involves the decomposition of the signals in wavelet basis functions given by,
, √ , ∈ (1)
Here , are called scale and position parameters respectively. If scales and positions are chosen based on powers of two, so-called Dyadic scales and positions, then analysis becomes much more efficient and just as accurate. It was developed in 1988 by S. Mallat. In this case, wavelet function becomes,
, 2 2 , ∈ (2)
in orthonormal basis for .For a given function , the inner product 〈 , , 〉 then gives the discrete wavelet transform as, [10]
, 〈 , , 〉 2 ∑∞ ∞ . ∗ 2 (3)
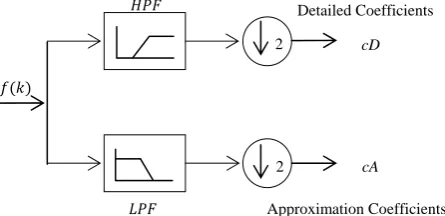
The multi resolution theory given by S. Mallat and Meyer proves that any conjugate mirror filter characterizes a wavelet that generates an orthonormal basis of , and that a fast discrete wavelet transform is implemented by cascading these conjugate mirror filters. The wavelet decomposition of a signal based on the multi resolution theory can be obtained using digital FIR filters [11]. The FIR filter based wavelet decomposition scheme is shown as shown in figure 1.
Fig. 1: One level wavelet decomposition (Analysis) cD
cA 2
2
Detailed Coefficients
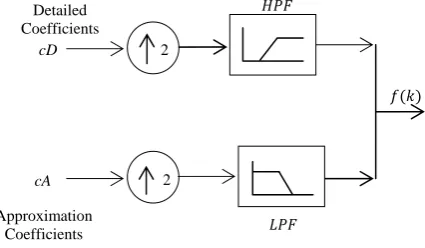
The arrangement shown above has used two wavelet decomposition (Analysis) filters which are High Pass and Low Pass respectively followed by down sampling by 2 producing half of input data point of High and Low frequency. The High frequency coefficients are called Detailed Coefficients (cD) and Low frequency coefficients are called Approximation Coefficients (cA). After decomposition, the signal can be reconstructed back by Inverse Wavelet Transform. The corresponding Filter Bank structure for reconstruction is shown in figure 2.
Fig. 2: One level wavelet reconstruction (Synthesis)
The signal can be decomposed in several levels. A three level wavelet decomposition tree is shown in figure 3 [12].
Fig. 3: Three level wavelet decomposition tree
3. Wavelet Denoising Schemes
To prevent deterioration in quality of instrumental signals, denoising of the signal is required. Let assume an instrumental signal is corrupted by the noise as , where is White
Gaussian Noise. White Gaussian noise is difficult to remove as it is located at all frequencies. The wavelet based
overall denoising scheme is shown in figure 4.
Fig. 4: Overall Denoising Scheme
As seen from figure 4, the denoising scheme involves three main steps,
1. L-level Wavelet Decomposition of input noisy signal.
2. Threshold estimation and thresholding of wavelet coefficients.
3. L-level Inverse Wavelet Transform for reconstruction of denoised signal.
Wavelet denoising involves thresholding in which coefficients below a specific threshold value are set to zero. It helps in eliminating noise but main characteristics of the original signal are preserved. This is called Hard Thresholding while Soft-Thresholding set the wavelet coefficients to zero which are below threshold as well as it simply shrinks or scales other coefficients which are above the threshold value [1]. Threshold selection is an important process which directly affects the quality of output denoised signal. There are several well-known threshold estimation methods available in literature. Some of them are discussed here briefly. In this
L- Level DWT
Wavelet Coeff. Thresholding
L - Level IDWT Noisy
Signal
Denoised Signal f
cD1
cA1
cA2 cD2
cA3 cD3 cD
cA
2
2 Detailed
Coefficients
paper, performances of four well-known standard threshold estimation methods are investigated for audio signals of Indian musical instruments corrupted by white Gaussian Noise. The effect of wavelet decomposition level (L) is also investigated. These four methods are briefly described as follows:
3.1Minimax Criterion: This method finds threshold using Minimax principle. It uses a fixed threshold to yield Minimax performance for mean square error against an ideal procedure. The Minimax principle is used in statistics to design estimators. Since the de-noised signal can be assimilated to the estimator of the unknown regression function, the Minimax estimator is the option that realizes the minimum, over a given set of functions of the maximum Mean Square Error (MSE). This procedure finds optimal thresholds [13]. The threshold is given by:
λ 0.3936 0.1829 32
0 32 (4)
Where .| | and is the wavelet coefficient vector at unit scale and is the length of signal vector.
3.2 Sqtwolog Criterion: The threshold values ( ) are calculated by universal threshold (square root log) method given by,
2 (5)
Where, is the length of the noisy signal at scale and is Median Absolute Deviation (MAD) at scale given by,
.
| |
. (6)
Where, represent wavelet coefficients at scale .
3.3 Rigrsure: It is a soft threshold evaluator of unbiased risk. Suppose , , … … . . , is a vector consists of the square of wavelet coefficients from small to large. Select the minimum value (bth ) from risk vector, which is given as,
, ,………
∑
(7)
as the risk value. The selected threshold is where, is the bth squared wavelet coefficient (coefficient at minimum risk) chosen from the vector and σ is the standard deviation of the noisy signal.
3.4 Heursure: Threshold is selected using a combination of Sqtwolog and Rigrsure methods. If the signal to noise ratio is very small, the SURE method’s estimation is poor. In such case, fixed form threshold of Sqtwolog method gives better threshold estimation [13]. Let threshold obtained from Sqtwolog method is and threshold obtained from Rigrsure is then Heuristic SURE gives the threshold given by,
λ min , (8)
Where, and log / √ .The is length of wavelet coefficient vector and is the sum of squared wavelet coefficients given as ∑ .
Threshold determination is an important problem. A small threshold may yield a result which may be noisy and large threshold can cut significant part of signal thus losing the important details of the signal.
4. Experimental Results
performance of various methods, the effect of decomposition level is also investigated. For comparison and measurement of quality of denoising, the Peak Signal to Noise Ratio (PSNR) is calculated between original musical signal and denoised musical signal given by,
10 (9)
Where, is maximum value of signal and is given by,
, (10)
And MSE is mean Square Error given by,
∑ (11)
The part of original sound wave (noise free) of musical instrument Dholak, its noisy version, corrupted by white Gaussian noise, and denoised wave using Heursure method at level 3 are shown in figure 5.
(a)
(b)
(c)
Fig. 5: (a) Original noise free signal of Dholak, (b) Signal corrupted by white Gaussian noise, (c) Denoised signal using Heursure at L=2
PSNR values for various musical signals are shown comparatively in table1 to 4.
Table 1: Comparison of PSNR (dB) at level 2 decomposition
Methods Dholak Ghanta Flute Harmonium Shehnai Minimaxi 43.831 37.991 38.241 33.529 33.389 Rigrsure 43.846 39.615 38.238 38.672 38.184 Heursure 43.824 39.661 38.241 38.672 38.323 Sqtwolog 43.822 37.382 38.241 32.506 32.429
Table 2: Comparison of PSNR (dB) at level 3 decomposition
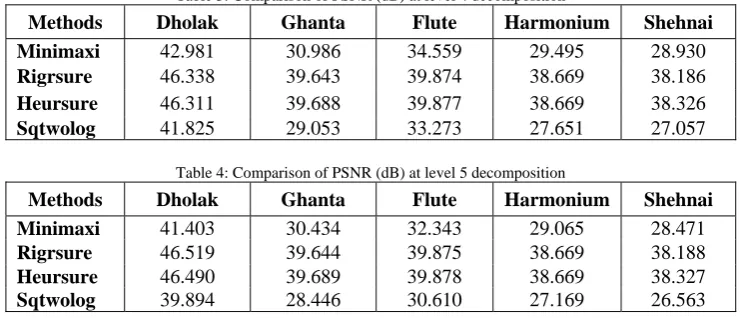
Table 3: Comparison of PSNR (dB) at level 4 decomposition
Methods Dholak Ghanta Flute Harmonium Shehnai Minimaxi 42.981 30.986 34.559 29.495 28.930 Rigrsure 46.338 39.643 39.874 38.669 38.186 Heursure 46.311 39.688 39.877 38.669 38.326 Sqtwolog 41.825 29.053 33.273 27.651 27.057
Table 4: Comparison of PSNR (dB) at level 5 decomposition
Methods Dholak Ghanta Flute Harmonium Shehnai Minimaxi 41.403 30.434 32.343 29.065 28.471 Rigrsure 46.519 39.644 39.875 38.669 38.188 Heursure 46.490 39.689 39.878 38.669 38.327 Sqtwolog 39.894 28.446 30.610 27.169 26.563
5. Conclusions
In this paper, performance of various standard thresholding methods viz. Minimaxi, Sqtwolog, Rigrsure and Heursure is presented for denoising of audio signals of some Indian musical instruments such as Dholak, Ghanta, Flute, Harmonium and Shehnai corrupted by white Gaussian noise. The effect of various levels of decomposition is investigated on the performance of various thresholding estimation methods. The results show that as level of decomposition increases from 2 to 3, the value of PSNR decreases in case of Minimaxi and Sqtwolog methods for Ghanta, Harmonium and Shehnai while PSNR increases for Dholak and Flute and PSNR values for all the musical instruments decreases for Minimaxi and Sqtwolog methods when going from level 3 to 5. In Rigrsure and Heursure methods, PSNR value increases for higher level of decompositions for all musical instruments. But at higher levels these methods have very minor variations. Thus lower levels of decomposition can be preferred for these methods. Also Heursure and Rigrsure methods have shown better performance as compared to Minimaxi and Sqtwolog thresholding methods in case of all decomposition levels. Overall from the results, it is clear that Heursure method of thresholding gives best PSNR values and gives minimum distortion as compared with other thresholding methods for audio signal denoising of selected Indian musical instruments.
References
[1] Donoho D. L., Johnston I.M., (1995): De-Noising by Soft Thresholding, IEEE Transaction on Information Theory, Vol. 41(3), pp. 613-627.
[2] Johnston I. M., Silverman B. W., (1997): Wavelet Threshold Estimators for Data with Correlated Noise, Journal of Royal Statistical Society, Series B 59, pp 319–351.
[3] MatkoSaric, LukiBilicic, HrvojeDujmic, (2005): White Noise Reduction of Audio Signal using Wavelets Transform with Modified Universal Threshold, Proceedings of the 4th WSEAS International Conference on Signal Processing Robotics and Automation, World
Scientific, Wisconsin, USA.
[4] Guoshen Yu, StephaneMallat, and Emmanuel Bacry (2008): Audio Denoising by Time-Frequency Block Thresholding, IEEE Transactions on Signal Processing, Vol. 56, No. 5.
[5] Guoshen Yu, Emmanuel Bacry, StephaneMallat (2007): Audio Signal Denoising with Complex Wavelets and Adaptive Block Attenuation, IEEE Transactions, International Conference on Acoustics, Speech, Signal Processing, Volume 3, pp. 869-872.
[6] Nanshan Li, Mingquan Zhou, (2008): Audio Denoising Algorithm based on Adaptive Wavelet Soft-Threshold of Gain Factor and Teager Energy Operator, International Conference on Computer Science And Software Engineering, Volume 01.
[7] AnshulSaxena, Sanjay Kumar, RajeshMeena, (2005): Lecture Notes on the Wavelet Transform in the Processing of Musical Signals the Wavelet Transform in the Processing of Musical Signals,www.ee.iitb.ac.in/pawar/waveletapplications/.
[8] Anis Ben Aichaand Sofia Ben Jebara, (2006): Comparison of Three Methods of Eliminating Musical Tones in Speech Denoising Subtractive Techniques, 13th International Conference on Electronics, Circuits and Systems, pp. 652-655.
[9] B. Jaishankarand K. Duraiswamy, (2012): Audio Denoisingusing Wavelet Transform, International Journal of Advances in Engineering and Technology, ISSN: 2231-1963.
[10] Daubechies Ingrid, (2006): Ten Lectures on Wavelets, 9e, SIAM, ISBN: 780-89871-274-2.
[11] MallatStephane, (2008): A Wavelet Tour of Signal Processing, 3e2008, Academic Press, ISBN 978-01-237-4370-1. [12] MATLAB Toolbox: www.mathworks.in/help/toolbox/wavelet/rn/fo-82676.html
[13] Guang-Yan Wang, Xiao-Qun Zhao, Xia Wang, (2009): Speech Enhancement Based on the Combination of Spectral Subtraction and Wavelet Thresholding, International Conference on Apperceiving Computing and Intelligence Analysis, pp. 136-139.