SOFTWARE EFFORT PREDICTION:
AN EMPIRICAL EVALUATION OF
METHODS TO TREAT MISSING
VALUES WITH RAPIDMINER
®
OLGA FEDOTOVA
Department of Economics, Management and Industrial Engineering, University of Aveiro Campus Universitário de Santiago,
Aveiro, 3810-193, Portugal [email protected]
GLADYS CASTILLO
Department of Mathematics, University of Aveiro
Center for Research and Development in Mathematics and Applications, University of Aveiro, Campus Universitário de Santiago,
Aveiro, 3810-193, Portugal [email protected]
LEONOR TEIXEIRA
Department of Economics, Management and Industrial Engineering, University of Aveiro Governance, Competitiveness and Public Politics (GOVCOPP), University of Aveiro
Institute of Electronics and Telematics Engineering of Aveiro (IEETA) Campus Universitário de Santiago,
Aveiro, 3810-193, Portugal [email protected]
HELENA ALVELOS
Department of Economics, Management and Industrial Engineering, University of Aveiro, Governance, Competitiveness and Public Politics (GOVCOPP), University of Aveiro
Campus Universitário de Santiago, Aveiro, 3810-193, Portugal
Abstract:
Missing values is a common problem in the data analysis in all areas, being software engineering not an exception. Particularly, missing data is a widespread phenomenon observed during the elaboration of effort prediction models (EPMs) required for budget, time and functionalities planning. Current work presents the results of a study carried out on a Portuguese medium-sized software development organization in order to obtain a formal method for EPMs elicitation in development processes. This study focuses on the performance evaluation of several regression-based EPMs induced from data after applying three different methods to treat missing values. Results show that regression imputation offers substantial improvements over traditional techniques (case deletion and mean substitution). All the machine learning methods were implemented in RapidMiner®, one of the leading open-source data mining applications.
Keywords: Software effort prediction; missing values treatment, multiple linear regression.
1. Introduction
Abts et al. (2000)]. From that moment, there were elaborated a lot of models for the effort and cost estimation. Indeed, the diversity of these models reported in the literature can be considered as an indicator of the problem complexity. Nevertheless, there is no unique model that completely satisfies the need for objective, fast and accurate predictions in all circumstances.
The predictive quality of estimates determines the success of the project and helps to avoid the risks related to the cost and schedule overruns. SEP is usually required in the very beginning of the project’s lifecycle, making the task of effort estimation more complex. The ability to deliver the software on time, within the budget, and with the expected functionalities and quality, is a challenge for all software development organizations. Inaccurate estimations in software development industry are one of the most serious causes of software projects failure. Poor estimates are usually caused by the occurrence of missing values in the datasets used to learn the effort prediction models (EPMs) [Myrtveit, Stensrud et al. (2001)].
Missing data is a common problem in the statistical analysis. The causes that generally produce the missing data in the context of the SEP resume to [Myrtveit, Stensrud et al. (2001)]: (i) the high costs and unestablished practices associated to the data collection and reporting; (ii) report of the incorrect data (wild data) that has to be replaced by missing values as those do not make sense; and (iii) absence of respondents report of some variables for some reasons.
This article presents the results of a study carried out on a Portuguese medium-sized software development organization in order to obtain a formal method for the elicitation of EPM for development processes. The study focuses on the performance evaluation of several regression-based EPMs induced from data after applying three techniques to treat missing data: case deletion, mean substitution and regression imputation.
The implementation was carried out using RapidMiner® 5.0 [Rapid-I (2010)], one of the world-wide leading open-source software for data mining. Results show that the regression imputation provides considerable improvements in comparison with traditional techniques, such as case deletion and mean substitution.
The rest of this paper is organized as follows. In Section 2, we summarize the main aspects concerning with the construction of a regression-based EPM and provide a description of the dataset used. In Section 3 we briefly describe several methods to treat missing values and give some details about their implementation in RapidMiner®. In Section 4, we present the results of the conducted experiments with real data aimed at evaluating the performance of the EPMs obtained by the three missing data treatments. Finally, in Section 5 we present our conclusions and propose some future work.
2. Effort Prediction Models
There is no consensus in literature about the effectiveness of one or another SEP method. In spite of a great variety of existing models there are no generally applicable methods that would represent more accurate and precise results than the others for all projects. According to Galorath and Evan [(2006)], the main reasons for the SEP failures are: (i) the lack of or misuse of historical data; (ii) overoptimistic leadership or management; (iii) failure to use the estimate; or (iv) failure to keep the estimate current.
As pointed out in [Jorgensen (2004)], low popularity of EPMs may be explained by the discomfort felt by software development organizations using models that they do not fully understand, together with the lack of substantial evidences that their use produce more accurate estimations than those provided by experts. However, there are several reasons that can lead software companies to implement EPMs [Jorgensen, Kirkeboen et al.]: (i) the good performance shown by them in less predictive environments; (ii) independence from the experts presence and experience; and finally, (iii) satisfaction of the requirements imposed by software process improvement frameworks (e.g. CMMI and SPICE BPG) in order to adopt rationale effort/cost estimation methods that guarantee the software evolution to more advanced capability/maturity level.
There are a great number of techniques used to elicit formal EPMs from databases where the critical information of occurred projects has been gathered over time. Multiple linear regression (MLR) is pointed out as one of the most popular among these techniques.
where X1, X2, …, Xn are regressors; β0 is the intercept parameter; β1, β2, …,βn are the regression coefficients;
and εis the random error component.
The dataset used to elicit the EPMs described in this work was collected by the project managers of a Portuguese medium-sized software development organization during the phase of planning and effort estimation of several software projects. Project planning and further monitoring and control is made by means of change set’s management. Change set (CS) is the element of work breakdown structure that is considered to be the work unit grouping a set of requirements. For this reason, project effort and cost estimation is performed in the CS level what provides possibility for more detailed cost and effort control. Information about all closed change sets (prototyped, developed, tested and documented) were added to the dataset. In total, 144 CSs from 5 projects of different sizes were processed. The independent variables used to characterize a CS unit are resumed in the Table 1.
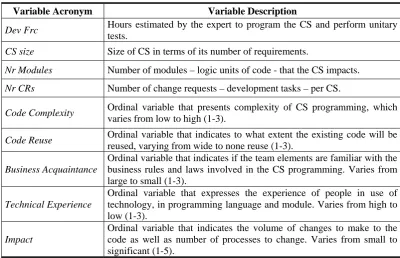
Table 1-Variables Characterization.
Dev Eff is the dependent variable – the response – that we want to predict and represents the effective hours spent on programming CS and unitary tests realization.
3. Methods to Treat Missing Values in RapidMiner®
The knowledge discovery process in databases (KDD) is a process that consists in “the nontrivial extraction of implicit, previously unknown, and potentially useful information from the data” [Frawley, Piatetsky-Shapiro et al. (1992)]. KDD is an interactive and iterative process involving the following steps [Fayyad, Piatetsky-Shapiro
et al. (1996)]: (i) understanding of the application domain and goal(s) identification; (ii) data selection; (iii) data cleaning and pre-processing; (iv) data reduction and projection; (v) modeling (in essence, the selection of data mining algorithm(s) and method(s) used for patterns searching); (vi) evaluation and interpretation; and (vii) decision making based on the discovered knowledge.
Variable Acronym Variable Description
Dev Frc Hours estimated by the expert to program the CS and perform unitary
tests.
CS size Size of CS in terms of its number of requirements.
Nr Modules Number of modules – logic units of code - that the CS impacts.
Nr CRs Number of change requests – development tasks – per CS.
Code Complexity Ordinal variable that presents complexity of CS programming, which
varies from low to high (1-3).
Code Reuse Ordinal variable that indicates to what extent the existing code will be
reused, varying from wide to none reuse (1-3).
Business Acquaintance
Ordinal variable that indicates if the team elements are familiar with the business rules and laws involved in the CS programming. Varies from large to small (1-3).
Technical Experience
Ordinal variable that expresses the experience of people in use of technology, in programming language and module. Varies from high to low (1-3).
Impact
Fig. 1 - A RapidMiner® Process Graph.
To perform our study we used RapidMiner® 5.0 [Rapid-I (2010)], an open-source application for data mining that combines the power of development environments with the simplicity of visual programming. KDD processes in RapidMiner® are implemented through more than 500 nestable operators (for input/output, pre-processing, modeling, evaluation, etc.). As depicted in Figure 1, all the operators are combined into a process graph by means of a powerful but intuitive user interface.
In this work we focus on the treatments of missing values in the pre-processing phase. According to Little and Rubin [(2002)], the methods to treat missing data can be categorized into three groups: (i) case/pairwise deletion; (ii) imputation methods: missing values are replaced with estimates derived from applying statistics methods to available data; and (iii) model-based methods: variants of the iterative expectation-maximization algorithm for finding maximum likelihood estimates (MLE) in parametric models from incomplete data.
In practice, the case deletion is the most widely used method due to the simplicity of its implementation, especially for large datasets. However, the deletion of all the instances with missing values can lead to loss of useful information thus introducing some bias in the data. As a result, the induction of EPMs from incomplete/biased database can result in incorrect/biased forecasts. On the other hand, model-based methods suffer from some drawbacks: (i) they are parametric and hence require a model distribution (usually, a multivariate normal distribution is assumed in order to find the MLE of a mean vector and a covariance matrix); and (ii) they are iterative, therefore they can require a higher computational cost than alternative methods.
For the induction of regression-based EPMs we have compared and evaluated case deletion (to serve as baseline) against two imputation methods: mean substitution and regression imputation. We now briefly describe how these three methods can been implemented in RapidMiner®.
3.1. Case/pairwise deletion
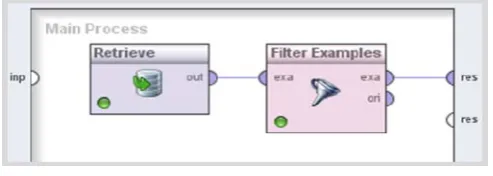
RapidMiner® enables the deletion of all examples with missing values by means of the Filter Examples
operator. This operator takes a dataset as input and returns a new dataset that contains only the examples that fulfill a certain condition (Figure 2).
Fig. 2 - Database filtering in RapidMiner®.
pre-selecting the attribute_value filter and writing the condition (a parameter string with the form attribute op value, where op is a binary logical operator).
Fig. 3 - Filter Examples: parameters. Fig. 4 - Filter Examples: attribute value filter.
3.2. Case/pairwise deletion
Imputation is the process of filling in the missing values of an attribute. The imputation may be carried out using some statistics derived from historical data (average, maximum, minimum, mode, etc.) or pre-defined values. In RapidMiner® we can implement the imputation methods using two operators: Replace Missing Values and
Impute Missing Values.
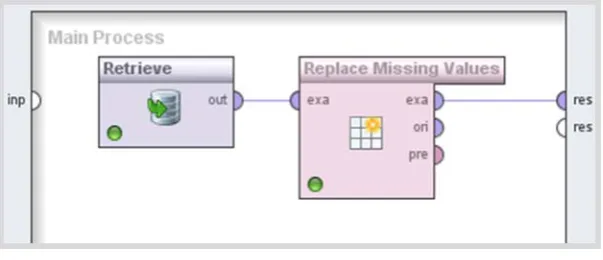
The Replace Missing Values operator (Figure 5) enables the substitution of the missing values by the minimum, maximum or average statistics calculated on the basis of existing values for all or selected attributes. Moreover, we can also replace the missing values by some pre-defined values (e.g. zero or values that we consider that provide better fit to data).
Fig.5 - Missing values replacement in RapidMiner®.
Fig.6 - Missing values estimation in RapidMiner® using MLR as the inner
operator.
Fig.7 - Impute Missing Values operator: parameters.
As depicted in Figure 7, the operator interface allows the user to configure some parameters: (i) attribute filter type – select the attributes for which the missing values will be imputed; (ii) invert selection – invert the selection of the attributes, specified in the attribute filter type; (iii) include special attributes - decide whether it should also include special attributes as ID, for instance; (iv) iterate – impute missing values immediately after having learned the predictive model or in the end of the process; (v) learn on complete cases – define whether to learn predictive models only using complete cases (vi) order – establish the order (chronological, random, number of missing values or information gain) of attributes for which missing values are estimated; (vii) sort – select the direction (ascending or descending) for the order strategy, and finally, (viii) use local random seed.
4. Experimental Study
The main goal of the experimental study was to evaluate the results of several linear regression-based EPMs induced from data after applying the three different methods to treat missing values. We were interested to measure the goodness of fit to data as well as the predictive capability of the induced EPMs. To assess the goodness of fit we used the coefficient of determination R2, that measures the proportional reduction in variability about the mean resulting from the fitting of the multiple regression model [Freund, Wilson et al. (2006); Montgomery, Peck et al. (2006)]. To measure the accuracy of the predicted results, the mean absolute error (MAE) was employed. MAE [Willmott and Matsuura (2005)] expresses the average model-prediction error in units of the variable of interest and is defined as follows:
(2)
where N is the number of examples, υi is the real value of the dependent variable of the i-th example and i
is its respective estimated value.
We applied a bootstrap validation scheme in order to obtain the estimates of the R2 and MAE values. The RapidMiner® operator Linear Regression was used to induce the regression models. This operator implements the well-known least squares algorithm. For embedded feature selection we set the stepwise method. The bootstrap validation method is implemented in RapidMiner® by means of the operator with the same name.
Table 2 - Descriptive statistics of the CS database.
CS size is the attribute with the larger number of missing values – approximately 38%. Moreover, further analysis has revealed that there are 19 cases that have no value at all for most attributes, except Dev Eff and Dev Frc.
4.2. Pre-processing Methodologies
Before the induction of linear regression EPMs, we removed all duplicates from the database, as well as the CSs that have Dev Eff equal to zero. Thus, initial dataset was reduced from 144 to 81 CSs. After that we applied the following methods to treat missing values:
• Case deletion: we removed all examples with missing values using the Filter Examples operator as desribed in Section 3.1. As a result the dataset was reduced to 38 CSs.
• Imputation Methods: First, the examples where most attribute values are missing were excluded from the dataset as they do not bring any useful information for model construction using the operator Filter Examples (see Figure 10). As a result, the original dataset was reduced from 81 to 70 CSs. After that an imputation method was applied.
Mean Substituition: missing values were substituted by the average values (in the case of nominal attributes – by a mode) using the Replace Missing Values operator, as explained in the Section 3.2. Regression Imputation: missing values were substituted by the values predicted by the induced regression models using the Impute Missing Values operator, as explained in the Section 3.2.
Figure 8 illustrates an example of the missing data treatment in RapidMiner®, using regression imputation. Once obtained complete data after applying each method, we used the Detect Outlier operator (see Figure 8) to identify 5 outliers based on the measurement of the euclidian distance to their k (in our case 10) nearest neighbors. As seen in Figure 8, for outlier remotion followed by the exclusion of the Dev Frc variable from the regression analysis, the Filter Examples and Select Attributes operators were applied, respectively.
Since code complexity, code reuse, impact, business acquaintance and technical experience are nominal variables and the regression method works only with numerical ones, to proceed with the analysis in all the three cases we need to transform each nominal variable into a dummy (binary) variable. To this end we included the operators Nominal to Binominal and Nominal to Numerical transformations (see Figure 8).
4.3. Results Analysis
Since the regression models were induced from datasets of different sizes due to diverse missing data treatments, the precision of the R2 metrics is reduced as it requires samples of equal size to produce reliable results. In spite of this, R2 continues to be an informative indicator.
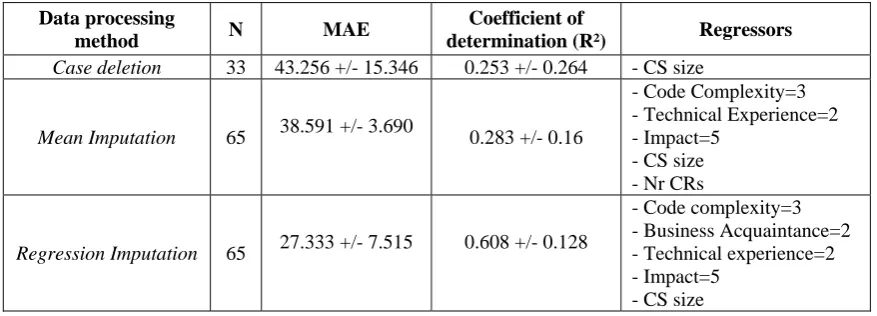
Table 3 resumes the results of the EPMs resulting after applying the three missing values treatments.
Table 3 - Results of the evaluation of EPMs models induced after three missing data treatments.
Data processing
method N MAE
Coefficient of
determination (R²) Regressors
Case deletion 33 43.256 +/- 15.346 0.253 +/- 0.264 - CS size
Mean Imputation 65 38.591 +/- 3.690 0.283 +/- 0.16
- Code Complexity=3 - Technical Experience=2 - Impact=5
- CS size - Nr CRs
Regression Imputation 65 27.333 +/- 7.515 0.608 +/- 0.128
- Code complexity=3 - Business Acquaintance=2 - Technical experience=2 - Impact=5
- CS size
The results of the EPM obtained after applying the case deletion show that the resulting model does not explain the data variation sufficiently, as R2 is equal to 0.253 +/- 0.264. Besides, it has large variation, what does not allow considering the resulting model as a valid one. From the other side, a MAE of 43.256 +/- 15.346 indicates that the obtained model is rather inaccurate. The failure of the EPM obtained with data removal may be explained by the loss of information since the data set was reduced from 81 to 38 CSs.
The EPM resulting from the mean imputation included such variables as code complexity=3, technical experience=2, impact=5, CS size and nr of CRs. The coefficient of determination of the obtained model is 0.283 +/- 0.16. As in the case of the EPM resulting from case deletion this model is not able to explain the sufficient amount of the data variation. The MAE of the model is 38.591 +/- 3.690 and is rather low. This result indicates that, in average, the predictive values for the software development differ from the real ones in approximately 39 hours.
The EPM obtained with regression imputation is based on the code complexity=3, business acquaintance=2,
technical experience=2, impact=5 and CS size variables. The R2 associated to this model is 0.608 +/- 0.128 and the MAE is 27.333 +/- 7.515. These results are the best ones when compared to the previous cases. The resulting model explains approximately 60% of the data variation but still the predicted values differ from the real ones, in average, by approximately 27 hours.
5. Conclusions
Referring to the EPM obtained with the regression imputation, we can state that it has shown a considerable improvement in terms of both, the explicative and predictive capabilities. On the other hand, this approach has the disadvantage that the predicted values are usually better-behaved than the real values and may lead to overoptimistic results which do not correspond to the reality.
For the further study, we are planning to explore other missing values techniques and regression models for the EPM induction in order to investigate their response to different missing values treatments.
References
[1] Anderson, D.R., D.J. Sweeney, and T.A. Williams, eds. Statistics for Business and Economics. 10 ed. ed. 2009, Thomson South-Western.
[2] Boehm, B., C. Abts, and S. Chulani, Software development cost estimation approaches - A survey. Annals of Software Engineering, 2000. 10: p. 177-205.
[3] Fayyad, U., G. Piatetsky-Shapiro, and P. Smyth, From Data Mining to Knowledge Discovery in Databases. AI Magazine, 1996. 17(3): p. 37-54.
[4] Frawley, W.J., G. Piatetsky-Shapiro, and C.J. Matheus, Knowldege Discovery in Databases: An Overview. AI Magazine, 1992. 13(3): p. 57-70.
[5] Freund, R.J., W.J. Wilson, and P. Sa, eds. Regression Analysis: Statistical Modeling of a Response Variable. 2nd ed. ed. 2006, Elsevier.
[6] Galorath, D.D. and M.W. Evan, eds. Software Sizing, Estimation, and Risk Management: When Performance is Measured Performance Improves. 2006, Taylor & Francis Group.
[7] Jorgensen, M., A review of studies on expert estimation of software development effort. The Journal of Systems and Software, 2004. 70: p. 37-60.
[8] Jorgensen, M., et al., Human Judgement in Effort Estimation of Software Projects.
[9] Little, R.J. and D.B. Rubin, eds. Statistical Analysis with Missing Data. 2nd ed. ed. 2002, John Wiley and Sons: New York. [10] Montgomery, D.C., E.A. Peck, and G.G. Vining, Introduction to Linear Regression. 2006: John Wiley & Sons, Inc.
[11] Myrtveit, I., E. Stensrud, and U.H. Olsson, Analyzing Data Sets with Missing Data: An Empirical Evaluation of Imputation Methods and Likelihood-Based Methods. IEEE Transactions on Software Engineering, 2001. 27(11): p. 999-1013.
[12] Rapid-I. 2010; Available from: www.rapid-i.com. Visited at 8/04/2011.
[13] Shepperd, M., C. Schofield, and B. Kitchenham, Effort Estimation Using Analogy, in Paper presented at the International Conference on Software Engineering 1996: Berlin.
[14] Singh, Y., et al., A Review of Studies on Effort Estimation Techniques of Software Development, in Paper presented at the Mathematical Techniques: Emerging Paradigms for Electronics and IT Industries. 2008.