Using social network analysis to measure changes in regional
food systems collaboration: A methodological framework
Libby O. Christensen a *
University of California, Davis
Rita O’Sullivan b
University of North Carolina, Chapel Hill
Submitted October 21, 2014 / Revised February 6 and April 3, 2015 / Accepted April 20, 2015 / Published online June 18, 2015
Citation: Christensen, L. O., & O’Sullivan, R. (2015). Using social network analysis to measure changes in regional food systems collaboration: A methodological framework. Journal of Agriculture, Food Systems, and Community Development, 5(3), 113–129. http://dx.doi.org/10.5304/jafscd.2015.053.013
Copyright © 2015 by New Leaf Associates, Inc.
Abstract
This article presents a methodological approach to studying and evaluating increasingly complex regional food systems. Social network analysis has been used to measure collaborations in health and education and is potentially a tool for regional food systems. The authors demonstrate the
methodological advantages of using social network analysis to track changes in collaboration over time, illustrated through a case study of a multi-tiered, three-year food systems project in North Carolina. There are multiple benefits of using social network analysis; for food systems two of the most useful are its ability to create illuminating visualizations of collaborators, and its ability to use inferential statistics to evaluate significance of changes in food system projects.
Keywords
collaboration; evaluation; local food systems; regional food systems; social network analysis
Introduction
In this article we describe a methodological frame-work, social network analysis (SNA), for analyzing and visualizing collaboration in the food system, and we illustrate the usefulness of this methodol-ogy through a case study in North Carolina. Our use of SNA emerged during a multiyear program
a *Corresponding author: Libby O. Christensen, Department of Human Ecology, University of California, Davis; 1 Shield Avenue; Davis, California 95616 USA;
b Rita O’Sullivan, Evaluation, Assessment & Policy Connec-tions, School of Education, University of North Carolina, Chapel Hill; Peabody Hall; Chapel Hill, North Carolina 27516 USA; [email protected]
Author notes
evaluation of a statewide effort to strengthen local food systems. Focusing on this particular method-ological aspect of the evaluation, we demonstrate the use of social network analysis as an innovative, systematic, and useful analysis tool to understand regional food systems and to support the work of food system organizations.
Social networking analysis (SNA) is a quantita-tively based summary procedure that allows for the systematic description of interactions among indi-viduals, groups, and/or organizations (Carrington, Scott, & Wasserman, 2005). While it has been used since the 1930s in the disciplines of sociology, psy-chology, and anthropology, recently its use has expanded into other disciplines with the growth of computers and software that can handle its com-plex calculations and graphing. The process entails gathering data about the interactions of individuals, groups, and/or organizations and then using this information to describe various aspects of collabo-ration, which are determined by the research ques-tions, including frequency, type, and strength of contacts. Furthermore, geographic information software allows these interactions to be graphed by location.
While the topic of networks is increasingly popular in food system literature, attention has been almost exclusively on producer-consumer and producer-producer interactions.
Producer-consumer networks look at the interactions taking place in markets through economic transactions (Holloway, Kneafsey, Venn, Cox, Dowler, & Tuomainen, 2007; Lockie, 2002; Selfa & Qazi, 2005). These networks are often categorized in terms of conventional versus alternative and strong versus weak (Watts, Ilbery, & Maye, 2005).
Producer-producer networks look at the transfer of knowledge (Hoffman, Lubell, & Hillis, 2011; Starr, 2010; Warner, 2007) and coordination of pro-cessing and marketing efforts (Lev & Stevenson, 2011; Porter, 2000). Further, food is moving from
1 Recognizing that the concept of local or regional food systems is socially constructed and can be controversial (Born & Purcell, 2006; Hinrichs, 2003), it is important for the authors to present our definition before moving forward. For the purposes of this article, we use the definition identified by
the “farm and table” into the classroom, the news-paper, and our front yards. The growing interest in regional food system movement1 can be seen all
around us, from the increased availability of locally produced food products to national conversations about the future of food and agriculture (Bittman, 2012; Smith, 2014). As the movement has grown, so has the complexity in the way that we approach food systems change. We have moved beyond the direct action of individual growers and consumers, toward efforts that are seeking to coordinate a growing number and diversity of actors to have bigger impact both geographically and temporally. What have emerged are polycentric networks of organizations. The organizations do not agree on everything, and yet still collaborate and copromote a shared vision or goal (Starr, 2010). Developing a tool to evaluate whether these organizations are successfully moving toward achieving these goals is the subject of this paper.
Regional food researchers and advocates have been limited in the tools they have to study, ana-lyze, and visualize the different actors and inter-actions taking place. Navigating and distilling key takeaways from the myriad of activities is often a daunting task. Researchers continue to struggle to identify the conditions for success and to measure effective change. Most food system researchers continue to rely on in-depth, time-intensive case studies primarily utilizing surveys, interviews, and observations. These often lack a standardized methodology, which limits replication and does not allow meta-analyses across time and space. Selfa and Qazi (2005) provided an excellent example of this type of nonquantitative analysis. In this article, we share a methodological tool that assists in over-coming these challenges and expands our under-standing of increasingly complex food system networks.
We begin briefly reviewing program evaluation and the role of collaboration in the field. This was
the starting point for our project. We move on to discuss strategies for measuring collaboration and the use of SNA as a strategy to systematize the concept of collaboration. Then we review some of the opportunities and challenges posed by the SNA method. We support this by presenting our case study and demonstrating how the approach is operationalized. We end by emphasizing the signif-icance of our approach for studying regional food systems change and highlighting what we would do differently in the future, acknowledging further questions this approach raises.
Literature Review
Program evaluation is “the systematic assessment of the operation and/or outcomes of a program or policy, compared to a set of explicit or implicit standards as a means of contributing to the improvement of the program or policy” (Tuber-culosis Evaluation Work Group, 2006, p. 4). It is a method that was popularized in the 1960s during the Kennedy and Johnson administrations, when investment in social programs expanded and the impact of those investments was largely unknown. At its core, program evaluation seeks to answer the seemingly simple questions of: Is a program work-ing? and/or How can it be improved? In the realm of food system research, a vocal minority has acknowledged the importance of program evalua-tion to the movement, calling for more attenevalua-tion and resources to be funneled to the area (Feenstra, 2002; Lincoln, Thorp, & Russon, 2003; Webb, Pelletier, Maretzki, & Wilkins, 1998).
While this call has been heeded by some external-funding organizations, particularly the W. K. Kellogg Foundation (WKKF) and the U.S. Department of Agriculture (USDA), both of which require projects to do some form of program eval-uation, recent food system academic literature does not reflect similar commitments. In fact, the con-cept of evaluation has essentially been absent from the food system academic literature since the mid-2000s, with the exception of evaluation of sustain-able food systems education and health programs (Galt, Clark, & Parr, 2012; Lachance et al., 2014; Malone, Harmon, Dyer, Maxwell, & Perillo, 2013). This may be attributed to the fact that academics perceive evaluation as a tool primarily used for
project political survival and continued acquisition of funding (Webb et al., 1998) with little relevance to expanding the body of knowledge. Yet
evaluation lends itself to assessing a program’s longevity or sustainability (Scheirer, 2005).
A key strategy for the sustainability of a pro-gram is the relationships it builds and maintains with other agencies, organizations, and leaders in the community (Frey, Lohmeier, Lee, & Tollefson, 2006; Hogue, 1993; Lachance et al., 2014; Peterson, 1991). This concept, often termed “collaboration,” is frequently an explicitly identified objective both for the program as well as funders. It must be noted, however, that the term collaboration, as cur-rently used in the literature, is not uniform; some-times the definitions of collaboration overlap, while other times they have very distinct meanings. Thus, we use the term “collaboration” from here forward as meaning the cooperative way that two or more entities work together toward a shared goal (Frey et al., 2006). It should also be noted that there are varying stages and types of collaboration. These types of interactions can be described in terms of the intensity, ranging from co-existence (where each node exists before any interaction has begun) to coadunation (where pre-existing organi-zations relinquish their autonomy in an effort to strengthen a surviving organization resulting in merged nodes) (Gajda, 2004).
Many have recognized the importance of col-laboration to social movement change (Tarrow, 1994). Starr (2010) used a social movement analyti-cal approach, identifying the collective action of a diverse set of actors toward a shared goal as one of the distinguishing characteristics that makes the development of local food more of a social move-ment rather than a mere market shift. Our SNA example for this paper, which was a result of a larger project evaluation, simply examined the pres-ence or abspres-ence of entities in a food project’s sys-tem by region and type of organization across a three-year time period. SNA also can be used, however, to measure the strength of the collabora-tion (e.g., see Granovetter, 1973), along with a vari-ety of other dimensions and types of collabora-tions.
McCole, 2014), often in contrast to the globalized food system with its failure to acknowledge the interconnectivity of systems, resulting in negative externalities (Buttel, 2001). The globalized food system is characterized by homogenous, hierar-chical, opaque, distrustful, and competitive net-works, while regional food systems are described as heterogeneous, heterarchical, transparent, built on trust, co-operative networks, and based on an understanding of the interconnectedness of envi-ronmental, social, and economic systems (Hinrichs, 2003; Sonnino & Marsden, 2006).
Despite the recognition of collaboration as an important component throughout the food system, some subdisciplines are limited in their focus and divide the food system up into various components of production, distribution and processing, and consumption. Agroecology is defined “as the inte-grative study of the ecology of the entire food sys-tem, encompassing ecological, economic, and social dimensions” (Francis et al., 2003 p. 100). Yet research studies in the field of agrocecology “focus on narrow components of agricultural production and their immediate environmental impacts” (Francis et al., p. 101). Recently the concept of the value-based supply chain has emerged to study supply chains that differ from “traditional supply chains in that they attempt to enhance small and midscale farmers’ financial viability” (Feenstra et al., 2011 p. 71). One reason for the emergence of this field and earlier alternative food networks was the belief that by investigating processes and flows2
researchers could study production and consump-tion together. In doing so, researchers hoped to overcome the tendency to use different if not com-peting methodologies and to reduce the nature-versus-society division (Guthman, 2008). Yet supply chain and alternative food network research focuses almost exclusively on market actors, producers, and buyers,3 viewing capitalist spheres
as spaces to create alternative food systems (Guthman, 2008; Stevenson & Pirog, 2008). As Jarosz (2000) argued, for the local food movement
2Feenstra et al. (2011) outline three types of “flows” that are
important processes of the value chain: product, financial, and information flow.
to flourish and to provide a real alternative, agri-food networks must build and rely upon social relations that are embedded in a particular place. While the literature often recognizes the role of place and non-economic actors, often including the researchers themselves, it fails to fully acknowledge or explore the role these nonmarket actors play in the success or failure of the alternative food sys-tems through collaboration and the creation of nonmarket-based solutions or alternatives (Guthman, 2008).
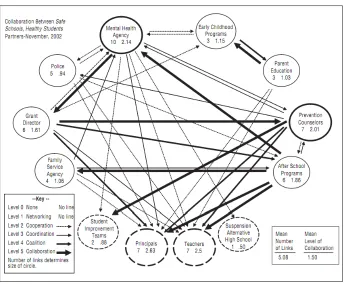
Acknowledging the importance of interactions among groups does not provide a method by which to measure these phenomena. Collaboration is quite complex and therefore difficult to measure. Nevertheless, some efforts to measure collabora-tion in the field have occurred. Frey et al. (2006) developed and promoted a methodology of collab-oration mapping in the context of a Safe Schools, Healthy Schools community-based grant (see Figure 1). This model represents individual organi-zations by circles (nodes). Types of collaborations among organizations are represented by lines. The size of circles reflects the number of links, and thickness of lines represents types of collaboration; the stronger the collaboration, the thicker the line. Frey et al.’s map of collaboration, however, is limited. It is primarily for visual analysis. It is also limited to fairly simple networks. With the example below there are only 12 organizations.
Collaboration may be conceptualized as the density and type of links between a set of nodes. Peterson (1991) and Hogue (1993) identified a number of stages of collaboration, or the places along a continuum of collaboration, that were later expanded by Frey and colleagues (2006) with their Seven Stage Model. On one end of the spectrum each node is an isolate, termed co-existence, where each node exists before any interaction has begun; at the opposite end of the spectrum there is relinquish their autonomy in an effort to streng-then a surviving organization, resulting in
3 Here buyers include institutional buyers, restaurants, retailers,
coadunation, where pre-existing organizations merged nodes (Gajda, 2004). Collaboration, the sixth stage on the scale and fifth stage on Frey et al.’s (2006) scale, is characterized by integrated strategies, collective purpose, and frequent com-munication based on mutual trust (Gajda, 2004).
Researchers have used descriptive surveys and interviews to describe the nature of collaborations from both unidimensional and multidimensional perspectives, describing the type, breadth, and/or strength of collaborations. Some of these studies have used traditional survey formats to ask about network interactions; others intending to use SNA in more complex networks use a two-stage process to gather data.
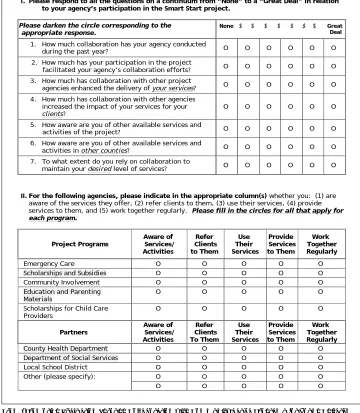
Similar to Frey et al. (2006), O’Sullivan, Heinemeier, and Masina (2001) developed a multidimensional survey to assess collaboration among approximately 50 community organizations engaged in a comprehensive early childhood sup-port program. As shown in Figure 2, the survey
asked respondents about the effects of the project on various aspects of collaboration and then asked them to identify a pre-established set of organizations with which they may have had contact. Respondents were asked to identify themselves and their organizations as well. Over the five years of the project, survey results were reported descript-ively for project outcomes and network growth. Once again this approach to measuring collaboration is limited in what it can say about the process beyond basic descriptive statistics.
In order to perform a network analysis, indivi-duals and/or
organizations need to be linked. In a relatively closed network, as the one above, a finite number of known collaborators are expected to participate. When the desired outcome, however, is increased collaboration, all network members are not necessarily known. Should this be the case, then a two-stage survey process is needed: one survey to identify the network members (either individuals or organizations) and the second survey (generated from the results of the first) to identify all possible partners and relationships of interest. This second survey is then redistributed to respondents of interest.
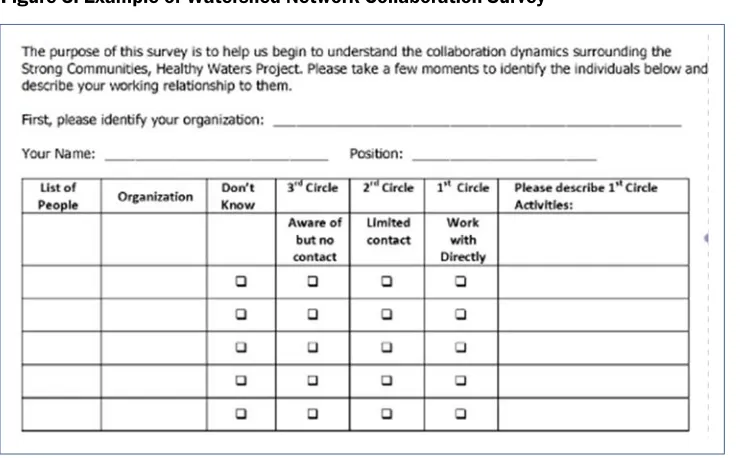
O’Sullivan and O’Sullivan (2009) followed this two-stage survey process to conduct an SNA of partners for the evaluation of a watershed project with an outcome of enhancing collaboration. After gathering an extended list of partners, the survey, shown in Figure 3, was used to gather additional information about which members interacted with one another and how. For this evaluation, no comparative data were collected.
From “Measuring Collaboration Among Grant Partners,” by B. B. Frey, J. H. Lohmeier, S. W. Lee, and N. Tollefson, 2006, American Journal of Evaluation, 27(3), p. 389. Copyright 2006 by SAGE. Reprinted with permission.
SNA investigates relationships among entities, including the patterns and implications of these relationships (Wasserman & Faust, 1994). It can be an invaluable tool for systematically assessing and then intervening at critical points within a network to improve project management (Cross, Borgatti, & Parker, 2002). At its most basic level, the use of SNA to create sociograms (graphic representation of social links) allows the user to visually assess patterns of relationships that can reveal a number of interesting and actionable points. It should be noted that there are a
number of potential challenges to using SNA in evaluation (Penuel, Sussex, Korbak, & Hoadley, 2006). SNA requires access to as many members of the network as possible, which takes signifi-cant time and money if the evaluator is responsible for col-lecting the data. Further, if the net-works boundaries are unknown it may be impossible to con-duct an analysis on the patterns of relationships of the entire group.
A number of evaluators have turned to SNA as a tool for analyzing complex program collaboration net-works in the fields of education, health, and conservation, but it has not been used widely within the field of program evalua-tion (Beatty, Harris, & Barnes, 2010;
Eisenberg & Swanson, 1996; Hidalgo-Hardeman, 1993; Penuel et al., 2006). A primary goal of apply-ing SNA has been to determine the value of usapply-ing collaboration as a strategy for program sustaina-bility. Provan, Veazie, Staten, and Teufel‐Shone (2005) have argued that many other fields can benefit from the use of network analysis because it can build and sustain local networks. It allows managers to see how their organizations fit within larger structures and how larger systems operate (Provan & Milward, 1995; Provan et al., 2005).
Figure 2. Descriptive Collaboration Survey Prototype
I. Please respond to all the questions on a continuum from “None” to a “Great Deal” in relation to your agency’s participation in the Smart Start project.
Please darken the circle corresponding to the
appropriate response. None Great Deal 1. How much collaboration has your agency conducted
during the past year? O O O O O O
2. How much has your participation in the project
facilitated your agency’s collaboration efforts? O O O O O O
3. How much has collaboration with other project
agencies enhanced the delivery of your services? O O O O O O
4. How much has collaboration with other agencies increased the impact of your services for your
clients? O O O O O O
5. How aware are you of other available services and
activities of the project? O O O O O O
6. How aware are you of other available services and
activities in other counties? O O O O O O
7. To what extent do you rely on collaboration to
maintain your desired level of services? O O O O O O
II. For the following agencies, please indicate in the appropriate column(s) whether you: (1) are aware of the services they offer, (2) refer clients to them, (3) use their services, (4) provide services to them, and (5) work together regularly. Please fill in the circles for all that apply for each program. Project Programs Aware of Services/ Activities Refer Clients to Them Use Their Services Provide Services to Them Work Together Regularly
Emergency Care O O O O O
Scholarships and Subsidies O O O O O
Community Involvement O O O O O
Education and Parenting
Materials O O O O O
Scholarships for Child Care
Providers O O O O O
Partners Aware ofServices/ Activities Refer Clients To Them Use Their Services Provide Services to Them Work Together Regularly
County Health Department O O O O O
Department of Social Services O O O O O
Local School District O O O O O
Other (please specify): O O O O O
O O O O O
While just emerging within local food systems contexts, this sort of preliminary SNA has been used in a few studies. As introduced earlier, O’Sullivan and O’Sullivan (2009) used SNA to identify partners within a local watershed collabo-rative. Similarly, Springer and de Steiguer (2011) usedSNA to examine connections between people and organizations for another watershed collabo-rative group in southern Arizona. Speaking about SNA, they noted, “despite its usefulness to the study of these relations, there have been relatively few applications to situations in agriculture and natural resources” (Springer & de Steiguer, 2011, p. 1). Thus the purpose of this article is to explore how SNA can be used to measure changes in collaborations, which, if viable, should indicate the strengthening of local food systems.
Applied Research Methods
The purpose of this case study is to demonstrate how SNA was used for one component of the evaluation of a multiyear local food systems project. Our intent is to describe in detail how the SNA of collaboration was conducted, which we hope will promote better understanding of this analysis approach and demonstrate its potential application to the efforts of others. The specific
evaluation questions for the case focused on different types of groups and
organizations that were participating in the project within one state. The project leaders wanted to know about growth in collaboration across the state, regional distribution of collaborators, types of organizations represented, and extent to which collaborations were distributed across project objectives. It should be noted that there are other uses of SNA in measuring collaborations that were not included in this specific case study.
Research Setting
In 2009, North Carolina State University (NCSU) and North Carolina Agriculture and Technical State University (NC A&T) were awarded a multi-year grant by the W. K. Kellogg Foundation. The grant was intended to facilitate the development of partnerships between the grantees and various organizations in North Carolina. In doing so, the intent was to promote institutional change in the food system by increasing access to healthy, green, fair, and affordable food within all communities and to address the needs of vulnerable youth and their families. The two universities have a history of working collaboratively on food system projects. NCSU and NC A&T, in coordination with the North Carolina Department of Agriculture, established the Center for Environmental Farming Systems (CEFS) in the eastern part of the state in 1994. CEFS develops and promotes food and farming systems that protect the environment, strengthen local communities, and provide eco-nomic opportunities in North Carolina. The W. K. Kellogg grant was awarded to CEFS.
From “Chesapeake Bay Funders Network Evaluation Report Year 2,” by R G. O’Sullivan and J. M. O’Sullivan, 2009, Chapel Hill, North Carolina: O’Sullivan & Associates. Reprinted with permission.
The evaluation team used a logic model approach to work with the two key partners, NCSU and NC A&T, to identify projects out-comes. Its activities addressed four objectives:
1. Increase access to “good” food (with a special emphasis on meat) that increases opportunities in retail and foodservice for higher-end niche production while simul-taneously incorporating products into innovative initiatives that expand access in low-income communities;
2. Promote institutional changes and develop potential models that encourage “good” food production and engagement of vul-nerable youth and their families in building sustainable local food systems;
3. Support the implementation of community-based food systems that engage youth throughout North Carolina and increase access to fresh and nutritious products for at-risk youth; and
4. Promote policy, research, and educational outreach that encourage adoption of community-based food systems.
An anticipated outcome of the fourth project objective was that community members, organiza-tions, and university Cooperative Extension agents would become actively engaged in developing community-based food systems at the local level. It was for this objective and to address the funders’ interest in the sustainability of the project that the SNA was initially planned. As shown earlier in this paper, one way to show sustainability is through collaboration and the expansion of robust relation-ships. The evaluators and the partners hoped that
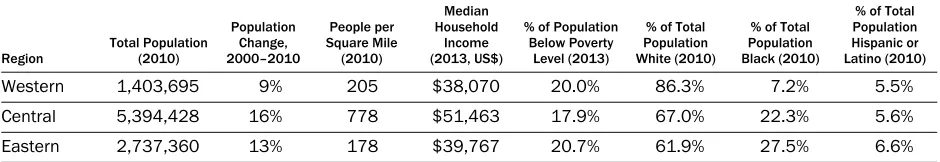
the SNA would help to identify gaps in their cur-rent relationships and help develop and maintain these relationships. Because of the regional differ-ences in North Carolina (Table 1), the evaluators and partners were especially concerned with seeing engagement with community partners across the state. North Carolina is 585 miles (941 km) east to west and comprises 100 counties. The state is often divided into three regions: western, central, and eastern. The western and eastern regions of the state have historically been geographically isolated, poorer, and more sparsely populated. The central region is home to the six most populous cities, including the state capital and Research Triangle Park. Residents in the central region are typically more educated and have higher incomes.
The analysis compared collaborators prior to 2008, before the grant was awarded, and then again in 2011, three years after the grant funding began. The pre- and postgrant analysis were intended to determine if the grant successfully fostered new relationships and strengthened alternative food systems in North Carolina. More specifically, evaluators planned to use the SNA to answer four questions:
A. How, if at all, did the project increase collaboration from 2008 to 2011? B. To what extent over time were the
collaborating groups representative of the three regions in North Carolina?
C. What change, if any, was there in the type of organizations participating in the collaboration?
D. How, if at all, did the nature of
collaborations in 2011 fit across project objectives?
Table 1. North Carolina Regional Characteristics
Region Total Population (2010)
Population Change, 2000–2010
People per Square Mile (2010)
Median Household
Income (2013, US$)
% of Population Below Poverty
Level (2013)
% of Total Population White (2010)
% of Total Population Black (2010)
% of Total Population Hispanic or Latino (2010)
Western 1,403,695 9% 205 $38,070 20.0% 86.3% 7.2% 5.5%
Central 5,394,428 16% 778 $51,463 17.9% 67.0% 22.3% 5.6%
Eastern 2,737,360 13% 178 $39,767 20.7% 61.9% 27.5% 6.6%
The reported study was intended as one step toward incorporating and using more complex network analyses in subsequent years.
Assessment Methods
Eight key project staff members were asked to identify, by each of the four project objectives, organizations with which they worked closely. Another project staff member who had been active with the project since its inception was asked to identify collaborating organizations retrospectively from 2008 along the same two dimensions. Nearly 400 organizations were identified. Each of these organizations also had associated attribute data, including organization type (e.g., university, non-profit, livestock operation, processor, and food-service), geographic focus of work (by county, statewide, or outside the state, and which of the four project objectives most closely aligned with the organization’s mission. Data were then compiled in a spreadsheet and analyzed using UCINET.
Results
We report our findings below, organized by our four research questions. We show how social network analysis can be a useful methodological framework for analyzing and visualizing
collaboration in the food system.
Increased Collaboration 2008–2011
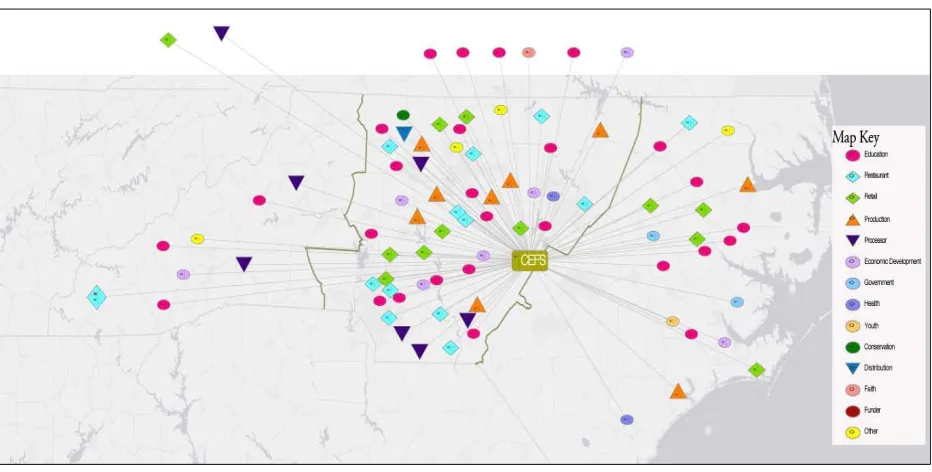
During the three-year period, there was a substan-tial increase in the number of relationships between CEFS and partner organizations across the state. The total number of collaborators grew from 87 to 372. Figure 4 (next page) shows the network map for 2008, and Figure 5 (next page) shows the net-work map for 2011. The nodes are clustered by geographic region: western,
central, eastern, statewide, or outside the state. The two nodes above the map in the upper left are outside the state, and the six nodes located at the central top part of the map are statewide. In addition to the geographic attribute, each node is assigned a sector of the food system. There
are 14 sectors represented by different symbols that are explained in the key in the right portion of the map. The important presence of nontraditional food system actors is also visible in the map, represented by circles. Nontraditional actors include educational, economic development, government, health, youth, conservation, faith, and funder organizations. The triangles and diamonds represent more traditional food system actors like processors, farmers, distributors, retail, and restau-rants. CEFS is located in the center of the network. Clearly the number of collaborating organizations vastly increased from 2008 to 2011.
Representation of Collaborators by Geographic Region
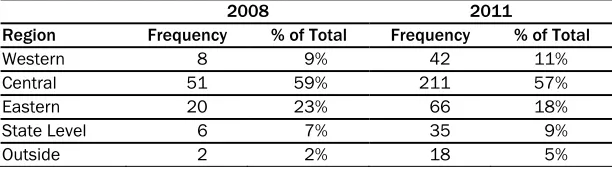
Figures 4 and 5 indicate the expansion in the number of collaborators across geographic areas of the state. This geographic expansion of project partners, however, is more clearly seen in Table 2. While the total number of organizations went from 87 to 372, their proportional relative locations, vis-à-vis the state, stayed nearly the same, with a decrease in the proportion of ties to the central and eastern regions and an increase of the proportion of ties to the western region, state, and outside. Clearly the hub of activity was in the central part of the state. While a chi square test showed no difference among percent of totals, differences in magnitude from 2008 to 2011 are substantial and statistically significant (t=2.23, p=.045).Changes in Types of Participating Organizations
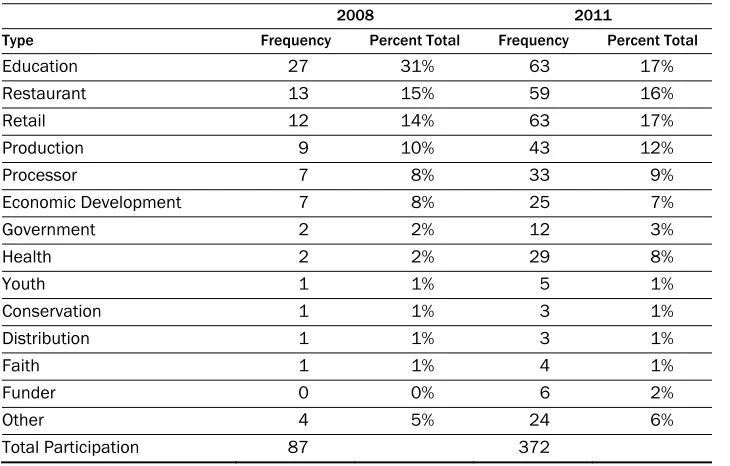
As shown in Table 3, in addition to the growth in the total number of food systems partners, the proportion of ties to different sectors increased (with the exception of education, which decreased). In 2008 the largest proportion of ties were with education organizations. This is as would beTable 2. Comparison of Collaborating Organizations by North Carolina Region, 2008 and 2011
2008 2011
Region Frequency % of Total Frequency % of Total
Western 8 9% 42 11%
Central 51 59% 211 57%
Eastern 20 23% 66 18%
State Level 6 7% 35 9%
expected when looking at CEFS project objectives prior to 2008, which centered primarily on
educational activities. As part of the WKKF funding, CEFS was able to diversify its project objectives and increasingly sought to engage with more diverse organizations. This resulted in an
increase in the variety of organizational sectors represented. There was also a shift in the ratio of traditional to nontraditional food system actors. In 2008 and 2011, nontraditional food system actors accounted for 51.7% and 45.9% of all of the organizations, respectively. The greatest percent of
Figure 4. CEFS 2008 Network Map by Location and Type of Organization
change occurred in the health sector, increasing from 2 to 29 organizations, a 13-fold increase.
Collaboration Fit across Project Objectives
The SNA was deliberately planned to focus on project objective D, which addressed promoting policy, research, and educational outreach that encourage adoption of community-based food systems. In addition to using SNA to measure the growth in project collaborators, their regional distribution, and type of organization, we also used it to measure the degree to which collaborators were involved with different aspects of the project. Collaborators were assigned to each of the project activities, which in turn were associated with each of the four project objectives. As part of the SNA, centrality measures were calculated to see how collaborators’ activities fit within projectobjectives. In SNA, centrality refers to the results of various indi-cators that identify the most important nodes in a sociogram. These centrality measure-ments include degree, closeness, between-ness, and eigenvector. Degree is the ratio of individual node con-nections to the total number of connec-tions in the network. Objective D had a degree ratio of 0.752, meaning that 75% of all node connections in the entire network were between Objective D and nodes. Closeness can be thought of as how long it will take to spread information from the node of interest to all other nodes. Betweenness measures the number of times a node acts as a bridge along the shortest path between two other nodes. The eigenvector is a measure of influence of a node in a network. From our analysis (shown in Table 4) it is clear that objective D had the strongest centrality measurements.
Other SNA Dimensions Used To Describe
the Collaborations
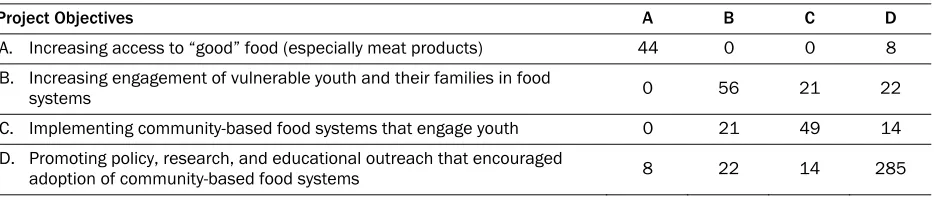
After the initial SNA results were presented, evaluators became interested in further describing the groups of collaborators. They wanted to know the extent to which collaborators participated across multiple objectives. SNA allows researchers to measure overlap among collaborators across objectives, using affiliation matrices. Somewhat surprisingly, as shown in Table 5, there was rela-tively little overlap between collaborators working in the four different components. This was espe-cially true for objective A activities, which were aimed at increasing accessibility to good food by increasing the number of farmers selling directly to the public. Table 5 illustrates how 44 of the collab-orators only participated in objective A activities,
Table 3. Comparison of Collaborating Organizations by Type, 2008 and 2011
2008 2011
Type Frequency Percent Total Frequency Percent Total
Education 27 31% 63 17%
Restaurant 13 15% 59 16%
Retail 12 14% 63 17%
Production 9 10% 43 12%
Processor 7 8% 33 9%
Economic Development 7 8% 25 7%
Government 2 2% 12 3%
Health 2 2% 29 8%
Youth 1 1% 5 1%
Conservation 1 1% 3 1%
Distribution 1 1% 3 1%
Faith 1 1% 4 1%
Funder 0 0% 6 2%
Other 4 5% 24 6%
Total Participation 87 372
Table 4. Two-Mode Centrality Measures for 2011 Project Objectives
Project
Objective Degree Closeness Betweenness Eigenvector
A 0.116 0.328 0.180 0.032
B 0.148 0.348 0.151 0.100
C 0.129 0.344 0.142 0.067
while eight also were involved in objective D, which addressed the policy arena. It should also be noted that collaborators were able to participate in multiple project activities, which is why the sum of the diagonal exceeds the total 372 collaborators. North Carolina is relatively small, and food system issues are still a fairly novel social cause. Following the logic of Wasserman and Faust (1994) we expected to find that of the 372 collaborators there would be a large amount of overlap between the four project components, but in fact there was not.
To further explore which groups worked together in similar fashion across activities for each of the project objectives, a clique analysis of the collaborations was conducted. A clique subgroup-ing in UCINET found five cliques. Four of the cliques shared the same partners as the four project components (A, B, C, and D). These four cliques correspond to those collaborators who only parti-cipated in activities under each of the four project objectives. The fifth clique comprised 37 collabor-ators, who were involved in two or more of project objectives B, C, or D.
Discussion and Conclusion
Using SNA allowed us to gather systematic evi-dence for project staff to provide to funders that answered important evaluation questions. Further-more, it provided some information about aspects of the project that were of interest to the project staff. Finally, it provided a way to demonstrate to the public and other organizations the growing importance of the local food systems work in which the project was engaged through the
increase in the number of organizations involved in food system work throughout the state and the role of the project as a networker between these various organizations.
Evaluation Question Data
Revisiting the four evaluation questions, the SNA showed that the project had (1) substantially increased the number of collaborators in its net-work from 2008 to 2011; (2) increased the number of collaborators across the state, but did not change their proportional regional representation; (3) seen changes in the types of organizations participating in the network; and (4) shown how the majority of project collaborators in 2011 were working to make positive modification in the local food systems policy area.
The network maps of 2008 and 2011 clearly demonstrate the growth of the network in a way that can be understood by technical as well as lay audiences. While explaining that the number of collaborators had grown from 87 to 372 would have been possible without the SNA, the graphic depiction of the two networks for the two years shows where across the state collaborators were located and what types of organizations they repre-sented. At the same time, SNA data also allowed for summarizing the data for collaborators by region in the state and testing the significance of these differences statistically. Thus the number of collaborators in 2008 and 2011 showed substantial and statistically significant changes for each region, whereas a chi square analysis of proportionality changes by region over the two years showed no significant difference. For technical audiences who ask for the quantitative or inferential evidence, SNA has the ability to deliver.
Similarly, SNA easily allowed for a description of changes in the type of organizations participat-ing in the collaboration in 2008 and 2011. Evalua-tors decided to organize the data descriptively so that project staff and funders could see how growth in the types of organizations had changed.
Table 5. Affiliation Matrix of 2011 Project Component Membership
Project Objectives A B C D
A. Increasing access to “good” food (especially meat products) 44 0 0 8
B. Increasing engagement of vulnerable youth and their families in food
systems 0 56 21 22
C. Implementing community-based food systems that engage youth 0 21 49 14
D. Promoting policy, research, and educational outreach that encouraged
For this analysis, frequencies were sufficiently small as to not warrant additional statistical treatment. Program staff members saw that the balance of groups represented had expanded, primarily by reducing the proportion of Education groups and increasing the proportion of Health groups. This was an effect that they had intended, so they were pleased to see the results. They could also see that the percentages of organizations from Youth, Conservation, Distribution, Faith, and Funders organizations were relatively low and that addi-tional efforts would be need to increase participa-tion of these groups. Addiparticipa-tionally the network map allowed for the categorization of organizations as nontraditional food system actors, depicted as circles (i.e., educational, economic development, government, health, youth, conservation, faith, and funder organizations) and more traditional food system actors, depicted as triangles (i.e., processors, farmers, distributors) or diamonds (i.e., retail, and restaurants). This allowed audiences for the evalua-tion to visualize in two pictures what would take multiple tables to explain.
Finally, in terms of the evaluation questions the SNA was able to demonstrate how the nature of collaborations in 2011 fit across project objec-tives. An underlying assumption of the project was that growing the number of collaborators in the network would strengthen the project’s ability to precipitate positive policy changes. The SNA pro-vided clear evidence through centrality measures that more that 75% of the collaborators were par-ticipating in project activities aimed at positively changing local food policy. In the three years of its existence, the project could list positive policy changes that had occurred around local food sys-tems. While not evidence of causality, SNA pro-vided systematic evidence to indicate growing efforts to bring about change.
Other Project Aspects
The initial SNA results were presented to project staff. The network maps for 2008 and 2011 were clearly understood and the growth in collaboration celebrated. Evaluators later became interested in further describing the groups of collaborators. They wanted to know the extent to which collabo-rators participated across multiple objectives,
because they believed that policy work would best be informed by a broad base of collaborators. The affiliation matrix produced with the SNA showed that there were organizations that were not partici-pating across multiple objectives. The clique analy-sis demonstrated that a group of 37 collaborators were participating in at least two of their three objectives, but the food production and distri-bution objective was more isolated.
The communicative power of the network map transcended the evaluation report. CEFS was nominated for a Community Engagement Award sponsored by the Association of Public and Land-grant Universities (APLU). The space available for evidence in the nomination process was very lim-ited. The two years of network maps were included among the documents submitted, and CEFS won at the regional level.
In sum, the social network analysis provided clear and compelling evidence that the collabora-tion between NCSU and NC A&T with the finan-cial support of the W. K. Kellogg Foundation dramatically increased the level of participation of various stakeholders throughout the state and beyond. In three short years, the program expanded its partner membership by fourfold, from 87 to 372. The separate project components successfully involved representatives from a broad array of organizations, and the proportional increase in network partners remained constant geographically. The SNA allowed the evaluators an opportunity to present information about a com-plex food system, which includes nearly 400 market and nonmarket actors and their interactions, in a visually appealing way so that project stakeholders could see the results and project managers could make informed decisions about next steps.
Potential of SNA in Other Local Food
Systems Situations
almost any situation that examines collaboration. Where there is group interaction, SNA can be used to measure it. The example we provided was specific to one project evaluation. Other uses for SNA in local food systems research are numerous. It may be used within a group of individuals who are working toward similar goals, within organiza-tions that have groups and/or individuals with different responsibilities, and across groups with similar or diverse missions.
When individuals within a group need to inter-act and/or collaborate, SNA can be used to describe those interactions. A farmer cooperative might be interested in making sure that its mem-bers are aware of changes in practice or services available to them. The cooperative may not have the personnel to communicate easily with all its individual members, so it needs to identify key people within the group who could help dissemi-nate information. SNA could be used to identify those key people and create effective communica-tion clusters. A community supported agriculture (CSA) operation might want to identify optimal distribution points in a similar manner.
Within organizations SNA may be used to see which individuals and/or departments are interact-ing with one another and how. Within a Coopera-tive Extension office, SNA might be used to deter-mine which personnel or departments are engaging in local food activities, what those activities are, and how the personnel or departments are interact-ing. Multiple-year network maps could be used to show changes in these activities and alignments. Pre- and postproject statistical analysis could be used to look at significant changes in these prac-tices.
Across groups SNA may be used to examine clusters of work efforts, key leaders around particular issues, and/or types of interactions. Statewide collaborative efforts to determine sus-tainable food systems indicators, as are occurring currently in Michigan and North Carolina, could use SNA to track subgroup efforts and inter-actions. This would provide them with evidence of the extent to which participating groups are representative of the state and the various actors essential to making such a system work.
SNA Limitations
While we have demonstrated how social network analysis can be a very useful tool, limitations are certainly present. Primary among limitations is that SNA is not very well known and its value not well understood. Beyond that, as an evaluation tool SNA is one of many tools that may be used. In fact, findings from SNA often are strengthened when paired with qualitative data collection. Quali-tative data can be used to communicate the type and quality of network ties. Finally, SNA is most powerful when doing analysis across years and thus requires advanced planning as well as multiple years of data collection.
As mentioned earlier, the use of SNA parallels the advent of computer programs that have made it more straightforward to use. As such, its popu-larity is growing, but it has not penetrated much of the local food systems literature. Program leaders and researchers may not be aware of what it is and how it might benefit them. This article is one effort to address this limitation; more examples using SNA are needed.
As an evaluation tool, SNA is probably a third- or fourth-tier strategy. Many local foods programs and projects do not evaluate their efforts at all. When evaluation does occur, it is often very cur-sory; perhaps a written participant survey or inter-view is conducted. Some programs, however, do take evaluation more seriously, construct evalua-tion plans with logic models, and implement these plans. Depending on the individuals responsible for the evaluation, they may or may not be aware of SNA or have the capacity to conduct one. Eval-uation efforts need to be more incorporated into food system work. SNA will only become more common as evaluation efforts are more rigorous.
A final limitation of SNA is that it is most powerful across years and thus requires advanced planning as well as multiple years of data collection. This is hard to orchestrate, in part because it require more resources. Future studies could bene-fit evaluation efforts by collecting more data across multiple time periods. This would allow for testing both relational and attributional hypotheses over time, which would allow for directional analyses
References
Beatty, K., Harris, J. K., & Barnes, P. A. (2010). The role of interorganizational partnerships in health services provision among rural, suburban, and urban local health departments. Journal of Rural Health, 26(3), 248–258. http://dx.doi.org/10.1111/ j.1748-0361.2010.00285.x
Bittman, M. (2012, October 10). Everyone eats there. The New York Times. Retrieved from http://www. nytimes.com/2012/10/14/magazine/californias-central-valley-land-of-a-billion-vegetables.html Born, B., & Purcell, M. (2006). Avoiding the local trap:
Scale and food systems in planning research. Journal of Planning Education and Research, 26(2), 195–207.
http://dx.doi.org/10.1177/0739456X06291389 Buttel, F. H. (2001). Some reflections on late twentieth
century agrarian political economy. Sociologia Ruralis, 41(2), 165–181. http://dx.doi.org/10.1111/1467-9523.00176
Carrington, P. J., Scott, J., & Wasserman, S. (Eds.). (2005). Models and methods in social network analysis. New York: Cambridge University Press.
Cross, R., Borgatti, S. P., & Parker, A. (2002). Making invisible work visible: Using social network analysis to support strategic collaboration. California Management Review, 44(2), 25–46.
http://dx.doi.org/10.2307/41166121
Eisenberg, M., & Swanson, N. (1996). Organizational network analysis as a tool for program evaluation. Evaluation & the Health Professions, 19(4), 488–506.
http://dx.doi.org/10.1177/016327879601900407 Feenstra, G. (2002). Creating space for sustainable food
systems: Lessons from the field. Agriculture and Human Values, 19(2), 99–106.
http://dx.doi.org/10.1023/a:1016095421310 Feenstra, G., Allen, P., Hardesty, S., Ohmart, J., &
Perez, J. (2011). Using a supply chain analysis to assess the sustainability of farm-to-institution programs. Journal of Agriculture, Food Systems, and Community Development, 1(4), 69–84.
http://dx.doi.org/10.5304/jafscd.2011.014.009 Francis, C., Lieblein, G., Gliessman, S., Breland, T. A.,
Creamer, N., Harwood, R.,…Poincelot, R. (2003). Agroecology: The ecology of food systems. Journal of Sustainable Agriculture, 22(3), 99–118.
http://dx.doi.org/10.1300/J064v22n03_10 Frey, B. B., Lohmeier, J. H., Lee, S. W., & Tollefson, N.
(2006). Measuring collaboration among grant partners. American Journal of Evaluation, 27(3), 383– 392. http://dx.doi.org/10.1177/1098214006290356 Gajda, R. (2004). Utilizing collaboration theory to
evaluate strategic alliances. American Journal of
Evaluation, 25(1), 65–77.
http://dx.doi.org/10.1177/109821400402500105 Galt, R. E., Clark, S. F., & Parr, D. (2012). Engaging
values in sustainable agriculture and food systems education: Toward an explicitly values-based pedagogical approach. Journal of Agriculture, Food Systems, and Community Development, 2(3), 43–54.
http://dx.doi.org/10.5304/jafscd.2012.023.006 Granovetter, M. S. (1973). The strength of weak ties.
American Journal of Sociology, 78(6), 1360–1380.
http://dx.doi.org/10.1086/225469
Guthman, J. (2008). Neoliberalism and the making of food politics in California. Geoforum, 39(3), 1171–1183.
http://dx.doi.org/10.1016/j.geoforum.2006.09.002 Hidalgo-Hardeman, O. M. (1993). Evaluating social
service delivery configurations. Evaluation Review, 17(6), 603–620.
http://dx.doi.org/10.1177/0193841X9301700602 Hinrichs, C. C. (2003). The practice and politics of food
system localization. Journal of Rural Studies, 19(1), 33–45. http://dx.doi.org/10.1016/S0743-0167(02)00040-2
Hoffman, M., Lubell, M., & Hillis, V. (2011). Learning pathways in viticulture management (Research Brief). Davis, California: University of California, Davis, Center for Environmental Policy and Behavior. Retrieve from
http://environmentalpolicy.ucdavis.edu/
Hogue, T. (1993). Community based collaboration: Community wellness multiplied. Bend, Oregon: Oregon State University, Chandler Center for Community Leadership. Retrieved from https://www.uvm.edu/ extension/community/nnco/collab/wellness.html Holloway, L., Kneafsey, M., Venn, L., Cox, R., Dowler,
E., & Tuomainen, H. (2007). Possible food economies: A methodological framework for exploring food production-consumption relationships. Sociologia Ruralis, 47(1), 1–19.
http://dx.doi.org/10.1111/j.1467-9523.2007. 00427.x
Jarosz, L. (2000). Understanding agri-food networks as social relations. Agriculture and Human Values, 17(3), 279–283.
http://dx.doi.org/10.1023/A:1007692303118 Lachance, L., Carpenter, L., Quinn, M., Wilkin, M. K.,
Green, E., Tsuchiya, K.,…Clark, N. M. (2014). Food & community: The cross-site evaluation of the W.K. Kellogg Food & Fitness community partnerships. Community Development, 45(3), 227-239.
to develop midscale food value chains. Journal of Agriculture, Food Systems, and Community Development, 1(4), 119–128.
http://dx.doi.org/10.5304/jafscd.2011.014.014 Lincoln, Y. S., Thorp, L. G., & Russon, C. (2003). The
storied nature of agriculture and evaluation: A conversation. Agriculture and Human Values, 20(3), 267–276.
http://dx.doi.org/10.1023/A:1026197908214 Lockie, S. (2002). ‘The invisible mouth’: Mobilizing ‘the
consumer’ in food production–consumption networks. Sociologia Ruralis, 42(4), 278–294.
http://dx.doi.org/10.1111/1467-9523.00217 Malone, K., Harmon, A. H., Dyer, W. E., Maxwell, B.
D., & Perillo, C. A. (2013). Development and evaluation of an introductory course in sustainable food and bioenergy systems. Journal of Agriculture, Food Systems and Community Development, 4(2), 149–161.
http://dx.doi.org/10.5304/jafscd.2014.042.002 Miller, C. L., & McCole, D. (2014). Understanding
collaboration among farmers and farmers’ market managers in southeast Michigan (USA) Journal of Agriculture, Food Systems, and Community Development, 4(4), 71–95.
http://dx.doi.org/10.5304/jafscd.2014.044.003 O’Sullivan, R. G., Heinemeier, S., & Masina, P. (2001,
November). Promoting evaluation through collaboration with community-based programs for young children and their families. Paper presented at the annual meeting of the American Evaluation Association, St. Louis, Missouri.
O’Sullivan, R. G., & O’Sullivan, J. M. (2009). Chesapeake Bay Funders Network evaluation report year 2. Chapel Hill, North Carolina: O’Sullivan & Associates.
Penuel, W. R., Sussex, W., Korbak, C., & Hoadley, C. (2006). Investigating the potential of using social network analysis in educational evaluation. American Journal of Evaluation, 27(4), 437–451.
http://dx.doi.org/10.1177/1098214006294307 Peterson, N. L. (1991). Interagency collaboration under
Part H: The key to comprehensive,
multidisciplinary, coordinated infant/toddler intervention services. Journal of Early Intervention, 15(1), 89–105.
http://dx.doi.org/10.1177/105381519101500111 Porter, M. E. (2000). Location, competition, and
economic development: Local clusters in a global economy. Economic Development Quarterly, 14(1), 15–34.
http://dx.doi.org/10.1177/089124240001400105
Provan, K. G., & Milward, H. B. (1995). A preliminary theory of interorganizational network effectiveness: A comparative study of four community mental health systems. Administrative Science Quarterly, 40(1), 1–33. http://dx.doi.org/10.2307/2393698 Provan, K. G., Veazie, M. A., Staten, L. K., & Teufel‐
Shone, N. I. (2005). The use of network analysis to strengthen community partnerships. Public
Administration Review, 65(5), 603–613.
http://dx.doi.org/10.1111/j.1540-6210.2005. 00487.x
Scheirer, M. A. (2005). Is sustainability possible? A review and commentary on empirical studies of program sustainability. American Journal of Evaluation, 26(3), 320–347.
http://dx.doi.org/10.1177/1098214005278752 Selfa, T., & Qazi, J. (2005). Place, taste, or face-to-face?
Understanding producer–consumer networks in “local” food systems in Washington State. Agriculture and Human Values, 22(4), 451–464.
http://dx.doi.org/10.1007/s10460-005-3401-0 Smith, B. (2014, August 9). Don’t let your children grow
up to be farmers. The New York Times. Retrieved from http://www.nytimes.com/2014/08/10/ opinion/sunday/dont-let-your-children-grow-up-to-be-farmers.html
Sonnino, R., & Marsden, T. (2006). Beyond the divide: Rethinking relationships between alternative and conventional food networks in Europe. Journal of Economic Geography, 6(2), 181–199.
http://dx.doi.org/10.1093/jeg/lbi006 Springer, A. C., & de Steiguer, J. E. (2011). Social
network analysis: A tool to improve understanding of collaborative management groups. Journal of Extension, 49(6), Article 6RIB7.
http://www.joe.org/joe/2011december/rb7.php Starr, A. (2010). Local food: A social movement?
Cultural Studies <=> Critical Methodologies, 10(6), 479–490.
http://dx.doi.org/10.1177/1532708610372769 Stevenson, G. W., & Pirog, R. (2008). Values-based
supply chains: Strategies for agrifood enterprises of the middle. In T. A. Lyson, G. W. Stevenson, & R. Welsh (Eds.), Food and the Mid-Level Farm: Renewing an Agriculture of the Middle (pp. 119–143). Cambridge, Massachusetts: Massachusetts Institute of
Technology Press.
Tuberculosis Evaluation Work Group. (2006). TB program evaluation handbook: Introduction to program evaluation. Atlanta, Georgia: Centers for Disease Control and Prevention. Retrieved from
http://www.cdc.gov/tb/programs/Evaluation/ Default.htm
Warner, K. D. (2007). The quality of sustainability: Agroecological partnerships and the geographic branding of California winegrapes. Journal of Rural Studies, 23(2), 142–155.
http://dx.doi.org/10.1016/j.jrurstud.2006.09.009 Wasserman, S., & Faust, K. (1994). Social network analysis:
Methods and applications. Cambridge, UK: Cambridge University Press.
Watts, D. C. H., Ilbery, B., & Maye, D. (2005). Making reconnections in agro-food geography: Alternative systems of food provision. Progress in Human Geography, 29(1), 22–40.
http://dx.doi.org/10.1191/0309132505ph526oa Webb, K. L., Pelletier, D., Maretzki, A. N., & Wilkins, J.
(1998). Local food policy coalitions: Evaluation issues as seen by academics, project organizers, and funders. Agriculture and Human Values, 15(1), 65–75.