http://www.sciencepublishinggroup.com/j/sjbm doi: 10.11648/j.sjbm.20190705.13
ISSN: 2331-0626 (Print); ISSN: 2331-0634 (Online)
A Result Based Experimental Analysis of Rwandan
Financial Progress as a Result of OAG Audit with
Reference from 2014 to 2018
Mbonigaba Celestin
Business and Development Studies, Kibogora Polytechnic, Nyamasheke, Rwanda
Email address:
To cite this article:
Mbonigaba Celestin. A Result Based Experimental Analysis of Rwandan Financial Progress as a Result of OAG Audit with Reference from 2014 to 2018. Science Journal of Business and Management. Special Issue: Transformation in Management.
Vol. 7, No. 5, 2019, pp. 120-126. doi: 10.11648/j.sjbm.20190705.13
Received: August 21, 2019; Accepted: October 12, 2019; Published: October 23, 2019
Abstract:
The study intends to be a result based experimental analysis of Rwandan financial progress as a result of office of auditor general (OAG)’s audit with Reference from 2014 to 2018. The objective of the study was to analyze the financial effectiveness of Rwanda as result of status of OAG audit recommendations. The Research Methodology used was both qualitative and quantitative methods to achieve the research objective, the secondary data were collected and then analyzed through Spreadsheet and SPSS 20 tools. The result of the analysis noted that boards and government business enterprises (GBEs) in general have been predominantly getting adverse opinion in the last 3 years. However, there was a notable improvement for Rwanda development board (RDB), Rwanda biomedical center (RBC) and Rwanda transport development agency (RTDA). Regarding to unnecessary or unlawful expenditures, and whether there was embezzlement or squandering of public funds, there has been 68% decline in the Article 166 type of expenditure from Frw 17.6 billion (2016) to Frw 5.68 billion (2018). The biggest decline has been under “Unsupported expenditure” which has declined by 92% from Frw 6.9bln (2016) to Frw 0.6 billion (2018). Therefore, this is indicative of an improvement in public financial management (PFM) systems and controls when it comes to recording and accounting for expenditure.Keywords:
Financial Audit, Compliance & Performance Audit, Audit Opinion, Implementation of OAG Audit1. Introduction
OAG has grown over the years since its establishment. Human and financial resources have been increased due to continued support from government and development partners. It has enabled the office to discharge its constitutional mandate more efficiently and effectively [1]. According to Article 165 of the Constitution of the Republic of Rwanda of June 2003 revised in 2015, and Articles 6 and 14 of Law no 79/2013 of 11/09/2013 determining the mission, organization and functioning of the Office of the Auditor General of State Finances, the responsibilities of the Office of the Auditor General include the following: Auditing and reporting on accounts of all public entities, local administrative entities, public enterprises, parastatal organizations and projects;
Conducting financial and value for money, economy and efficiency audits in respect of expenditure in all institutions referred to above and Conducting accountability, management and strategic audits of accounts in the institutions mentioned above.
Currently, they meet mandate by pursuing the three main audit disciplines: Financial, Compliance and Performance audits. They also perform IT audits as both support service and specific audit engagements [2].
2. Literature Review
Science Journal of Business and Management 2019; X(X): XX-XX 121
necessary to achieve the above goal. In order to do that management of the SAI need to understand the processes directly or indirectly contributing to the quality of their primary output or product – the audit reports [3].
In the past, managers in the public sector had a narrower range of expectations for the role of internal audit than managers in the private sector. This explains why the internal audit function in the public sector was dominated by pre-payment audits. Thus, internal auditors devoted most of their time to the checking on individual transactions before the payments were made [4].
All OAG personnel are required to have high commitment to quality, and to encourage and promote those who are equally committed to quality performance. The Auditor General has ultimate authority and responsibility for the system of quality control. He may delegate authority for managing the OAG’s system of quality control to a person (s) with sufficient and appropriate experience to assume that role [5].
The article in the New Zealand public sector from the perspective of the Office of the Auditor General (OAG) addresses the status and directions for performance reporting. It outlines the role of the Audit Office, provides definitions of accountability, and projects the dimensions of a new accountability. The authors assess challenges to performance reporting and accountability, the history of reporting performance accountability in New Zealand, an Audit Office perspective on accountability to Parliament, lessons learned from reform, some issues outstanding, and future development in terms of how the public sector in New Zealand should improve reporting on non-financial performance [6].
Both the IFAC (ISQC1) and INTOSAI standards (ISSAI 40) have outlined the main requirements on SAIs in the following categories: Leadership responsibilities for quality within the SAI;
Relevant ethical requirements; Acceptance and continuance of client relationships and specific engagements; Human resources; Engagement performance and Monitoring [7].
However, in recent years internal auditing has assumed a strategic dimension and that underscores why it has become an essential component of public sector governance and financial management reforms in many developing countries. The intent of this paper is to present a position that internal auditing in the public sector, when well-structured and given the required mandate to perform, improves performance and serves as a valuable resource in promoting good governance. It generates thoughts on the importance and challenges of public sector internal auditing [8].
Organization of cooperation and economic development (OECD) [9] theoretical framework for historical narrative analysis, examines the history of performance auditing in the Australian federal public sector. The analysis considers four crucial events in the period 1973-98 the Royal Commission on Australian Government Administration (1976), the
Australian National Audit Office efficiency audit developments (1979), the Joint Committee of Public Accounts Inquiry (1989), and the struggles over the passage of the Audit Act 1997. The analysis supports the proposition that performance auditing is a malleable social construct rather than a definitive performance review technology. The construction of its technological basis has been contested, with several concepts being included or excluded by various groups. These have both reflected and influenced agendas and activities at individual, organizational, institutional, sociopolitical and socioeconomic levels in the Australian public sector. Performance auditing is therefore revealed as a masque that ultimately may defy any universal technical definition [10].
Each OAG staff member is, to varying degrees, responsible for implementing the quality control policies and procedures set by the organization [11].
3. Research Methodology
This study adopted descriptive cross sectional survey design. The target population in this study was 173 entities audited. The information used in this research was mainly originated from secondary source while data collection technique was documentary techniques. Data were analyzed using both quantitative and qualitative technique and the results were presented by using the descriptive methods of data analysis.
4. Results and Discussion of Findings
4.1. Audit Conducted by OAG
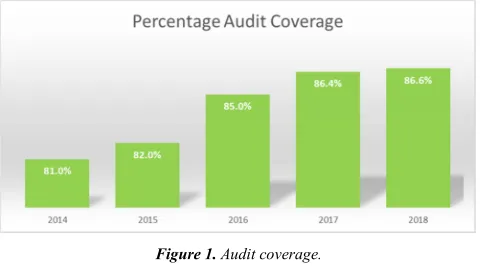
The OAG conducts Coverage of Financial & Compliance Audits independently on State finances and their purposeful and far-reaching use. As a result of our operations, the public can find out whether State funds, i.e., taxes paid by the public, are used in the public interest, and how effectively the State has utilized these funds. As the human and financial capacity, has increased, the percentage of audit coverage in terms of government expenditure audited by the office has also increased steadily over the last five (5) years [12-16].
Figure 1. Audit coverage.
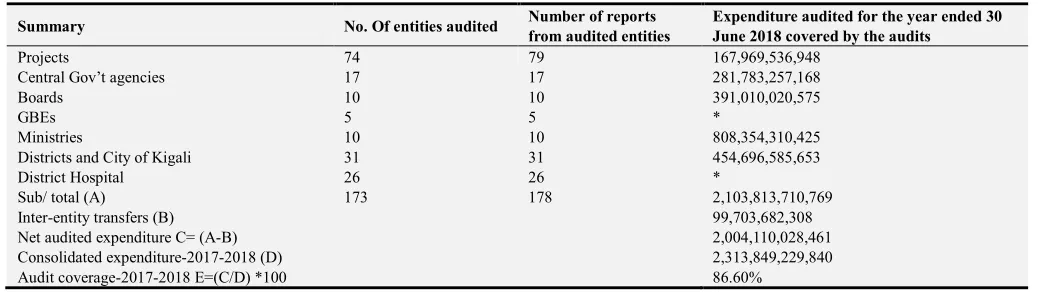
Table 1. Audit coverage of audited government expenditure.
Summary No. Of entities audited Number of reports
from audited entities
Expenditure audited for the year ended 30 June 2018 covered by the audits
Projects 74 79 167,969,536,948
Central Gov’t agencies 17 17 281,783,257,168
Boards 10 10 391,010,020,575
GBEs 5 5 *
Ministries 10 10 808,354,310,425
Districts and City of Kigali 31 31 454,696,585,653
District Hospital 26 26 *
Sub/ total (A) 173 178 2,103,813,710,769
Inter-entity transfers (B) 99,703,682,308
Net audited expenditure C= (A-B) 2,004,110,028,461
Consolidated expenditure-2017-2018 (D) 2,313,849,229,840
Audit coverage-2017-2018 E=(C/D) *100 86.60%
*Assets and expenditure worth Frw 1,713,643,264,075 of 5 GBEs, 26 district hospitals and 19 other entities is not consolidated and therefore is not included as part of computation of the expenditure coverage of 86.6%. This expenditure which is not part of computation of current year audit coverage represents 74% of government consolidated government expenditure for the year ended 30th June 2018.
The current year audits covered 173 public entities and projects, which comprises of 142 budget agencies and projects that incurred total expenditure of Frw 2,004,110,028,461 during the year ended 30 June 2018. Five (5) Government Business Enterprises that had assets worth Frw 1,675,029,337,023 as at 30 June 2017 and 26 District Hospitals that incurred expenditure amounting to Frw 29,748,819,879 during the year ended 30 June 2017. For each of the audited entity, The Auditor General expressed an opinion on fair presentation of financial statements and confirmed whether the entity complied with laws and regulations governing public spending.
The expenditure incurred by 142 budget agencies and projects represents 86.6% (2017: 86.4%) of the reported Government Expenditure of Frw 2,313,849,229,840 for the year ended 30 June 2018. A total of 178 audit reports have been issued to support the audit opinion issued on state consolidated financial statements.
During the current year audits, OAG conducted eight (8) performance audits, four (4) special audits and three (3) IT
audits. Selection of topics for performance audits focused more on the areas of national interest especially health, agriculture, education and social sectors. These contribute to improved living conditions of citizens and enable realization of National Strategy for Transformation (NST1) [12-16].
4.2. Overview of Audit Results
It is his view that, when looking at the legal framework which empowers the office, there’s no legal doubt on what the audit is for. However, in practice, there is some public doubt on what the audit is for and investors’ views differ from management’s views. It is under this cloud which the OAG has gone to lengths in the current report to try as much as possible to present a clear, simple albeit factual message on the state of the country’s financial management system. In order to effectively put across the message of the OAG, it is necessary to understand the aim of various audit they perform [12-16].
Table 2. Types of audit performed by OAG.
FINANCIAL AUDIT COMPLIANCE & PERFORMANCE AUDIT
Are financial statements prepared in accordance with laws and regulations and do they provide clear information regarding the financial situation and performance of institutions? Do the identified crucial transactions subject to financial statements comply with the requirements set forth in laws and regulations, planning documents and are they nationally (or internationally) recognised practice which applies thereto?
Do transactions and activities comply with the requirements set forth in laws and regulations and does the audited unit carry out its activities in an effective, productive and cost-efficient manner with respects to value for money?
4.3. Audit Opinions
The current year audits covered 173 public entities and projects, which comprise of 142 budget agencies and projects, 5 Government Business Enterprises and 26 District Hospitals. This represents 86.6% coverage as compared to
86.4% coverage in the previous year. For each of the audited entity, I expressed an opinion on fair presentation of financial statements and confirmed whether the entity complied with laws and regulations governing public spending. A total of 178 audit reports have been issued to support audit opinion expressed on government consolidated financial statements.
Table 3. Audit opinion expressed on government consolidated financial statements.
Cluster Opinion on the audit of compliance with laws and
regulations and realization of value for money Opinion on Financial Statements
Unqualified Unqualified Qualified Adverse Disclaimer Unqualified Qualified Adverse Disclaimer
Science Journal of Business and Management 2019; X(X): XX-XX 123
Cluster Opinion on the audit of compliance with laws and
regulations and realization of value for money Opinion on Financial Statements
Unqualified Unqualified Qualified Adverse Disclaimer Unqualified Qualified Adverse Disclaimer
Boards and GBEs 2 3 10 0 4 3 7 1
Ministries and Other Central
Government entities 12 12 3 0 22 4 1 0
Districts and CoK - 1 30 0 1 28 2 0
District hospitals 1 15 10 0 0 3 23 0
Total 58 61 59 0 101 42 34 1
The table above illustrates the total number of opinions by nature of opinion (Unqualified, Qualified, Adverse and disclaimer), by type of audit (Financial or Compliance) and by audit Cluster (Projects, Boards and GBE etc) [12-16].
Compliance audit opinion results: A total of 178 audit opinions were issued under the discipline of compliance audit. Unqualified audit opinions made up 33%, Qualified opinions made up 34% while Adverse opinions made up 33%. Based on the audits concluded, there is a slight improvement since the entities which obtained unqualified opinions increased by 3% compared to previous year. However, the number of public entities which obtained adverse opinion is still high.
Compliance audit opinion results: A total of 178 audit opinions were issued under the discipline of compliance audit. Unqualified audit opinions made up 33%, Qualified opinions made up 34% while Adverse opinions made up 33%. Based on the audits concluded, there is a slight improvement since the entities which obtained unqualified opinions increased by 3% compared to previous year. However, the number of public entities which obtained adverse opinion is still high. The non-compliance with applicable laws and regulations governing public spending implies that public entities have not properly managed public resources to realize value for money and provide effective service delivery to citizens [17].
It is observed that 74% of the Unqualified opinions were
from Projects. Projects also contributed approximately 49% of the Qualified opinions. Whilst Districts and City of Kigali made up approximately 51% of the Adverse opinion.
Financial audit opinion results: A total of 178 audit opinions were issued under the discipline of financial audit. Unqualified audit opinions made up 57%, Qualified opinions made up 23% whilst Adverse opinions made up 19%. The only 1 Disclaimer opinion made up 1% of the total audit opinions under the cluster of Boards and GBEs. Total percentage of audit opinions in favour of Unqualified audit opinions is indicative of improvement of public entities in presenting their financial statements in a true and fair manner in line with existing national legal reporting framework.
It is observed that 74% of the Unqualified opinions were from Projects. Projects also contributed approximately 49% of the Qualified opinions. Whilst Districts and City of Kigali made up approximately 51% of the Adverse opinion.
Financial audit opinion results: A total of 178 audit opinions were issued under the discipline of financial audit. Unqualified audit opinions made up 57%, Qualified opinions made up 23% whilst Adverse opinions made up 19%. The only 1 Disclaimer opinion made up 1% of the total audit opinions under the cluster of Boards and GBEs. Total percentage of audit opinions in favor of Unqualified audit opinions is indicative of improvement of public entities in presenting their financial statements in a true and fair manner in line with existing national legal reporting framework.
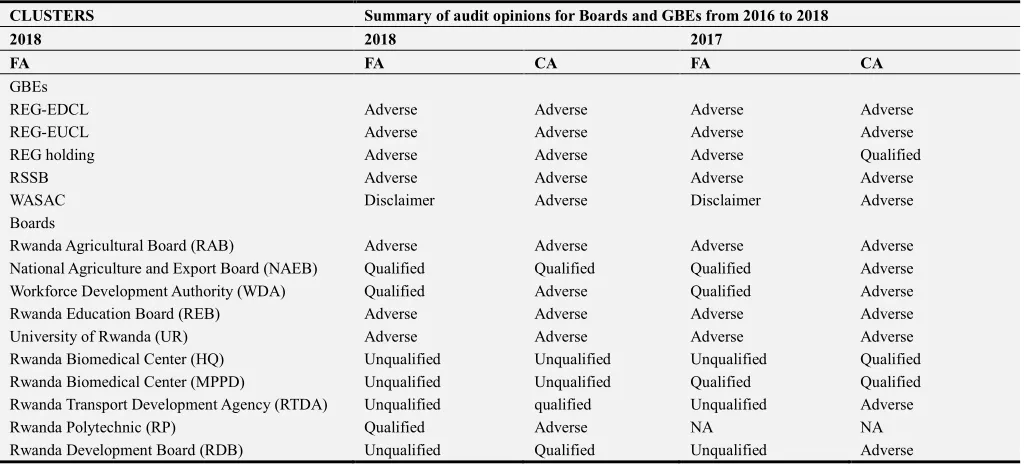
Table 4. Audit opinions and trend for Boards and GBEs from 2016 to 2018.
CLUSTERS Summary of audit opinions for Boards and GBEs from 2016 to 2018
2018 2018 2017
FA FA CA FA CA
GBEs
REG-EDCL Adverse Adverse Adverse Adverse
REG-EUCL Adverse Adverse Adverse Adverse
REG holding Adverse Adverse Adverse Qualified
RSSB Adverse Adverse Adverse Adverse
WASAC Disclaimer Adverse Disclaimer Adverse
Boards
Rwanda Agricultural Board (RAB) Adverse Adverse Adverse Adverse
National Agriculture and Export Board (NAEB) Qualified Qualified Qualified Adverse
Workforce Development Authority (WDA) Qualified Adverse Qualified Adverse
Rwanda Education Board (REB) Adverse Adverse Adverse Adverse
University of Rwanda (UR) Adverse Adverse Adverse Adverse
Rwanda Biomedical Center (HQ) Unqualified Unqualified Unqualified Qualified
Rwanda Biomedical Center (MPPD) Unqualified Unqualified Qualified Qualified
Rwanda Transport Development Agency (RTDA) Unqualified qualified Unqualified Adverse
Rwanda Polytechnic (RP) Qualified Adverse NA NA
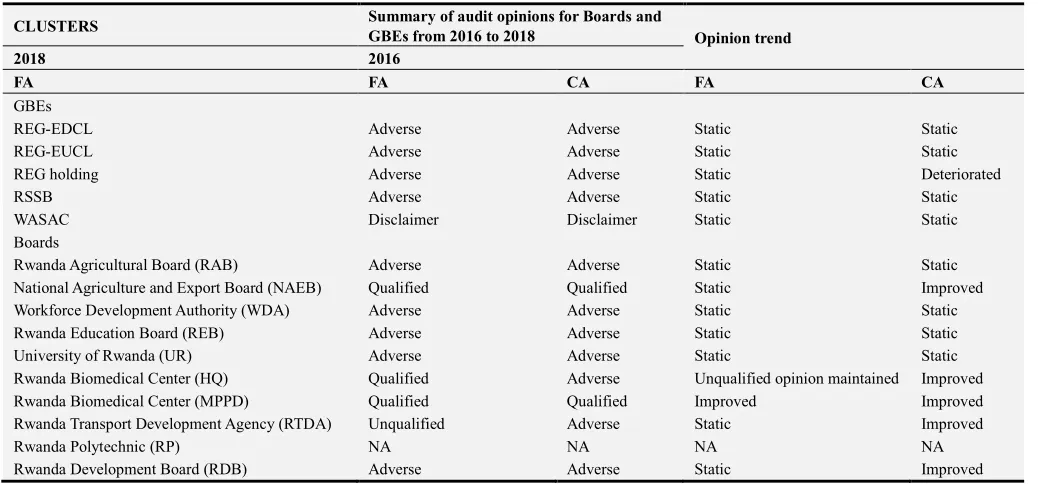
Table 4. Continued.
CLUSTERS Summary of audit opinions for Boards and
GBEs from 2016 to 2018 Opinion trend
2018 2016
FA FA CA FA CA
GBEs
REG-EDCL Adverse Adverse Static Static
REG-EUCL Adverse Adverse Static Static
REG holding Adverse Adverse Static Deteriorated
RSSB Adverse Adverse Static Static
WASAC Disclaimer Disclaimer Static Static
Boards
Rwanda Agricultural Board (RAB) Adverse Adverse Static Static
National Agriculture and Export Board (NAEB) Qualified Qualified Static Improved
Workforce Development Authority (WDA) Adverse Adverse Static Static
Rwanda Education Board (REB) Adverse Adverse Static Static
University of Rwanda (UR) Adverse Adverse Static Static
Rwanda Biomedical Center (HQ) Qualified Adverse Unqualified opinion maintained Improved
Rwanda Biomedical Center (MPPD) Qualified Qualified Improved Improved
Rwanda Transport Development Agency (RTDA) Unqualified Adverse Static Improved
Rwanda Polytechnic (RP) NA NA NA NA
Rwanda Development Board (RDB) Adverse Adverse Static Improved
N/A = in the year under consideration, no audit was performed.
It is noted that Boards and GBEs in general have been predominantly getting adverse opinion in the last 3 years. However, there was a notable improvement for RDB, RBC and RTDA. The current status of audit opinion results for Boards and GBEs is not the most desirable and requires concerted efforts and attention from the various tentacles of the state towards improving these results in the future. There is need for the Office of the Accountant General to put more efforts on the GBEs and Boards to ensure that they scale up financial management. Furthermore, the Boards of Directors should enhance their oversight role aimed at improving Public Financial Management and service delivery [12-16].
4.4. Reporting Provisions
According to Article 166 of the Constitution of the Republic of Rwanda of June 2003 revised in 2015. I am compelled to report on cases of “unnecessary or unlawful expenditures, and whether there was embezzlement or squandering of public funds”. To which under the provisions of Section 2 of Chapter 2 of Law no 79/2013 of 11/09/2013, I have interpreted this provision and classified such expenditure under the technical categories of “Unsupported expenditure, partially supported expenditure, Wasteful expenditure, Unauthorized expenditure, and Funds diverted or fraudulently utilized”.
Table 5. Category of issues noted in government spending.
Description 2018 2017 2016
Frw Frw Frw
Unsupported expenditure 524,138,983 3,286,227,450 6,968,552,037
Partially supported expenditure 2,616,803,323 1,711,072,606 7,416,511,375
Wasteful expenditure 2,208,265,108 2,364,412,097 1,643,449,556
Unauthorised expenditure 196,299,154 244,574,402 699,098,630
Funds diverted or fraudulently utilised 136,307,930 391,193,153 906,654,335
Total 5,681,814,498 7,997,479,706 17,634,265,933
Based on the table above, there has been 68% decline in the Article 166 type of expenditure from Frw 17.6 billion (2016) to Frw 5.68 billion (2018). The biggest decline has been under “Unsupported expenditure” which has declined by 92% from Frw 6.9bln (2016) to Frw 0.6 billion (2018). This is indicative of an improvement in PFM systems and controls when it comes to recording and accounting for expenditure [12-16].
Government has been in the process of recovering fraudulently utilized funds over the years from the
perpetrators of the fraudulent acts.
4.5. Implementation of Auditor General’s Recommendations
Science Journal of Business and Management 2019; X(X): XX-XX 125
improvements envisaged from implementing proposed recommendations to improve public financial management of those entities. The trend on the status of implementation over the past 5 years shows that the rate of implementation of Auditor General’s recommendations is still low. The average
rate of implementation stood at 49% in 2018, representing 5% improvement from the prior year 2017. However, it is noted that government entities are still shy of the all-time high implementation rate of 58% of 2014 [12-16].
Figure 2. Status of implementation of OAG recommendations.
See the summary on status of implementation of prior audit recommendations in table below:
Table 6. Implementation of prior audit recommendations.
Cluster Number of recommendations implemented by management Percentage of recommendations
implemented by management
Total recommendations Fully
implemented
Partially implemented
Not implemented
Fully implemented
Partially implemented
Not implemented
Projects 313 160 75 78 51% 24% 25%
Boards and GBEs 925 407 219 299 44% 24% 32%
Ministries and other central
government entities 327 212 74 41 65% 23% 12%
Districts and city of Kigali 1,631 868 321 442 53% 20% 27%
District hospitals 982 405 113 464 41% 12% 47%
Total 4,178 2,052 802 1,324 49% 19% 32%
5. Conclusion
The number of unqualified audit opinions issued under both compliance and financial audits performed in the years under review is still at an insufficient level. More effort is required especially for the compliance audit discipline whilst from a cluster perspective Districts & City of Kigali and District hospitals also need to do more. The focus on the performance of GBEs as engines of economic growth shows that most GBEs are still getting “Adverse” audit opinions. This situation has been generally static with little or no change at all over the past 3 years as far as audit opinions are concerned. However, credit is due to the “Projects” cluster, which is seen to have contributed significantly to the positive results obtained.
The issues of delayed & abandoned contracts, stalled contracts and idle assets have persisted. It is important for the Government to collectively pay more attention to the root causes of these findings towards making a lasting solution for the development of the PFM system in Rwanda.
6. Recommendations
Basing on the study findings, the following recommendations are forwarded:
There is need for concerted efforts to implement Auditor General’s recommendations by the audited entities to improve public financial management; The current status of audit opinion results for Boards and GBEs is not the most desirable and requires concerted efforts and attention from the various tentacles of the state towards improving these results in the future; There is need for the Office of the Accountant General to put more efforts on the GBEs and Boards to ensure that they scale up financial management; and the Boards of Directors should enhance their oversight role aimed at improving Public Financial Management and service delivery.
References
[2] Law no 79/2013 of 11/09/2013 determining the mission, organization and functioning of the Office of the Auditor General of State Finances.
[3] Ali, A. Gloeck, J. D. Ali, A. Ahmi, A. & Sahdan, M. H. (2007), ‘Internal audit in the state and local governments of Malaysia,’ Southern African Journal of Accountability and Auditing Research, Vol. 7 73-29.
[4] Asare, T. (2008), A Study of the Role of Internal Auditing in the Public Sector of Ghana: Governance and Accountability, M. Sc. Dissertation, Birmingham City University Business School, Birmingham, United Kingdom.
[5] Baltaci, M. & Yilmaz, S. (2006), Keeping an Eye on Subnational Governments: Internal Control and Audit at Local Levels, World Bank Publications, pp. 7-15.
[6] Glass, R. (2005), The Relationship Between Internal and External Audit in the Public Sector, Presentation to the IIA New Zealand Conference 21-23 November 2005.
[7] Griffiths, D. (2006), Risk-based internal auditing - An introduction, available at www.internalaudit.biz (August 21, 2019).
[8] Institute of Internal Auditors (2006a), The Role of Auditing in Public Sector Governance, Altamonte Springs, FL, Institute of Internal Auditors.
[9] OECD (1996), Performance Auditing and the Modernization
of Government, Paris Weariness Performance or Compliance? Performance Audit and Public Management in Five Countries, Oxford, Oxford University Press, pp. 31-56.
[10] Institute of Internal Auditors (2006b), Organizational Governance: Guidance for Internal Auditors, Altamonte Springs, FL, Institute of Internal Auditors.
[11] Pollitt, C. & Summa, H. (1997), ‘Trajectories of Reform: Public Management Change in Four Countries’, Public Money and Management, Vol. 17, No. 1, pp. 8-18.
[12] Report of the Rwanda Auditor General of state finances for the year ended 30 June 2014.
[13] Report of the Rwanda Auditor General of state finances for the year ended 30 June 2015.
[14] Report of the Rwanda Auditor General of state finances for the year ended 30 June 2016.
[15] Report of the Rwanda Auditor General of state finances for the year ended 30 June 2017.
[16] Report of the Rwanda Auditor General of state finances for the year ended 30 June 2018.