Article
A Non-artificial Setting Method for Fault Feeder
Detection Systems Based on Data Fusion Used in
Resonant Grounding Systems
Lixing Zhou1, Junchen Peng 1,*, Zeyu Xu 1, Zhanguo Xia 2, Tao Zhou3
1 Hunan Province Key Laboratory of Smart Grids Operation and Control, School of Electrical and Information Engineering, Changsha University of Science and Technology, Changsha 410114, China [email protected] (L.Z.); [email protected] (J.P.); [email protected] (Z.X.)
2 State Grid Hunan Electric Power Co., Ltd. Loudi City Power Supply Company, Loudi 417000, China; [email protected] (Z.X.);
3 State Grid Hunan Electric Power Exchange Center Co., Ltd., Changsha 410114, China; [email protected] (T.X.);
* Correspondence: [email protected]; Tel.: +86-157-074-96331
Abstract: Fault line detection timely and accurately when single-phase-to-earth fault occurs in
resonant grounding system is still a focus of research. This paper presents a new approach for fault detection based on data fusion and it has non-artificial setting. Firstly, the fault criterion for interphase difference energy ratio and time-frequency correlation coefficient of each line is proposed. Subsequently, the paper establish a coordinate system with the interphase difference energy ratio as X axis and the time-frequency correlation coefficient as Y axis, and it uses the Euclidean distance algorithm to get the characteristic distance of each line by fusing two-dimensional information. Finally, comparing the sound distance and the fault distance of each line to discriminate the fault line. Electromagnetic Transients Program (EMTP) simulation results and adaptability analysis have confirmed the effectiveness and reliability of the proposed scheme.
Keywords: fault line detection, data fusion, non-artificial setting, sound distance, fault
distance, resonant grounding system.
1. Introduction
Power distribution system is widespread and complicated. Due to the advantage of eliminating the instaneous single phase-earth fault automatically and extinguishing arc developed by ground capacitive currents, resonant grounded neutral point is widely used in medium-voltage (MV) distribution system of the world. when a single phase-earth fault occurs,
the configuration allows the distribution system continue to operate 1-2 hours[1-2]. However,
the faulty feeder must be detected within a requied time frame. Traditional fault detection methods have limitations in detecting fault feeders. This is due to the compensation of petersen coil in the resonance grounding system and the fault current at ground point is very low magnitude.
Recently, many faulty feeder detections and protection schemes for the single-phase earth fault have been proposed by scholars, which can be divided into three main categories:1) the protection schemes based on steady-state signals of fault currents; 2) the protection schemes based on transient signals of fault currents; 3) the protection schemes based on the multisource
of the fault information; The first-type methods[3-4] (such as the magnitude of zero-sequence
current, zero-sequence impedance and zero-sequence active power) use the steady-state
signals of fault currents, but it has inherent limitations since the low magnitude of fault
currents. The second-type methods (such as wavelet packet[5-9] transform, Hilbert-transform[10]
and travelling waves [11-12]) are utilized to extract the magnitude and pole characteristic of
transient signals. Due to the influence of fault condition and instability of transient signals,
most of the protection schemes based on these analysis methods are either lack of antijamming capability or just applicable to certain fault conditions. Recently, the second-type methods(such
as clustering analysis[13-14], evidence fusion[15-16], and fuzzy neural[17-18]), collecting all kinds of
fault information and inte-grating all kinds of fault identification approaches, provide an effective approach for single phase-earth fault protection. However, these protection methods huneed complex process.
In order to solve the above problems, the fault criterion for interphase difference energy ratio and time-frequency correlation coefficient of each line is proposed in the paper, and it fuses two criterion to detect the fault feeder by euclidean distance. Therefore, not only does it allow the selection criterion to have a large margin of error, but also the reliability is increased. Section II introduces the characteristic analysis of sudden variable, fundamental theories and
mathematical principles. Section III briefly presents the proposed feature extraction and
formation of data, and Section VI shows the results of the Electromag-netic Transients Program (EMTP) and MATLAB simulation analysis.
2.Characteristic Analysis of Sudden Variable
f
i
1
l
2
l
A
E•
B E•
C E• L
0
u
C 1
i
B 1
i
A 1
i
AC 1
i
BC 1
i i1CC
AC 2
i i2BC i2CC C
2
i
B 2
i
A 2
i
C
1L
i
B
1L
i
A
1L
i
C
2L
i
B
2L
i
A
2L
i
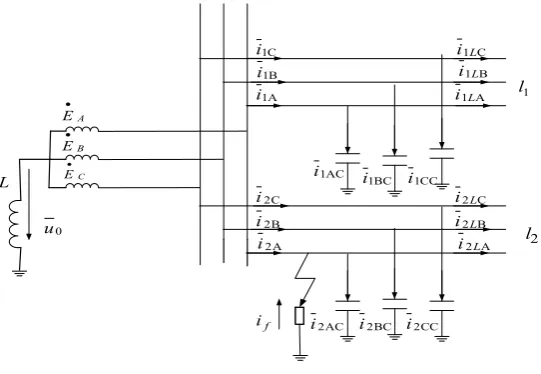
Figure 1. The model char in the context that single phase-earth fault occurs in resonant grounding system.
The characteristics of a sudden variable current is analyzed in a resonant grounding system.
The system diagram is shown in figure 1. Now i1A、i1B、i1C、i2A、i2B、i2C are phase currents
of the three-phases feeder when the single phase-earth fault occurs in phase A, and i1AC、i1BC、
CC
i1 、i2AC、i2BC 、i2CC are the grounding capacity current of the three-phases feeder
respectively, then i1LA、i1LB、i1LC、i2LA、i2LB、i2LC are the load current of the three-phases
feeder respectively. Finally, u0 is the displacement voltage at a neutral point.
In order to detect a difference in the following analysis, the the electric quantity after the failure becomes a variable with superscript, thus the variable without superscript can be the electric quantity before the failure.
The sudden variable Δikpfor each phase at the sound feeder can reach the following
conclusions in the sudden variable for the sound phase at the fault feeder from the reference[19]:
dt u u d C i i
ikp = kp− kp = k ( 0− 0)
Δ
(1)
And the following conclusions can be drawn for the sudden variable Δi2A for the fault
phase at fault feeder 2 from the reference[20]:
f A
A
A i
dt u u d C i i
i = − = − +
Δ ( 0 0)
2 2 2
2
(2)
Therefore, when a single phase-earth fault occurs in the system, sudden variables from three phases at the sound feeder are roughly the same and small in variance The sudden variables of two sound phases at the fault feeder are also roughly the same and small in variance, but the sudden variable of its fault phase is larger than the other phases.
In order to highlight the fault boundary between the fault feeder and the sound feeder, a new concept presented in this paper is to interphase a different energy ratio, which can be obtained by the following equation:
=
= l
k k k k
E E e
1
(3)
Where ek is the interphase difference energy ratio for the first k feeder, and l is the total
number of feeders in the system. Ek is the interphase difference in energy of a sudden
variable from the first k feeder,which can be obtained by the equation as follow:
} ) ) ( ( , ) ) ( ( , ) ) ( (
max{ 2
1 2
1 2
1
kA n
i kC kC
n
i kB kB
n
i kA
k i i i i i i i i i
E =
Δ −Δ
Δ −Δ
Δ −Δ= =
=
(4)
It can be known from the above formula that the interphase difference in energy of a sudden variable will be close to 0 in the sound feeder, whereas the interphase difference in energy of a sudden variable about the fault feeder will be much larger than that of the sound line. Therefore, it can be further known that the interphase difference energy ratio will be close to 1 for the fault feeder, and the interphase difference in energy ratio for the sound feeder will be close to 0, making it easy to distinguish the fault boundary.
3.New Criterion of the Fault Detection Based on Data Fusion
Although the interphase difference energy ratio proposed in this paper can be useful in distinguishing the fault boundary between the fault feeder and the sound feeder, it is not enough to simply apply this criterion only for fault detection.
It is known that the correlation coefficient between any two sound feeders regarding time-frequency subsection is close to 1 by reference [20], while the correlation coefficient between any sound feeder and fault feeder regarding time-frequency subsection is close to -1.
In order to achieve the goal where the final criterion will be more adaptable in detecting fault feeders for resonant grounding systems with complex structures, this paper puts forward a non-artificial setting method for use in fault detection, which combines the correlation
coefficient of time-frequency subsection ρk and interphase difference energy ratio ek.
The reference [21] is based on a correlation coefficient of the time-frequency segmentation. This is calculated by a wavelet packet tool which is able distinguish the fault feeder, however it remains difficult to select the wavelet base on a wavelet packet. To avoid this situation, this paper will calculate the correlation coefficient of time-frequency subsection by S transform.
The correlation coefficient for the time-frequency subsection of the fault feeder is close to
-1, and the sound feeder is close to (l−3) (l−1). Therefore, it is known that the coordinate
point for the sound feeder is close to the sound point ((l−3) ( 1)l− ,0). When the correlation
coefficient of the time-frequency subsection and interphase difference energy ratio are as abscissa and ordinate respectively, then the coordinate point for the fault feeder is close to the
fault point(-1,1). Thus the two euclidean distances from the coordinate point (ek,ρk)for the
feeder to both the fault point and the sound point can be utilized to detect whether a particular
feeder is a fault feeder. They can be identified as fault distance dkf and sound distance dksfor
the feeder. Their relationship is shown as:
1)2 ( )2 3
( k k
ks l e
l
d +
− − −
dkf = (ρk+1)2+(ek−1)2
(6)
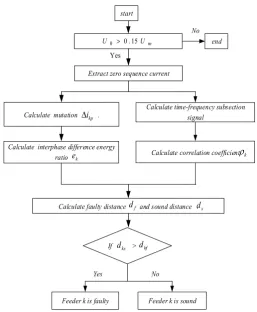
When a single phase-earth fault occurs in the system, the feeder can be regarded as a sound feeder if its sound distance is less than the fault distance for the feeder, or it is fault. The fault should occur in the bus when a single phase-earth fault occurs in the system in the context that the whole feeder is detected as a sound feeder. This method combines the two criteria without artificially setting a threshold value to distinguish the fault boundary. Additional, in comparison to existing intelligent data fusion algorithms, training samples have no effect on this method, making it more practical. The specific criterion flow chart is shown in
figure 2, where U0、Umare zero sequence voltage and rated voltage in system respectively.
start
m
U U0 > 0.15
Extract zero sequence current
Calculate mutation .
Calculate interphase difference energy ratio
Calculate time-frequency subsection signal
Calculate faulty distance and sound distance .
Feeder k is faulty
Calculatecorrelation coefficient
If > .dks f
d
kf
d
kp
i
Δ
k
e ρk
s
d
Feeder k is sound
Yes No
Yes
No end
Figure 2. Flow chart of detecting fault feeder.
4. Simulation Analysis
4.1. Simulation Model
source K
L L1
L2
L3
L4
Load 1
Load 2 Load 3
Load 4 110kV 10kV
Overhead feeder 10km
Cable feeder 5km Overhead feeder
5km
Cable feeder 8km L5 Overhead feeder
20km Load 5
Cable feeder 10km
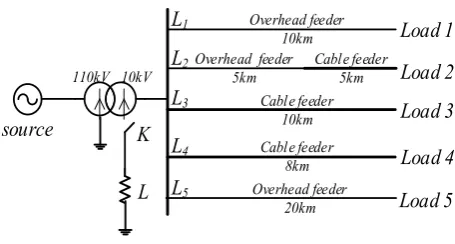
Figure 3. Simulation model char.
Table 1. The parameters of overhead lines
Phase-sequence R (Ω/ km) L(mH/km) C(μF/ km)
Positive-sequence 0.1700 1.2096 0.0097
Zero-sequence 0.2300 5.4749 0.0060
Table 2. The parameters of cable lines
Phase-sequence R (Ω/ km) L(mH/km) C(μF/ km)
Positive-sequence 0.2700 0.2550 0.3390
Zero-sequence 2.7000 1.0190 0.2800
4.2. Simulation Results and Analysis
The feasibility of this method is verified by simulating a set of experiments based on a single phase-earth fault. The simulation conditions are shown below: A single phase-earth
fault occurs in 1km at feeder 1, the initial fault angle θ is 0 , the grounding resistance Rf is
50 Ω, fault phase is A. At this time, the sudden variables of three phase currents at feeder 1to 3
are shown respectively in figure 4~6, and time-frequency subsections are shown respectively in figure 7~9.
Figure 4. Sudden variables of three Figure 5. Sudden variables of three Figure 6. Sudden variables of three phase current at feeder 1. phase current at feeder 2. phase current at feeder 3.
0 1 2 3 4 5
x 10-3 -45
-40 -35 -30 -25 -20 -15 -10 -5 0 5
t/s
am
pl
itu
de/
A
0 1 2 3 4 5
x 10-3 -0.5
0 0.5 1 1.5 2 2.5 3 3.5
t/s
am
pl
itude/
A
0 1 2 3 4 5
x 10-3 0
1 2 3 4 5 6
t/s
am
pl
itude/
Figure 7. Time-frequency Figure 8. Time-frequency Figure 9. Time-frequency subsection signal at feeder 1 subsection signal at feeder 2 subsection signal at feeder 2
It is known from these figures that sudden variables of three phase currents for the sound feeder are basically the same. The sudden variables of two sound phase currents for the fault feeder are also basically the same, but the sudden variable of the fault phase current is larger than either of the two sound phase currents. For the time-frequency subsection, the directions of waveform for the sound feeders are the same, and they are in the inverse direction of the fault feeder.
Interphase difference energy ratios obtained by formula (3) are shown as [1,0,0,0,0]. The correlation coefficient of the time-frequency subsection for each feeder, as obtained by reference [12], are shown as [-0.999, 0.500, 0.500, 0.500]. Therefore, the sound distance and fault
distance for each feeder obtained by the formula (5)、(6) are shown respectively as below [1.802,
0, 0, 0, 0] and [0.001 , 1.803, 1.803, 1.803, 1.803]. Because the fault distance in the feeder 1 is less than the sound distance it can be determined that feeder 1 is the fault feeder.
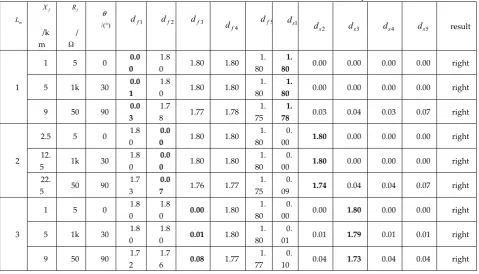
In order to further verify the applicability of this method, simulations are conducted under different fault conditions, including different feeders, different initial phase angles, different grounding resistances, and different locations. Simulation results for fault distance and sound
distance of each feeder are showed in Table III, which Lmis the fault feeder and Xf is location
at the fault feeder.
Table 3. The results about fault distance and sound distance every feeder
m L f X /k m f R / Ω θ
/( )° df1 df2 df3 df4 f5
d ds1
2
s
d ds3 ds4 ds5 result
1
1 5 0 0.0
0
1.8
0 1.80 1.80
1. 80
1.
80 0.00 0.00 0.00 0.00 right
5 1k 30 0.0
1
1.8
0 1.80 1.80
1. 80
1.
80 0.00 0.00 0.00 0.00 right
9 50 90 0.0
3
1.7
8 1.77 1.78
1. 75
1.
78 0.03 0.04 0.03 0.07 right
2
2.5 5 0 1.8
0
0.0
0 1.80 1.80
1. 80
0.
00 1.80 0.00 0.00 0.00 right
12.
5 1k 30
1.8 0
0.0
0 1.80 1.80
1. 80
0.
00 1.80 0.00 0.00 0.00 right
22.
5 50 90
1.7 3
0.0
7 1.76 1.77
1. 75
0.
09 1.74 0.04 0.04 0.07 right
3
1 5 0 1.8
0
1.8
0 0.00 1.80
1. 80
0.
00 0.00 1.80 0.00 0.00 right
5 1k 30 1.8
0
1.8
0 0.01 1.80
1. 80
0.
01 0.01 1.79 0.01 0.01 right
9 50 90 1.7
2
1.7
6 0.08 1.77
1. 77
0.
10 0.04 1.73 0.04 0.04 right
0 2
4
x 10-3 0 5000 -15 -10 -5 0 5 t/s f/Hz am pl itud e/ A 0 2 4
x 10-3 0 5000 -1 0 1 2 3 t/s f/Hz am pl itud e/ A 0 2 4
b us
0 5 0 2.2
3
2.1
5 2.05 2.15
2. 23
0.
50 0.54 0.75 0.54 0.50 right
0 10
00 30 2.2 0
2.2
1 2.05 2.09
2. 22
0.
48 0.50 0.71 0.63 0.49 right
0 50 90 1.5
4
1.9
6 1.83 1.91
2. 00
0.
31 0.24 0.62 0.43 0.25 right
Because of space limitations, only the results for the correlation coefficients of time-frequency subsection are shown in Table IV in the context that increases the contrast. By gathering data from a large number of results, the threshold value of this method can be set as -0.25. From the Table III, it is known that the fault distance and sound distance for a sound feeder are close to 1.8 and 0 respectively. The fault distance and sound distance for a fault feeder are close to 0 and 1.8 respectively. The effectiveness of detection for this method is better by comparing the results in Table IV. This method has a large criterion margin without artificial setting a threshold value, resulting in a higher level of reliability.
5. Conclusions
In order to increase detection reliability, this paper puts forward a non-artificial setting method for fault detection based on data fusion for resonant grounding systems. This method uses euclidean distance algorithm to get the characteristic distance of each line by fusing two-dimensional information. From our theoretical studies and simulation results the following conclusions may be drawn:
(1)When different types of single-phase earth faults occur in the distribution network, the
fault distance and sound distance for a sound feeder are close to 1.8 and 0 respectively, the fault distance and sound distance for fault feeder are close to 0 and 1.8 respectively. Therefore, this method is better able to detect a fault feeder, it can overcome the effects which are
influenced by power grid structure、 fault resistance and initial phase angle.
(2)The fault distance is determined by calculating the sound distance and fault distance of
each line through the euclidean distance algorithm. It is not necessary to manually set the threshold, which improves the reliability of the fault line selection.
(3)This method is more objective and suitable at detecting a fault feeder in complex resonant
grounding systems, therefore it is expected to be useful for practical application.
Acknowledgments: This research is supported by the National Natural Science Foundation of China under Grant(No. 61233008).
Author Contributions: Lixing Zhou conceived and designed the experiments; Junchen Peng wrote and revised the paper; Zeyu Xu performed the experiments and analyzed the experiment data; Zhanguo Xia contributed materials and analysis tools; Tao Zhou provided technical support.
Conflicts of Interest: The authors declare no conflict of interest.
References
[1] J.-A. Jiang, C. L. Chuang, Y. C. Wang, C. H. Hung, J. Y. Wang, and C. H. Lee, “A hybrid framework for fault detection, classification, and location-part I: concept, structure, and methodology,” IEEE Trans.Power Del.
2011, 3, 1988–1998.
[2] A. Kalyuzhny, “Analysis of temporary overvoltages during open-phase fault in distribution networks with resonant grounding,” IEEE Trans. Power Del. 2015, 1, 420–427.
[3] Y. Y. Wang, J. Yuan, X. J. Zeng, and Y. Huang, “A survey on faulty line selection technology for single-phase-ground fault in China,” in Proc. IEEE Ind. Appl. Soc. Annu. Meeting.2013, 1–5.
[5] Z. HaiFeng, Q. YuLin, and J. HuiBin, “Medium voltage distribution network traveling wave fault location method based on wavelet packet energy spectrum”, 2011 International Conference on Advanced Power System Automation and Protection. 2011,3, 1650-1655.
[6] G. V. Torres and P. H. F. Ruiz, “High impedance fault detection using discrete wavelet transform electronics,” in Proc. IEEE Robot. Autom. Mechan. Conf., 2011, 325–329.
[7] Linchun, G., Zhixiong, H.: ‘Research of simulating the small current neutral grounding systems fault line selection based on wavelet packets’, Comput. Eng. Sci., 2008, 3, 103–105.
[8] Ling, W., Ying, S.: ‘Application of continuous wavelet transform to select the fault line of single-phase earth faults in non-solid earthed power system’, Relay, 2004, 11, 20–24.
[9] Linchun, G., Zhixiong, H.: ‘Research of simulating the small current neutral grounding systems fault line selection based on wavelet packets’, Comput. Eng. Sci., 2008, 3, 103–105.
[10]T. Cui, X. Dong, Z. Bo, and A. Juszczyk, “Hilbert-transform-based transient/intermittent earth fault detection in non-effectively grounded distribution system,” IEEE Trans. Power Del. 2011,1, 143-151.
[11]P. Jafarian, and M. Sanaye-Pasand, “A Traveling-Wave-Based Protection Technique Using Wavelet/PCA Analysis,” IEEE Trans. Power Del. 2010,2, 588-599.
[12]Z. Xueliang, Q. Yulin, and L. Guoli, “Research and implementation of PLC for multiport travelingwave fault location in the medium voltage distribution network”,2011 4th International Conference on Electric Utility Deregulation and Restructuring and Power Technologies (DRPT). 2011, 614-617.
[13]M. Koivisto, P. Heine, I. Mellin, and M. Lehtonen, “Clustering of connection points and load modeling in distribution systems,” IEEE Trans. Power Syst. 2013, 2, 1255-1265.
[14]K. R. Sudha, Y. B. Raju, and A. C. Sekhar, “Fuzzy C-means clustering for robust decentralized load frequency control of interconnected power system with generation rate constraint,” Int. J. Elect. Power Energy Syst. 2012, 1, 58-66.
[15]M. Majidi, M. Etezadi-Amoli, and M. Sami Fadali, “A novel method for single and simultaneous fault location in distribution networks,” IEEE Trans. Power Syst. 2015, 6, 3368-3376.
1. H. Xiaoming, “The fault diagnosis of hydraulic pump based on the data fusion of D-S evidence theory,” 2012 2nd International Conference on Consumer Electronics, Communications and Networks (CECNet),
2012, 2982-2984.
[16]J. G. M. S. Decanini; M. s. Tonelli-Neto; C. R. Minussi, “Robust fault diagnosis in power distribution systems based on fuzzy ARTMAP neural network-aided evidence theory,” IET Generation, Transmission & Distribution, 2012, 6, 1112-1120.
[17]L. Yunjia, G. Yiwei, L. Jialiang, and C. Yongjin, “Fault diagnosis method of distributed power distribution network based on advanced Petri net,” 2017 29th Chinese Control And Decision Conference (CCDC),
2013 ,5815-5819.
[18]S. Guobing, L. Guang, Y. Yeyun, C. xinlei, and S. nanjiale, “Single-phase earth fault section location based on phase current fault component in distribution network,” Automation of Electric Power Systems, 2011, 21, 84-90.
[19]G. Moufa, L. Shidan, and Y. Gengjie, “A novel approach to detect fault lines in distribution network using similarity recognition based on time-frequency spectrum ,” Proceedings of the CSEE, 2013, 19, 183-191. [20]W. Yuanyuan, H Yuhao, Z. Xiangjun, F. Tao, W. Gen, and C. Haowei, “Fault feeder detection of single