Final Report
Reducing skin damage and improving
postharvest efficiency of Calypso mango
Dr Peter Hofman
The Department of Agriculture, Fisheries and Forestry
Queensland
Project Number: MG10008
MG10008
This project has been funded by Horticulture Innovation Australia Limited with co-investment from Harvest Markets Pty Ltd and funds from the Australian Government.
Horticulture Innovation Australia Limited (Hort Innovation) makes no representations and expressly disclaims all warranties (to the extent permitted by law) about the accuracy, completeness, or currency of information in Reducing skin damage and proving postharvest efficiency of Calypso mango.
Reliance on any information provided by Hort Innovation is entirely at your own risk. Hort Innovation is not responsible for, and will not be liable for, any loss, damage, claim, expense, cost (including legal costs) or other liability arising in any way (including from Hort Innovation or any other person’s negligence or otherwise) from your use or non-use of Reducing skin damage and proving postharvest efficiency of Calypso mango, or from reliance on information contained in the material or that Hort Innovation provides to you by any other means.
This report was previously confidential.
The confidentiality period has now expired. Please ignore all references to confidentiality within the report.
ISBN 0 7341 3391 X
Published and distributed by:
Horticulture Innovation Australia Limited Level 8, 1 Chifley Square
Sydney NSW 2000 Tel: (02) 8295 2300 Fax: (02) 8295 2399
© Copyright 2016
MG10008
(31 May 2014)
Reducing skin damage and
improving post-harvest efficiency of
Calypso mango
Peter Hofman et al
Reducing skin damage and improving
post-harvest efficiency of Calypso mango: Phase III
HAL Project Number: MG10008
Project Leader: Dr Peter J. Hofman, Senior Principal Horticulturist, Agri-Science Queensland, Department of Agriculture, Fisheries and Forestry (DAFF), PO Box 5083 SCMS, Nambour 4560. Phone (07) 5453 5968; Mob. 0407 173 608; email [email protected]
Project Personnel:
Prof Daryl Joyce , Agri-Science Queensland, DAFF, GPO Box 267, Brisbane Qld 4001, and The University of Queensland, Gatton, Qld 4343. Mob 0428867804; email
Dr Andrew Macnish, Senior Horticulturist, Agri-Science Queensland, DAFF, PO Box 5083 SCMS, Nambour 4560. Mob 0407 525 435: email [email protected].
Dr Roberto Marques, past Research Horticulturist, Agri-Science Queensland, DAFF, PO Box 5083 SCMS, Nambour 4560;
Mrs Barbara Stubbings, past Senior Technician, Agri-Science Queensland, DAFF, PO Box 5083 SCMS, Nambour 4560;
Dr Anthony W. Whiley, Sunshine Horticultural Services Pty Ltd, 287 Dulong Road, Nambour 4560. Mob. 0427 411 541; email [email protected]
Kieren Brown and Rob Gray (past Business Manager), Harvest Fresh Fruits, PO Box 180, Carole Park 4300. Mob. 0409 584 274
PhD students Minh Nguyen, Guoqin Li and Tram Anh, DAFF and The University of Queensland Dr Justin Davies (ph 02 9717 9002) and Connie Banos (02 9717 3441), Australian Nuclear Science and Technology Organisation, Kirrawee, NSW
This is the final report for MG10008: “Reducing skin damage and improving post-harvest efficiency of Calypso mango: Phase III
Acknowledgments:
This project has been funded by HAL using voluntary contributions from Harvest Fresh Fruits (One Harvest) and matched funds from the Australian Government. The Queensland
Government has also co-funded the project through the Department of Agriculture, Fisheries and Forestry with further support provided by the University of Queensland, Australian Institute of Nuclear Science and Engineering and Sunshine Horticultural Services Pty Ltd. We wish to thank Oolloo Farm Management, Acacia Hills Farm, Sam and Kylie Collins, Willem and Gabbie Bezuidenhout and Simpson Farms, for excellent support during the project. We also thank the Ph.D. students involved in this project, whose hard work constitutes a significant proportion of this report.
SHS
Disclaimer
Any recommendations contained in this publication do not necessarily represent current HAL policy. No person should act on the basis of the contents of this publication,
whether as to matters of fact or opinion or other content, without first obtaining specific,
Contents
1. General introduction ... 1
2. Technical summary ... 3
3. Media summary ... 4
4. Improving the external appearance of the fruit ... 5
4.1. Changes in lenticels during fruit growth ... 5
4.1.1. Summary ... 5
4.1.2. Introduction ... 5
4.1.3. Materials and methods ... 6
4.1.4. Results ... 9
4.1.5. Discussion ... 15
4.2. Lenticel changes during harvesting and ripening ... 17
4.2.1. Summary ... 17
4.2.2. Introduction ... 17
4.2.3. Materials and methods ... 17
4.2.4. Results ... 19
4.2.5. Discussion ... 21
4.3. Effects of production factors ... 22
4.3.1. Summary ... 22
4.3.2. Introduction ... 23
4.3.3. Materials and methods ... 23
4.3.4. Results and discussion ... 29
4.4. Reducing lenticel discolouration with irrigation ... 38
4.4.1. Summary ... 38
4.4.2. Introduction ... 38
4.4.3. Materials and methods ... 39
4.4.4. Results ... 43
4.4.5. Discussion ... 52
4.5. Pre-harvest bagging and coatings ... 54
4.5.1. Summary ... 54
4.5.2. Introduction ... 54
4.5.3. Materials and methods ... 55
4.5.4. Results ... 57
4.5.5. Discussion ... 65
4.6. Impact of crop load on lenticel discolouration ... 67
4.6.1. Summary ... 67
4.6.2. Introduction ... 67
4.6.3. Materials and methods ... 67
4.6.4. Results and discussion ... 68
4.7. Harvesting effects ... 70
4.7.1. Summary ... 70
4.7.2. Introduction ... 70
4.7.3. Materials and methods ... 71
4.7.4. Results and discussion ... 72
4.8. Brushing and water effects ... 76
4.8.1. Summary ... 76
4.8.2. Introduction ... 76
4.8.4. Results ... 79
4.8.5. Discussion ... 84
4.9. Time from packing to retailer ... 85
4.9.1. Summary ... 85
4.9.2. Introduction ... 85
4.9.3. Materials and methods ... 86
4.9.4. Results ... 86
4.9.5. Discussion and conclusions ... 91
5. Market access ... 93
5.1. Effect of maturity on lenticel discolouration ... 93
5.1.1. Summary ... 93
5.1.2. Introduction ... 93
5.1.3. Materials and methods ... 94
5.1.4. Results and discussion ... 96
5.1.5. Trial One: Maturity and irradiation ... 96
5.2. Cultivar responses to irradiation ... 102
5.2.1. Summary ... 102
5.2.2. Introduction ... 102
5.2.3. Materials and methods ... 103
5.2.4. Results and discussion ... 106
5.2.5. Conclusions ... 117
5.3. Preventing browning - antioxidants ... 119
5.3.1. Summary ... 119
5.3.2. Introduction ... 119
5.3.3. Materials and methods ... 120
5.3.4. Results and Discussion ... 121
5.3.5. Conclusions ... 126
5.4. Preventing browning - postharvest coatings ... 127
5.4.1. Summary ... 127
5.4.2. Introduction ... 127
5.4.3. Materials and methods ... 128
5.4.4. Results and discussion ... 129
5.4.5. Conclusions ... 134
5.5. Preventing browning - postharvest bagging ... 135
5.5.1. Summary ... 135
5.5.2. Introduction ... 135
5.5.3. Materials and Methods ... 136
5.5.4. Results and discussion ... 141
5.5.5. Conclusions ... 154
5.6. Improving yellow skin colour after irradiation ... 155
5.6.1. Summary ... 155
5.6.2. Introduction ... 155
5.6.3. Materials and methods ... 155
5.6.4. Results and discussion ... 158
5.7. Irradiating ripening fruit at several doses ... 162
5.7.1. Summary ... 162
5.7.2. Introduction ... 162
5.7.3. Materials and methods ... 163
Dose (Gy) ... 170
Irradiated 3 days after harvest ... 170
Irradiated 8 days after harvest ... 170
Not irradiated ... 170
6. Increasing fruit size - Screen ... 171
6.1.1. Summary ... 171
6.1.2. Introduction ... 171
6.1.3. Materials and methods ... 172
6.1.4. Results and discussion ... 172
6.1.5. Conclusions ... 174
7. Increasing the harvest window ... 176
7.1. Manipulating flowering time ... 176
7.1.1. Summary ... 176
7.1.2. Introduction ... 176
7.1.3. Materials and methods ... 177
7.1.4. Results and discussion ... 178
7.2. How long can the fruit hang on the tree? ... 180
7.2.1. Summary ... 180
7.2.2. Introduction ... 180
7.2.3. Materials and methods ... 181
7.2.4. Results and discussion ... 182
8. Fruit movement in the paddock ... 190
8.1. Assessment of improvements to in-field movement of fruit ... 190
9. In-transit ripening ... 193
9.1. Temperature, ethylene and carbon dioxide control ... 193
9.1.1. Summary ... 193
9.1.2. Introduction ... 193
9.1.3. Materials and methods ... 194
9.1.4. Results ... 199
9.1.5. Conclusions and recommendations ... 213
9.2. High CO2 concentrations during ripening ... 215
9.2.1. Summary ... 215
9.2.2. Introduction ... 215
9.2.3. Materials and methods ... 215
9.2.4. Results and discussion ... 217
10. Technology transfer ... 220
10.1. Pre- and post season meetings and training ... 220
10.2. Publications and conference presentations ... 220
10.3. Quality assessment and best practice manual ... 221
11. Recommendations ... 221
12. References ... 223
1. General introduction
‘B74’ mango (trading as CalypsoTM) was bred and developed at Childers, SE Queensland. It
is the progeny of ‘Sensation’ and ‘Kensington Pride’ and carries the best attributes of both parents. The cultivar has reliable flowering and is highly productive, yielding more than 25 t.ha-1 from mature orchards. The fruit is highly coloured with a red blush overlaying a bright
yellow skin when ripe. The flesh is fibre-free and firm with a distinctive mango flavour. The cultivar has good tolerance to flower and fruit diseases with extended retail shelf life. At least 80% of the crop reaches premium grade, conforming to the preferred colour and size
required by Australian retailers. The cultivar has excellent export potential into Asian, Middle Eastern and European markets.
The owners of the cultivar realised that a whole of chain approach was required to maximise the genetic potential of the cultivar. This includes both the commercial aspects (the need for an extended market season, close teamwork between chain members etc) and the R&D support. Commercial production and distribution quickly identifies the genotypic weakness in a cultivar, which provides a focus for an integrated whole of chain R&D program over an extended period. Using this philosophy, the previous two 3-4 year research projects (FR02049 and MG06005) achieved considerable progress in understanding nutritional requirements, postharvest handling systems, maturity standards, ripening practices, and export practices of ‘B74’ mango across the main production environments, with a clear focus on profitability for the chain members (including growers) and delivering on customer and consumer preferences.
The projects and continued commercial experience identified new opportunities to further improve cultivar performance, which were the foci for the R&D program reported here. These included:
1. Improving external appearance for export markets requiring irradiation against fruit fly and other quarantine pests (seed weevil etc). The previous project and commercial experience confirmed that ‘B74’ fruit often develop extensive lenticel discolouration (LD) following irradiation, and even without irradiation LD can be a significant issue for the domestic market. Project MG06005 confirmed that exposure to water after harvest (e.g. in the desapping solutions used to improve harvest efficiency and prevent sapburn) significantly increases lenticel sensitivity, and overseas research and local commercial experience suggested excessive rain during latter fruit growth can have the same effect. Hence, this project studied the development of LD on ‘B74’ during growth and fruit ripening compared with other cultivars, and whether reducing irrigation or preventing contact with water before and after harvest can reduce LD.
In addition, the discolouration is likely a browning reaction requiring oxygen, so research focussed on whether the reduction of oxygen around the fruit during
irradiation and ripening, or the use of antioxidants, can reduce LD. A more controlled assessment of dose responses of ‘B74’ to irradiation was also undertaken.
2. In transit ripening. Current recommendations for Australian mangoes requiring more than 2-3 d transit time from farm to ripener is to cool on farm to 12-13°C within 24 h of harvest, and transport at this temperature. However, ripening in transit has several significant cost advantages. These include reducing on-farm precooling and in-market ripening room floor space, reducing the time from harvest to in-market allowing access to higher prices at the start of the season, and reducing energy requirements by not cooling the fruit as much on-farm, running the trucks at higher temperatures, and not requiring warm-up of fruit in market before ripening. Technical challenges and risks with this approach were researched in this project.
infrastructure. The potential to extend the harvest window was examined by looking at whether the maturity dates can be shifted by manipulating flowering time, and how long the fruit can hang on the tree.
2. Technical summary
‘B74’ (marketed as CalypsoTM) mango (Mangifera indica L.) commercialisation in Australia has been done with a supply chain focus, with production being spread from tropical to sub-tropical latitudes to ensure consistent fruit supply over the mango season, and an R&D support program to maximise its genetic potential in each of these environments. This project is the third phase of the R&D program and focussed on the most promising opportunities for ‘B74’ chain development.
‘B74’ mango fruit have an attractive ripe skin colour but small spots from discoloured lenticels often appear on the skin, especially after harvest. This study found that ‘B74’ fruit have 3-4 times higher lenticel density than the other main mango cultivars, which is a characteristic inherited from the paternal parent (‘Sensation’). This may explain why ‘B74’ is generally more susceptible to lenticel discolouration (LD) after harvest compared with ‘Kensington Pride’ and ‘Honey Gold’. The discolouration appears to be due to accumulation of phenolics compounds in the cells around the cavity.
Trials indicated that LD varies significantly across locations and seasons. Fruit from the hotter farms had less LD at ripe, and LD in the ripe fruit was less in smaller and more mature fruit, fruit with more blush, and from trees that had more uniform flowering, and from trees with smaller canopy area. However, these parameters accounted for only 32-35%of the variance in LD. Also, more severe LD has been associated with rain before harvest.
Withholding irrigation from Katherine-grown trees for 3-8 weeks before harvest showed little evidence of strong effects on tree and fruit water relations. The treatments had no effect on average tree yield or fruit size, and withholding irrigation for 3-4 weeks actually increased LD after irradiation. Other options were tested for reducing fruit contact with water during growth. Bagging the fruit with paper and spraying with a carnauba-based wax before harvest reduced LD in the ripe fruit but the wax treatment needs commercial testing.
The discolouration of the lenticels is likely due to an oxidation reaction. However, holding the fruit in plastic bags or using fruit coatings to reduce the oxygen concentration around the fruit during irradiation, or using antioxidant dips before ripening, did not reduce LD. The most promising approaches to reduce LD were eliminating water from the harvesting and packing procedures, and irradiating near ripe fruit. However, the impacts of these treatments on the whole chain needs to be considered. Higher ripening temperatures and longer treatment with ethylene did not overcome the delayed loss of green colour during ripening following
irradiation.
Research to increase the harvest window focussed on flowering time and how long the fruit can hang on the tree. Ethephon® trials had potential but were suspended pending
registration. Removing flowers in the Katherine environment to encourage later flowering resulted in significant crop loss. Late hanging trials in the major production districts suggested that the harvest window was about 10 days longer in the two farms in the NT, perhaps because the fruit attained the minimum maturity more quickly.
Several options for reducing machinery and labour requirements for transport of half ton bins with fruit from the field to the on-farm fruit store were tested, including in-field transfer points and flat bed trucks. The most promising alternatives are six bin runners and possibly larger harvest aids that can deposit the bin directly onto flat bed trucks.
The ability to ripen fruit in transit from farm to market will reduce energy costs and
3. Media summary
‘B74’ mango (marketed as CalypsoTM) was bred at Childers in subtropical Queensland
specifically to overcome the inconsistent production of the cultivar ‘Kensington Pride’. Ongoing research is maximising its genetic potential in the main production regions. ‘B74’ mango fruit develops an attractive blush during growth and a full yellow skin colour when ripe, but small spots from damaged lenticels often appear on the skin. This affects the visual appeal but does not affect the flesh; nevertheless the value of the fruit is reduced. The project confirmed that fruit can have less LD if they are grown in hotter production, are smaller and more mature, have more blush, and are from trees that had more uniform flowering or smaller canopy area. However, these parameters accounted for only 32-35% of the variation in LD. Not irrigating the trees for 3-8 weeks before harvest may “dry” the fruit out and make them more resistant to LD but this was not observed. ‘B74’ is more prone to this lenticel discolouration (LD) than most other Australian mango cultivars, most likely because it has 3-4 times higher lenticel density on the fruit surface at harvest.
LD is worse when the fruit are exposed to water either from rain or during harvesting. In order to reduce contact with water, the fruit were paper bagged (done commercially in apple and other fruit in Japan), or sprayed with a carnauba-based wax, two months or several days before harvest, respectively. Both treatments reduced LD in the ripe fruit. Bagging is labour-intensive but may be profitable for high value markets, and wax sprays need commercial testing with whole tree spraying.
LD is likely due to an oxidation reaction, similar to when cut apple turns brown. Reducing oxygen around or in the fruit, or using anti-oxidants may reduce the browning reaction. However, holding the fruit in plastic bags, fruit coatings and antioxidant dips before ripening had either no effect. The most promising approaches were eliminating water from the harvesting and packing procedures, and irradiating fruit for export when they were about three days from ripe. Both approaches add extra challenges to the harvest-to-consumer chain, but they may have application is certain circumstances.
Mango fruit need to be harvested within 2-4 weeks of reaching minimum maturity to prevent fruit from falling from the tree. This short harvest window results in challenges with picking teams and equipment. Trials attempted to induce earlier or later flowering the spread the harvest window in the hotter production areas. Trials with Ethephon® sprays indicated its potential to stimulate earlier flowering. Removing flowers in the Katherine environment to encourage the trees to re-flower was unsuccessful.
The ability to ripen fruit in transit from farm to market will reduce energy costs and
infrastructure requirements in market. Commercial tests indicated that the newer 12 m rail containers can retain ‘B74’ fruit temperatures at about 18ºC, and several systems to manage carbon dioxide and ethylene concentrations (both important in fruit ripening) can be
4. Improving the external appearance of the fruit
4.1. Changes in lenticels during fruit growth
Minh Nguyen (PhD candidate), Peter Hofman, Daryl Joyce, Andrew Macnish, Madan Gupta
This chapter forms part of a current PhD program (Minh Nguyen). The results presented here have not yet been published. The chapter was drafted by the Ph.D. student, and reviewed by the project team.
4.1.1. Summary
Lenticels are small openings on the surface of some fruit, including mango. They are thought to originate from functional stomata on the young fruit that contribute to water and gas exchange. These stomata become non-functional as the fruit grows and develop into non-structured micro-pores in the mature fruit. These lenticels can become discoloured during late fruit growth and after harvest, resulting in lenticel discolouration (LD) that reduces value. More study is needed to fully understand how lenticels develop during fruit growth and ripening, especially for the main mango cultivars in Australia.
This study found that, unlike ‘Kensington Pride’ (‘KP’), ‘Honey Gold’ (‘HG’) and ‘R2E2’ cultivars, the number of lenticels on ‘B74’ fruit continually increased until near fruit maturity, suggesting additional origins apart from the young fruit stomata. At harvest, ‘B74’ had 3-4 times more lenticels per fruit and lenticel density than ‘Kensington Pride’, ‘Honey Gold’ and ‘R2E2’, but less than ‘Sensation’. Lenticel cavity size increased with expansion of the fruit surface, but a larger proportion of the lenticels in ‘B74’ had smaller cavities compared to ‘KP’ because of their later formation in fruit growth. There was a positive correlation between lenticel aperture diameter and total fruit surface area. Morphological examination indicated that phenolics accumulated in the cells around the lenticel cavity as LD developed. No cutin was seen covering the cells facing the lenticel cavity, and there was no obvious association between resin ducts and LD. Wax possibly plays an important role in protection of lenticels, but wax covering lenticels may shear and crack as lenticel cavities enlarge during fruit development, thereby reducing this protective effect.
4.1.2. Introduction
Lenticels are microscopic openings on the surface of some fruit. However, the lenticels can discolour in mature and ripe fruit in many mango cultivars, resulting in darkened areas around the aperture and reducing appearance and commercial value (Tamjinda et al., 1992). Some research has been undertaken to understand the ontogeny and morphology of
lenticels from early fruit growth until maturity. Most lenticels of ‘Tommy Atkins’ mango originate from existing stomata that become progressively non-functional and rupture when the fruit are about 20-30 mm diameter (Bezuidenhout et al., 2005). Lenticels in
‘Namdokmai’ mango form under each stoma on the fruit skin (Tamjinda et al., 1992).
However, (Dietz et al., 1988b) stated that lenticels may develop from stomata or cracks in the cuticle.
The nature and cause of lenticel discolouration (LD) is still not clear, including why LD effectively only develops in later maturity or as the fruit ripen. More study is needed to fully understand how lenticels originate and develop during fruit growth and ripening, especially for the main mango cultivars in Australia.
The expression of LD varies with mango cultivar. In studies by (du Plooy et al., 2004) ‘Keitt’ mango exhibited the most LD and ‘Kent’ mango the least, with ‘Tommy Atkins’ being
and wax layer lining the cavity. Cell wall thickness may also play a role in LD (Tamjinda et al., 1992). For example, the walls of the cells lining the lenticel cavity in LD-sensitive ‘Namdokmai’ mango were thinner than those of the more LD resistant ‘Falan’ cultivar (Tamjinda et al., 1992). (Bezuidenhout et al., 2005) suggested that the absence of a cork cambium and cork cells in the cavity contributed to LD because of the inability to replace damaged cells. Also lenticel aperture, dimensions, density and distribution may influence LD severity.
Previous research indicated that dipping ‘B74’ fruit in deionised water for 2 min after harvest was sufficient to increase LD on the ripe fruit, and especially following irradiation (Hofman et al., 2010a). Thus, evaluating the potential for water uptake into lenticels and the surrounding cells, for example immersing the fruit in a dye solution, may indicate the potential for LD. For example, studies showed that lenticels with micro-cracks in the wax layer of the lenticel cells increased the potential for LD (Curry and Kupferman, 2004). This effect may be via water increasing lenticel cell turgidity (Cronje, 2009a). The potential for water movement into a small cavity (e.g. the stomate or lenticel) is related to the wetting angle of the surface (Mexal et al., 1975). An aqueous solution containing a surfactant can spread completely on the fruit surface and easily infiltrate into stomata or lenticel (Peschel et al., 2003). The fruit cuticle layer can change during fruit growth (Bally, 1999) and likely varies with cultivar, so studying the fruit surface wetting angle may indicate differences in the potential for water entry into lenticels.
To provide a better understanding for lenticel development, the reasons for differing LD sensitivity among Australian mango cultivars, and potential measures to reduce LD in ‘B74’, a chronological morphology and comparative study of ‘B74’, ‘Kensington Pride’ ‘Honey Gold’, ‘R2E2’ and ‘Sensation’ was undertaken. Fruit were examined at one month after full bloom until harvest at intervals of 1-2 months.
4.1.3. Materials and methods
4.1.3.1. Fruits
During 2011/2012, fruit samples were collected from commercial ‘B74’ mango trees at Childers, south east Queensland (25°14’S, 152°37’E). Three other cultivars, ‘KP’, ‘HG’ and ‘R2E2’ were collected from a commercial farm in Bundaberg, south east Queensland (24°98’S, 152°09’E), as comparators. In 2012/2013, ‘B74’ and ‘KP’ fruit were collected from the Childers farm and ‘HG’ and ‘R2E2’ were collected at the green mature stage from the Bundaberg farm. In 2013-2014, ‘B74’, ‘KP’ and ‘Sensation’ fruit were collected from an orchard near Mareeba, north Queensland (17°10’S, 145°46’E).
4.1.3.2. Sampling
From one month after full flowering through to maturity, fruits were randomly harvested at intervals of approximately one month in the first two seasons, and at intervals of two months in the last season. Five mango trees of each cultivar were used. The fruit were sampled from approximately 1-1.5 m height from all four aspects on each tree. When fruits were immature, 30 fruit from the five trees were harvested at each collection date. For wetting angle
assessment, fruits were placed upside down into a nail board in order to prevent surface damage. Fruits were then transferred by plane or car that day to the Maroochy Research Facility (MRF), Nambour, Queensland for assessment the following day.
4.1.3.3. Assessments
Fruit surface area
LG
SG SL
θc
LG
SG SL
θc
Fruit surface area (cm²) = 2пb[(b + a²/(a² − b²)1/2) x arcsin ((a²-b²)1/2/a)]
where п = 3.1415; a: polar radius (cm); b: equatorial radius (cm).
Dye uptake
Ten fruit were used to assess dye uptake characteristics using a temperature differential approach. The fruit and a food dye solution of “Brilliant Blue” (1 g.L-1 in tap water) were
equilibrated at 25°C and the solution and fruit core temperatures monitored. The fruits were submerged into the dye and placed for 16 h at 12°C. Upon removal, the fruits were rinsed three times in running tap water and then blotted with paper towel. The dye uptake was recorded using a spotty dye (diameter of dyed spot <1 mm) uptake rating scale with calibration images as following:
1 = No spotty dye uptake;
2 = Minor spotty dye uptake by lenticels (<10% of fruit surface area); 3 = Spotty dye uptake by lenticels on 11-30% of fruit surface area; 4 = Spotty dye uptake by lenticels on 31-50% of fruit surface area; 5 = Spotty dye uptake by lenticels on 51-70% of fruit surface area; and 6 = Spotty dye uptake by lenticels on > 70% of fruit surface area.
The proportion (%) of dyed lenticels was calculated as the percentage of dyed lenticels/total lenticels in four circles (2 cm diam.) on the fruit equator. Dyed and non-dyed lenticels were counted using a magnification glass (Maggylamp model M.L. Apppro. No. 2141; Newbound Balmain).
Wetting angle
Ten fruit were used to measure wetting angle with 5 μL DI water droplets (Lamour and Hamraoui, 2010). The contact angles were measured in the middle of the cheeks at eight points around the equator of each fruit. Fruits were firmly positioned, with the selected test point in the horizontal direction and the droplet carefully placed on the fruit. At equilibrium, the contact angle between the droplet and the fruit surface (θcin Plate 1) was photographed
with a Canon DOS40D camera fitted with a Canon macro-lens EF-S 60 mm. The contact angles from the images were measured using Image-J software.
Plate 1 The wetting angle between a water droplet and the surface, with the wetting angle shown as θc
Plate 2 Locations on the fruit surface used to examine lenticel distribution around the fruit
Lenticel density and distribution
peeled and placed on a slide. Lenticel counts were made at random in five fields of view per nail polish strip under the light complex microscope at x 400 magnification (Kakani et al., 2003). For mature fruits, the lenticel number in each 3 cm2 circle was counted using a
magnifying glass, and then checked using a dissecting microscope (TYP 376788 Wild Heerbrugg, Switzerland). Image-J software was also used to check lenticel counts with a Canon DOS40D camera and a Canon macro-lens EF-S 60 mm. The lenticel density was determined as the total number of lenticels per unit surface area (Schotsmans et al., 2004).
Diameter of lenticel openings on the fruit surface
The diameter of the lenticel opening was quantified by excising skin sections from five positions (cheek, stem end, bottom, convex and deepsite) using a razor blade. The sections were incubated for 2 min in 0.1% acridine orange which fluorescence stains cell walls, RNA and DNA, then blotted and transferred to the stage of a Olympus BH-2 epifluorescence microscope with a Olympus HBO 103 W/2 burner, and viewed at 100-200x magnification. Lenticel opening dimensions were measured using an eye piece micrometer which was calibrated using a haemocytometer (Kakani et al., 2003; Khanal et al., 2011).
Lenticel morphology
Five fruit were used for lenticel morphology. From each fruit, five 2 x 3 x 3 mm sub-samples were cut. Sections were either fresh by hand, or after serial fixation in FAA solution (95% ethyl alcohol, 50 mL: glacial acetic acid, 5 mL: 37% formaldehyde, 10 mL: distilled water, 35 mL), dehydration in an ethanol series (twice in 50%, then once in 70%, 90%, 95% and 100% twice; 2h in each step), infiltration (100% xylene with paraffin pieces added one by one until saturation), embedding in paraffin wax (Paraplast Plus, Sigma), and sectioning on a
microtome (Interlaps) at 5-7 μm. The sections were stained with either “Toluidine Blue” which stains polyphenols blue-green or “Sudan IV” which stains lipids in the fruit cuticle red.
Sections were examined under a light compound microscope (Nikon Eclipse TS100) and photographed using a Canon DOS40D camera. About 20 lenticels were examined per treatment to estimate typical treatment effects.
Lenticel discolouration assessment
Ten fruits from each of the five trees were used to evaluate lenticel discolouration at harvest and during ripening using the 0-5 score of (Hofman et al., 2010a) as described in Table 1.
Table 1 Rating scales for lenticel discolouration on the skin of ‘B74’ mango
Rating Lenticel discolouration* 0 Nil
1 Light spots on not more than 25% of the surface or dense pronounced spots on not more than 5% of the surface; not cracked
2 Light spots on not more than 50% of the surface or dense pronounced spots on not more than 10% of the surface; not cracked
3 Scattered pronounced spots on not more than 50% of the surface, or dense pronounced spots on not more than 25% of the surface; not cracked 4 Dense pronounced spots on not more than 50% of the surface
5 Dense pronounced spots on more than 50% of the surface
*The rating refers to the percentage of the overall area of skin affected by lenticel discolouration. Dense = spots no more than 5mm apart. Light = ‘pinprick’ size. Pronounced = more than half pinhead size, dark coloured.
4.1.3.4. Statistical analysis
P=0.05 was used to test for differences between treatment means (LD, wetting angle and dye uptake).
4.1.4. Results
4.1.4.1. Stomatal/lenticel number
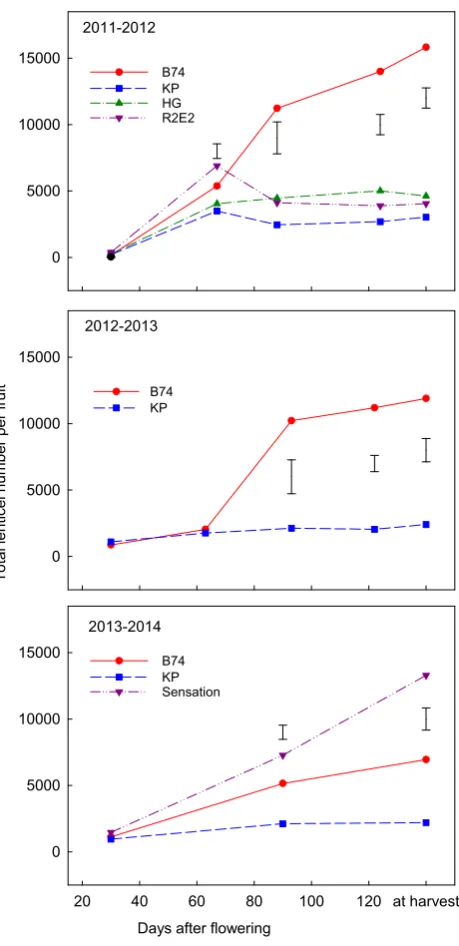
The total number of lenticels on ‘B74’ fruit increased rapidly from fruit set until about three months after full flowering in all three seasons, then either slowed or increased very little (Figure 1). In contrast, total lenticel numbers on ‘KP’, ‘HG’ and ‘R2E2’ were considerably less than ‘B74’, which increased from fruit set until two months after full flowering, and thereafter decreased slightly (2011/12) or changed little. Lenticel number in ‘Sensation’ increased continually to maturity and was almost twice the number as ‘B74’.
2011-2012
0 5000 10000 15000
B74 KP HG R2E2
2012-2013
0 5000 10000 15000
B74 KP
2013-2014
Days after flowering
20 40 60 80 100 120 at harvest
T
otal
lenticel number per f
ruit
0 5000 10000
15000 B74
KP Sensation
Harvest Season
2011-2012 2012-2013 2013-2014
Lenti cel D ens ity ( pe r c m 2 ) 0 20 40 60 B74 KP HG R2E2 Sensation b a c c a b ab c a b a
Fruit Surface Area (cm2)
0 100 200 300
Lenti cel O peni ng Di am eter ( m) 20 40 60 80 100 120 140 160
2 months 3 months
4 months
At harvest
KP: r2 =0.99
B74: r2 =0.73
2012-2013 2013-2014
0 100 200 300
KP: r2 = 0.99
B74: r2 = 0.87
Sensation: r2 = 0.98 4.1.4.2. Stomatal/lenticel density
Lenticel density of ‘KP’, ‘HG’ and ‘R2E2’ at harvest was similar, and varied from 5-15
lenticels per cm² (Figure 2). The lenticel density of ‘B74’ fruit was consistently higher than the above cultivars in all three years. In 2013/14, ‘Sensation’ had considerably higher lenticel density than ‘B74’ from the same farm.
Figure 2 Lenticel density of ‘B74’, ‘KP’, ‘HG’, ‘R2E2’ and ‘Sensation’ mango at harvest. Means in year group with the same letters are not significantly different (P=0.05) as tested by LSD.
4.1.4.3. Lenticel aperture diameter and fruit surface area
Fruit surface expanded rapidly during development (Figure 3). Between 2-3 months after full flowering, the fruit surface area doubled for both ‘B74’ and ‘KP’ and continued to increase from three to four months. The lenticel aperture diameter increased slowly between two and three months and more rapidly between three and four months for both ‘B74’ and ‘KP’.
Figure 3 Relationship between lenticel opening diameter and fruit surface area during fruit
There were strong positive correlations between fruit surface area and lenticel aperture diameter for ‘KP’, ‘B74’ and ‘Sensation’ (Figure 3). At green mature, ‘KP’ had the highest lenticel opening diameter while ‘Sensation’ had the lowest.
4.1.4.4. Lenticel distribution
There were some significant differences in lenticel distribution in the four cultivars (Table 2). In ‘B74’, the highest density of lenticels occurred in the convex area. In ‘KP’ and ‘HG’ fruit, there was a higher density at the bottom compared with the stem end. ‘B74’ again had considerably higher density that the other cultivars.
Table 2 The distribution of stomata/lenticels on the surface of mature green ‘B74’, ‘KP’, ‘HG’ and ‘R2E2’ mango fruit in 2011/12. The fruit locations are described in Plate 2.
Lenticel distribution (number/ cm2)
‘B74’ KP HG R2E2 Stem end 54.2 a 6.8 a 9.4 a 6.6 a
Cheek 60.5 a 8.4 a 13.9 ab 8.5 a
Convex 74.7 b 7.9 a 13.9 ab 8.2 a Deep side 61.5 a 8.3 a 13.2 ab 15.9 c Bottom 66.9 ab 12.7 b 17.9 b 12.8 b
P value 5% 0.037 0.049 0.028 <.001
Means in columns with the same letters are not significantly different (P=0.05) as tested by LSD
4.1.4.5. Wetting angle
During fruit development, the average wetting angle varied from 120° to 151° (Table 3). Large wetting angles indicate that the fruit skin had very poor wetting capacity. The wetting angle of the skin of ‘B74’ and ‘KP’ increased during fruit growth, while in ‘HG’ the wetting angle decreased and did not change for ‘R2E2’.
Table 3 Wetting angle of the skin of developing ‘B74’, ‘KP’, ‘HG’, and ‘R2E2’ mango fruit during fruit growth
Days after full flowering
Wetting angle (º)
‘B74’ ‘Kensington Pride’ ‘Honey Gold’ ‘‘R2E2’’ 2 months 129.2 a 135.1 a 132.6 b 130.2 3 months 133.6 b 134.8 a 133.8 b 151.5
4 months 136.7 bc 136.9 ab 130.5 b 139.7 Green mature 137.4 c 139.2 b 124.8 a 134.5 P value <.001 0.008 <.001 0.09
Means in columns with the same letters are not significantly different (P=0.05) as tested by LSD
4.1.4.6. Dye uptake
2012-2013
1 2 3 4 5 6
B74 KP
2011-2012
1 2 3 4 5 6
B74 KP HG R2E2
2013-2014
Days after flowering
20 40 60 80 100 120 at harvest
S
pot
ty
score (0-5)
1 2 3 4 5 6
B74 KP Sensation
Figure 4 Dye uptake capacity, as evidenced by spotty dyed lenticels, of ‘B74’, KP, HG, R2E2 and Sensation in 3 consecutive seasons.
Table 4 The total number of lenticels, dyed lenticels and the proportion of dyed lenticels per area on mature green ‘B74’, ‘KP’, ‘HG’ and ‘R2E2’ mango fruit
Cultivar
2011/12 2012/13 Dyed lenticels
/cm²
Proportion of dyed lenticels (%)
Dyed lenticels /cm²
Proportion of dyed lenticels (%) ‘B74’ 19.6 b 49.5 a 18.3b 53.0 a ‘KP’ 5.4 a 90.2c 6.2a 56.9 ab ‘HG’ 6.1 a 66.5b 6.7a 63.8 b ‘R2E2’ 5.6 a 77.0b 7.8a 94.8 c
4.1.4.7. Lenticel discolouration
‘R2E2’ had the highest LD in two of the three years. ‘B74’ LD was higher than ‘KP’ and ‘HG’ in 2012/13 (Table 5). ‘Sensation’ had the lowest LD in 2013/14.
Table 5 Lenticel discolouration (0-5) for ‘B74’, ‘KP’, ‘HG’ and ‘R2E2’ mango fruit at harvest and at full yellow skin colour (ripe). The fruit were harvested without exposure to water.
Cultivar Lenticel discolouration (0-5) At harvest At full yellow
2011/12
‘B74’ 0.4a 0.3a
KP 0.6a 1b
HG 1b 1.1b
‘R2E2’ 2c 2.4c
2012/13
‘B74’ 1.3c 2.5c
KP 0.7b 1.8b
HG 0.2a 0.4a
‘R2E2’ 2.2d 3.4d
2013/14
‘B74’ 0.8b 1.2b KP 0.7b 1.1b ‘Sensation’ 0.1a 0.3a
For each year, means in columns with the same letters are not significantly different (P=0.05) as tested by LSD
4.1.4.8. Lenticel morphology
Using replica techniques (Plate 3A), stomata were evident on the fruit surface of all four cultivars at one month after flowering. At this stage there were no obvious cultivar differences. At three months, new crystalline waxy platelets covered the cuticle and the lenticel aperture (Plate 3B). The dissecting and fluorescence microscopy micrographs show the lenticel aperture (Plate 3C,D). When using 0.1% arcidine orange, the green halo of the lenticel was observed because of the stained cell walls and cell organelles.
At one and two
months At three months After three months until green mature
Plate 3 External features of typical stomata/lenticels (A, B: lenticel image using the replica technique observed under light microscopy; C: lenticel image using dissecting light microscopy; and D: lenticel image of green mature fruit using fluorescence
microscopy. Scale bar:10 µm.
‘B74’ fruit hanging on tree started browning. No cracking of the cuticle was observed green on mature fruit with fluorescence microscopy.
Plate 4 Unstained transverse sections of lenticels of ‘B74’ mango at three months (A), four months (B) and at the green mature stage (C). Scale bar: 50 µm.
When stained with “Toluidine Blue”, the cell walls around the undamaged lenticels of immature fruit were purple, while the cell walls around the discoloured lenticel of green mature fruit were blue (Plate 5). The blue colour indicated high phenolics concentrations in these cells.
Plate 5 Stained transverse sections of lenticels of ‘B74’ at three months (A), four months (B) and at the green mature stage (C). Sections were stained with “Toluidine Blue” dye. The blue colour inside the circle suggests high phenolics concentrations around discoloured lenticels. Scale bar: 50 µm.
There were possible differences in lenticel morphology among the four mango cultivars (‘B74’, ‘KP’, ‘HG’ and ‘R2E2’) at maturity (Plate 6). Lenticels often showed blue coloured walls of the cells lining the lenticel cavity when stained with Toluidine Blue, which suggested high phenolics concentrations. More lenticel morphology examination will be done to
Plate 6 Transverse sections of lenticels of ‘B74’ (A), KP (B), HG (C), R2E2 (D) stained with “Toluidine Blue” dye. Scale bar: 50 µm.
‘B74’ fruit exhibit four typical lenticel “types” (Plate 7). Non-discoloured ‘B74’ lenticels show no abnormal pigments in the lenticel cells, while increasing intensity and extent of
pigmentation is obvious in more discoloured lenticels.
Plate 7 External features and respective transverse sections of four typical types of lenticels on ‘B74’ fruit at full yellow colour stage. A, E: undamaged lenticel; slightly damaged lenticel: B, F; small dark spot (C, G); and severe damaged lenticels: D, H. Scale bar: 100 µm.
4.1.5. Discussion
This study may have identified the distinct ‘B74’ characteristics that explain its commercially significant sensitivity to LD after harvest. Unlike ‘KP’, ‘HG’ and ‘R2E2’, ‘B74’ lenticel density continued to increase to maturity in most years, resulting in considerably higher lenticel density at harvest. Lenticels in mango are generally thought to form from stomata in the very young fruit that become dysfunctional as the fruit expands and matures. For example (Bezuidenhout et al., 2005) stated that the stomata of ‘Tommy Atkins’ mango became
ruptured when mango fruits reached 20-30 mm in diameter, and the lenticels on three month old fruitlets of ‘Namdokmai’ mango comprised of a small hole with deformed and
to form after about two months since no functional stomata were observed on the fruit after this stage. Hence the lenticels formed after this period likely form from cracks in the cuticle as the fruit expands from about two months on. This agrees with the suggestions of Dietz et al. (1988b). However, in ‘B74’ fruit collected in 2011/12 and 2012/13, there was no cracking of the cuticle when examined under fluorescence microscopy, but this may also suggest that cuticle cracks progressed very quickly into lenticels.
The results also indicated that ‘B74’ lenticel aperture diameter was less than ‘KP’ from an early fruit age. The increase in surface area with time appeared similar, so it is possible that a significant proportion of the lenticels formed from cracks that appeared during the rapid fruit expansion phase, with less fruit expansion from then to maturity to allow large lenticel
apertures.
At the green mature stage, ‘B74’ had three to four times the number and density of lenticels than ‘KP’, ‘HG’ and ‘R2E2’ fruit but much lower than ‘Sensation’. Difference in total number of lenticels in five mango cultivars including ‘Mallika’, ‘Alphonso’, ‘Dashehari’, ‘Pairi’ and
‘Totapuri’ have also been observed, and water loss increased with the increase of lenticel number on the fruit surface (Dietz et al., 1988a). ‘B74’ is a hybrid cultivar between ‘KP’ and ‘Sensation’. This study indicated that the recorded characteristics of ‘B74’ lenticels, such as lenticel density during fruit growth and at maturity and aperture diameter, were intermediate between the two parents. There was no evidence of higher stomatal density in these cultivars at one month after flowering, so it is likely the higher density resulted from more cracking of the cuticle during rapid fruit expansion, possibly because of a weaker or thinner cuticle.
Lenticels with a cambium layer can regenerate new cells as the fruit expands thus retaining structure and organisation, and resistance to damage (Bezuidenhout et al., 2005), and mango cultivars with a smaller lenticel cavity and cuticle lining the cells surrounding the cavity may also increase LD resistance (du Plooy et al., 2004). These differences were not observed in the present study. The main observed cultivar distinction was 2-3x greater lenticel density in ‘B74’, which may explain its generally greater sensitivity to develop
commercially significant LD, especially after irradiation and in ripe fruit (see section 5.2). The smaller aperture of ‘B74’ lenticels may explain why this cultivar is often less susceptible to the larger, sometimes cracking lenticel damage that occurs while the fruit are still on the tree. In conclusion, this study identified important differences between the main Australian mango cultivars that may explain varying sensitivity to LD both before and after harvest. Further investigation could look at production practices to minimise cracking of the cuticle during fruit growth, thereby reducing lenticel density on ‘B74’ at harvest.
4.2. Lenticel changes during harvesting and ripening
Minh Nguyen (PhD candidate), Peter Hofman, Daryl Joyce, Andrew Macnish, Madan Gupta
This chapter forms part of a current PhD program (Minh Nguyen). The results presented here have not yet been published. The chapter was drafted by the Ph.D. student, and reviewed by the project team.
4.2.1. Summary
Lenticels are microscopic cavities on the surface of mango fruit. The cells around the lenticels can become discoloured before and after harvest, reducing external appearance and value many mango cultivars including ‘B74’ mango. Several postharvest practices such as exposure to water and chemicals, and irradiation, often increase the risk of significant lenticel discolouration (LD), especially when the fruit reaches the ripe stage. This study showed that lenticel number and density did not change during the ripening process, but the percentage of discoloured lenticels increased depending on the postharvest practices. Postharvest handling decreased the wetting angle of fruit skin, which possibly facilitates water entry into lenticel cavities. There was often an accumulation of brown pigments in the cells surrounding the lenticel cavity during ripening.
4.2.2. Introduction
In mango fruit, lenticels originate from stomata on the young fruit that become dysfunctional as the fruit expands, resulting in microscopic cavities with little organised structure and function. Lenticels can likely also form from cracks in the cuticle that expand as the fruit grows, which explains the continually increasing number of lenticels on the ‘B74’ fruit, and one of its parents (‘Sensation’) during most of fruit growth and maturation (see section 4.1).Several postharvest practices, such as exposure to water and chemicals and irradiation, cause discolouration of the lenticel cells, and especially as the fruit reaches the ripe stage (Cronje, 2009a; Hofman et al., 2010c). Lenticel number and density may play a significant role in LD severity, and the significantly higher lenticel density in ‘B74’ compared with ‘Kensington Pride’ (‘KP’, ‘Honey Gold’ (‘HG’) and ‘R2E2’ may partly explain the relatively greater ‘B74’ sensitivity to LD. Also there is still no indication as to why some lenticels show discolouration while others on the same fruit do not.
The surface of mango fruit is covered by a cuticle which consists of a cutin layer and
epicuticular wax (Hess and Foy, 2000), which may play an important role in reducing LD. For example, ‘Keitt’ mango exhibited the most discoloration possibly because of a reduced cutin layer over the cells near the base of the lenticel cavity, and relatively large lenticel cavities compared with more tolerant cultivars (du Plooy et al., 2004).
To better clarify LD during the postharvest stage, lenticel characteristics and morphology changes after harvest were examined. Histochemical examination was used to investigate lenticel structure among cultivars at different periods from fruit harvesting to ripe. The results may lead to a better understanding of the development of lenticel disorders.
4.2.3. Materials and methods
4.2.3.1. Fruit and sampling
‘B74’ mango trees were selected at a commercial orchard at Childers, Queensland (25°14’S, 152°37’E). Fruits were all harvested at about 14% dry matter (minimum commercial
maturity). Ten ‘B74’ fruits were harvested from each tree, the fruit held upside down and the stems removed and desapped for about 30 min. The fruit were then dipped in 0.25% Mango Wash® for 1 min and put in the shade to dry. They were then carefully placed into single layer
laboratories, Nambour, Queensland. The fruit were treated with fungicide at 0.2% v/v (Sportak®, Bayer CropScience Pty Ltd) for 30 s and brushed using a Lenze AC Tech
brushing unit with soft brushes with no water for 1 min at 84 revolutions.min-1 to mimic
commercial practice. Lenticel discolouration, lenticel density, and the percentage of
discoloured lenticels were recorded at the green mature stage. Fruit were then treated with 10 µL.L-1 ethylene at 20°C for 2 d then ripened at 20°C until fully ripe. Fruit were reassessed
for lenticel discolouration, lenticel density and percentage with LD as described below. For examination of wetting angle and lenticel morphology changes along the commercial packing line, 32 fruit were sampled at four points (eight fruit per sample) from harvest directly off the tree, after Mango Wash (see above), after brushing, and after packing. The fruit were placed into single layer trays and transported to the MRF laboratories to measure the wetting angle at harvest (see below). Fruit were then treated with 10 µL.L-1 ethylene at 20°C for 2 d then ripened at 20°C until fully ripe. Fruit were rated for LD and sampled for lenticel
morphology as described below.
Ten fruit were collected at the end of commercial packing-line to study lenticel external features and morphology changes during ripening. The fruit were transported to the MRF laboratories then treated with 10 µL.L-1 ethylene at 20°C for 2 d then ripened at 20°C until
fully ripe. 100 similar green lenticels (10 lenticels per fruit) were selected and marked on the fruit surface. During ripening, external pictures of lenticels were recorded over time using a dissecting light microscope and lenticel morphology were examined as described below.
4.2.3.2. Assessments
Lenticel density and proportion of damaged lenticels
To assess lenticel density and discoloured lenticel percentage, four circles of 3 cm² each were marked on the two cheeks and two sides on the fruit equator. The total lenticel number and the number of discoloured lenticels in each circle were recorded at harvest and at 8 d after full yellow. The lenticel density per cm2 and proportion (%) of damaged lenticels was
calculated (Schotsmans et al., 2004).
Lenticel discolouration
Lenticel discolouration for each fruit was rated as described section 4.1.3.3.
Wetting angle
Eight fruit were used to measure the wetting angle on four points on the fruit equator with 5
μL droplets of distilled water (Lamour and Hamraoui, 2010). The contact angles were measured at one point on either cheek and one in between on both sides. Fruits were firmly positioned with the selected site in the horizontal direction. The droplets were carefully applied onto the selected site and photographs of the droplets on the fruit skin taken with a Canon DOS40D camera fitted with a Canon macro-lens EF-S 60 mm. The contact angles from the images were measured using Image-J software.
Lenticel external appearance and morphology
One hundred typical lenticels on each of five mature, non-ripe ‘B74’ fruits were marked. During ripening, micrographs were taken with a dissecting microscope fitted with a Canon D40 camera.
Five fruit were used at each of 2 d after harvest and 8 d after full yellow skin colour (ripe) and morphology studied using the methods described in section 4.1.3.3.
4.2.3.3. Statistical analysis
protected least significant difference (LSD) procedure at P=0.05 was used to test for differences between means (lenticel density, proportion of damaged lenticels and wetting angle).
4.2.4. Results
4.2.4.1. Harvest and packing effects
Lenticel discolouration increased from 2 d after harvest to 8 d after full colour (Table 6). The densities of lenticels were similar at both assessment times but the % of discoloured lenticels almost doubled during ripening (Plate 8).
Table 6 Lenticel discolouration severity (0-5), density of lenticels, and the proportion of discoloured lenticels on the same area of each ‘B74’ mango fruit 2 d after harvest and 8 d after full colour (in the same position).
Assessment time discolouration Lenticel Density per cm2 Proportion of discoloured
lenticels (%) At 2 d after harvest 0.9a 44.8 9.8a
8 d after full colour 1.9b 44.1 17.1b
P value at 0.05 <0.001 0.814 <0.001
Means in columns with the same letters are not significantly different (P=0.05) as tested by LSD, (n=10 fruit x 4 positions)
Plate 8 Pictures of one of the lenticel assessment areas at 2 d after harvest (left) and 8 d after full colour (right). Scale bar = 1 cm.
Wetting angles decreased significantly during harvesting and packing, and the LD severity at full yellow increased from after harvest to after packing (Table 7).
Table 7 Wetting angle of DI water on the ‘B74’ fruit surface at harvest and LD at full yellow, fruit were sampled at off the tree, after mango wash, after brushing and at end of pack-line
Fruit sampling point Wetting angle (°) LD at full yellow (0-5)
Off-tree 117.4d 0.6a
After harvest 105.1c 0.7ab After brushing 100.1b 1.1b End of the packing line 91.9a 1.7c
Means in columns with the same letters are not significantly different (P=0.05) as tested by LSD, (n=8 fruit x 4 positions)
Off tree fruit After brushing End-packing line Plate 9 Unstained lenticel morphology from fruit sampled directly off the tree (left), after
brushing (middle) and after packing (right). The lenticels were sampled once the fruit had reached full yellow skin colour. Scale bar = 50 μm.
4.2.4.2. Changes during ripening
Two days after harvest most of the lenticels showed no signs of discolouration (Plate 10). As the fruit ripened, a significant proportion of the lenticels developed brown pigment around the lenticel.
Sectioning of typical lenticels on the ripening fruit indicated almost no brown pigment in the cells surrounding the lenticel 2 d after harvest (Plate 11). As the fruit ripened, an increasing area around the lenticels expressed brown pigmentation.
Plate 10 Change in appearance of the same lenticel from 2 d after harvest to 6 d after full yellow on a typical ‘B74’ mango fruit picked and packed under commercial
Plate 11 Change in appearance of typical lenticels from 2 d after harvest to 6 d after full yellow on a ‘B74’ mango fruit picked and packed under commercial conditions and ripened at 20ºC with 2 d of 10 µL.L-1 ethylene; Lenticel at 2 d (A); 7 d (B); 9 d (full yellow) (C); 12 d and (D); 15 d after harvest (E). Scale bar = 50 μm.
4.2.5. Discussion
There was no evidence of changes in lenticel density after harvest, suggesting no formation of new lenticels after harvest. However, the proportion of discoloured lenticels increased during ripening, and this was likely the main cause of the increased LD.
Postharvest treatments such as solutions (detergents etc) used during desapping (O'Hare and Prasad, 1992; Willis and Duvenhage, 2002; Whiley et al., 2006) and packhouse operations such as brushing packing increase LD (Dietz et al., 1988b; Cronje, 2009a; Hofman et al., 2010c). Decreased wetting angle is often associated with alternations to the wax structure on the plant surfaces, which was also observed in this trial. These changes may indicate greater potential for water to enter the lenticel, which may be one of the mechanisms involved in LD.
4.3. Effects of production factors
(“Survey of production factors influencing lenticel discolouration”)
Roberto Marques, Peter Hofman, Jonathan Smith, Justin Davies, Connie Banos, Barbara Stubbings
4.3.1. Summary
Previous work showed that lenticel discolouration (LD) in ‘B74’ fruit can vary with season, production location and farm, but there was little understanding of the factors contributing to these differences. To identify those factors affecting lenticel sensitivity of ‘B74’ mango, and help develop predictive tools to reduce the problem, trials were established on five
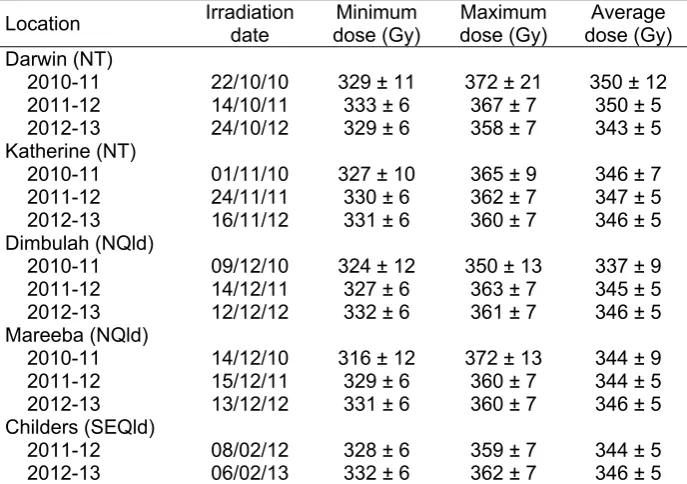
representative commercial farms in the main production areas in the Northern Territory, north Queensland and south-east Queensland. Weather stations were set up and 30 trees marked at each site. Growing conditions, tree flowering and flushing patterns, and tree and fruit characteristics at harvest were monitored in these locations. Fruit samples were taken from 15 marked trees, with half of the fruit irradiated at the Lucas Heights facility, Sydney. Fruit responses to irradiation during fruit ripening and ageing were related to these parameters. The trial was repeated over three seasons to provide sufficient data to understand seasonal effects and provide more robust results.
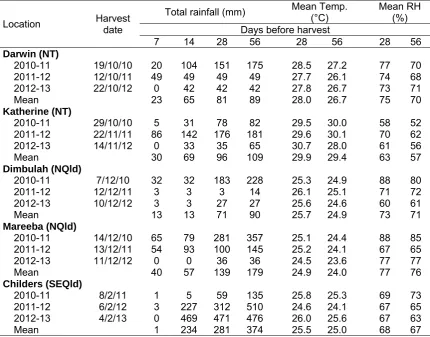
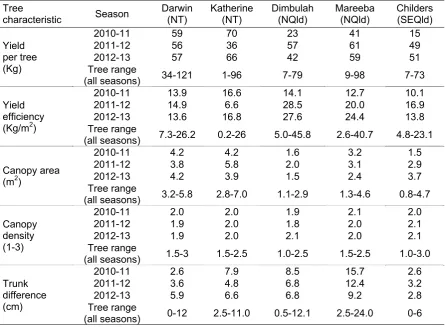
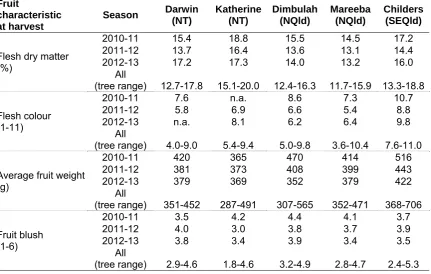
Field temperatures generally varied moderately across the three seasons and across the five locations during 28 and 56 d before harvest, while rainfall varied markedly across years and locations at periods of 7-56 d before harvest. In general, temperatures were higher and rainfall was lower in the Northern Territory sites compared to Queensland ones, while relative humidity was higher in the north Queensland sites compared to Katherine and Childers. It is likely such climatic variation was a contributing factor to the large variation between seasons and locations observed in fruit characteristics at harvest and LD severity at ripe. There were significant negative correlations (r=0.60-0.69) between the mean temperatures during the period of 56 d before harvest and LD at full yellow in both non-irradiated and irradiated fruit. Characteristics varied considerably across seasons and farms for most of the tree and fruit characteristics, including canopy volume, yield, yield efficiency, trunk difference above and below the graft union, flowering and flushing characteristics at full flowering and at harvest, fruit dry matter, flesh colour, average fruit weight and fruit blush at harvest. At each farm, there was also large variation among trees for these parameters.
In general, LD in ‘B74’ mango fruit varied significantly across locations and seasons for both non-irradiated and irradiated fruit. Compared to non-irradiated fruit, irradiated fruit from all locations and seasons had more severe LD during fruit ripening and aging, as assessed 1 d after treatment, at the full yellow (ripe) stage, and 7 d later. Skin browning (SB) severity increased in irradiated fruit 7 d after full colour compared to control fruit for most locations and seasons. Irradiation treatment also slowed down the loss of green skin colour by 1-4 d, depending on the location and year. As a result, irradiated fruit were generally softer at full yellow than control fruit in most locations and years.
Multivariate analysis showed that multiple regression on the combined data across farms and years was the most useful approach. All the tree and fruit characteristics were tested
flowering. However, this model accounts for only 35% and 32% of the variance in LD for irradiated and non-irradiated fruit, respectively.
4.3.2. Introduction
Skin defects, including undesirable changes in the appearance of fruit lenticels after harvest and packing, are a common issue in mango producing countries (du Plooy et al., 2009; Rymbai et al., 2012). Lenticel discolouration (LD; also called lenticel spotting or lenticel damage) often appears as darkening of the cells in surrounding tissues, producing a brown or black spot, or as a red or green halo around the lenticel, with or without the black or brown spot in the centre (Bezuidenhout et al., 2005; du Plooy et al., 2006). It can markedly reduce the visual appeal of fruit leading to a downgrade of their commercial value, especially in export markets (Johnson and Hofman, 2009; Rymbai et al., 2012). The appearance and severity of the condition can vary depending on cultivar (Cronje, 2009b; du Plooy et al., 2009). In cultivars such as ‘Tommy Atkins’, ‘Keitt’, ‘Kent’, and ‘Kensington Pride’ (‘KP’), LD is associated with a number of production factors, such as irrigation, leaf:fruit ratios on the canopy, relative humidity and rain conditions at harvest, fruit maturity at harvest (e.g. time of harvest during the season), harvest method (including de-sapping method and detergent used) and several postharvest handling operations during the packing process, including delays between picking and packing, fruit brushing, and hot water/air and chemical
treatments (Simmons et al., 1995; Bally et al., 1997; Oosthuyse, 1998; Simmons et al., 1998; Self et al., 2006; Cronje, 2009b; Cronje, 2009a; Feygenberg et al., 2014). To a lesser
degree, skin browning is another type of discolouration in the mango skin that can cause product downgrade and rejection on Australian markets (Bally et al., 1997). It is thought to be caused by and number of factors, including extreme temperatures, moisture, and sap or skin abrasion (O'Hare et al., 1999).
Results from projects FR02049 and MG06005 showed that LD on ‘B74’ (trading as ‘Calypso’TM) fruit can vary with season, production location and farm (Whiley et al., 2006;
Hofman et al., 2010b). However, there was little understanding of the factors contributing to these differences. To identify production factors affecting lenticel sensitivity of ‘B74’ mango to irradiation, and help develop predictive tools to reduce the problem, trials were established on five representative commercial farms in the main production areas in Australia: two farms in the Northern Territory (NT; at Darwin and Katherine), two farms in north Queensland (NQld; at Dimbulah and Mareeba) and one farm in south-east QLD (SEQld; at Childers). Growing conditions and tree and fruit characteristics in these locations were monitored. Fruit responses to irradiation during fruit ripening and ageing were related to these parameters. The trial was repeated over three seasons to provide sufficient data to understand seasonal effects and provide more robust results.
4.3.3. Materials and methods
4.3.3.1. Sites
Five field trials were established in July 2010 at representative ‘B74’ blocks in the main production areas in the Northern Territory (NT), north Queensland (NQld) and south east Queensland (SEQld) as shown in Table 8. Fifteen adjacent trees in each of these blocks were clearly marked to prevent early harvesting and to allow the same trees to be used for three years.
4.3.3.2. Production characteristics
Climactic conditions
Tinytag count input data logger attached to a CS700 Rain Gauge (one count = 5 mm rain)
Table 8 Selected field sites used for the trial ‘Survey of production factors influencing lenticel discolouration’ from 2010 to 2013
Location Farm Block
Darwin (NT) Acacia Hills Starbucks Katherine (NT) Oolloo Katherine (K1) 1
Dimbulah (NQld) Oolloo Dimbulah 52 Mareeba (NQld) Willbi B1 Childers (SEQld) Simpson (Goodwood) Home 1
Flowering assessments
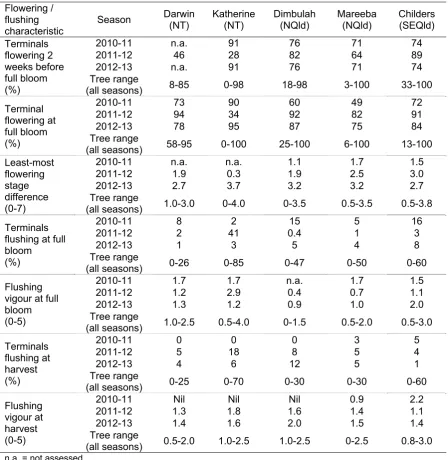
The marked trees were assessed twice during flowering (about two to three weeks apart) to determine when each tree reached full flowering, if there were multiple flowerings, when the first 5% and the last 5% of the panicles flowered, the average stage of development of panicles on each tree, and the range (i.e. the spread or variation of flowering).
The following visual ratings were used on opposite sides of the tree along the row (the results for each tree were then averaged):
Percentage of terminals flowering: by looking at the tree canopy as a whole, each side of the row/canopy was visually rated as the % of panicles that showed any signs of flowering compared to the total number of panicles on the tree.
Stage of flowering based on the visual scale: 0=nil; 1=1-5 cm panicle; 2=up to full extension but very few of the flowers had opened; 3= full flowering (or full bloom), when most of the flowers opened except the last 1-3 cm of the end of the panicle; 4= all flowers on the panicle opened, and some of the bottom flowers have set very small fruit; 5=up to pea size fruit on the panicles; 6=up to large marble size; 7=larger than marble size.
Full flowering stage: the date when at least 50% of the panicles on the tree reached full flower (on average the stage of flowering 3 – most of the flowers opened, except for the last 1-3 cm of the end of the panicle (Plate 12).
Plate 12 Panicle of a ‘B74’ mango tree at a typical stage 3 of flowering (‘full flowering’).
In the first season, assessments of spread of flowering were not done in the NT farms, as the flowering on the trees was already too advanced by the time the project was approved and the trial established.
Vegetative growth assessments
The potential competition between vegetative and reproductive growth was also determined by recording the percentage of terminals with new vegetative flush at full flowering, and the flushing vigour at the end of flowering and at harvest. The following visual ratings were used on opposite sides of the marked trees as above:
% of terminals with vegetative flush.
Flushing vigour based on the visual scale: 0=no flushing; 1= less than 5 cm; 2= up to 20 cm; 3= up to 50 cm; 4=up to 100 cm; 5=more than 100 cm.
Tree characteristics at harvest
To allow correlations to be done between tree characteristics, flowering, flushing and fruit maturity, digital photographs were taken on two sides (along the rows) of the tree canopy at harvest using a reference board (0.28 x 0.22 m). Canopy area was then estimated with SigmaScan (Systat Software Inc., Chicago, USA).
The vegetative flushing was recorded as described above.
Canopy density was estimated by a visual rating: 1 = open, 2 = average, 3 = dense. Trunk diameter about 5 cm below and 5 cm above the graft union was recorded using a measuring tape.
4.3.3.3. Harvest procedure
The total number of fruit on each tree was carefully counted and recorded using a hand counter. The data was used to estimate yield per tree, together with average fruit weight per tree from the sampled fruit.
Whenever possible, fruit samples were harvested just before commercial picking started at each location and block, aiming at a target fruit maturity of 14-16% dry matter (DM). The dates are given in Table 9.
Table 9 Harvest dates at the selected field sites used for the trial ‘Survey of production factors influencing lenticel discolouration’ from 2010 to 2013
Location 2010-11 2011-12 2012-13 Darwin (NT) 19/10/10 12/10/11 22/10/12
Katherine (NT) 29/10/10 22/10/11 14/11/12 Dimbulah (NQld) 07/12/10 12/12/11 10/12/12 Mareeba (NQld) 14/12/10 13/12/11 11/12/12 Childers (SEQld) 08/02/11 06/02/12 04/02/13
Two trays of count 18 or 20 (total of about 36-40 fruit) per tree (depending on fruit size) were picked with long stems and carefully placed on the ground. Sampled fruit were sound (with no cuts or open wounds, not severely sunburnt and no yellow skin), of average size for the tree and proportionally representing all aspects of the tree, including sun-exposed fruit and those further inside the canopy.
“‘B74’ Best Practice Guide” (Hofman and Whiley, 2010). Whenever possible,
assessments were done on the same day as harvest. If next day, fruit were kept in the plastic bags overnight in a coldroom at 12-13°C to reduce weight loss.
To reduce variability, and allow more uniform harvesting and packing operations across farms and seasons, commercial de-sapping was simulated in the fruit picked with long stems by removing the stem and holding fruit for two seconds (with stem end down) to remove spurt sap. All 36-40 fruit per tree were then placed in a de-sapping solution of (75 g of ‘Mango Wash’ powder (Septone) in 30L of water for 4 min using a 50-60 L plastic container. The solution was replaced after each tree.
Fruit from the de-sapping solution were then removed and placed into labelled perforated plastic crates (one per tree). The crates were taken to the packhouse or the local
research station and dipped into Sportak (Bayer - active ingredient: 450g/L prochloraz) (55 ml/100 L) for 30 seconds. Fruit were then allowed to dry.
Fruit were packed into labelled P-84 trays with inserts. The trays were separated into two lots (one tray from each tree going to each lot): not irradiated and irradiated. One
temperature logger was inserted into a representative tray of each lot. Trays from each lot were stacked into bundles of two trays, covered with a lid, before being wrapped with duct tape.
4.3.3.4. Fruit handling after harvest
Fruit handling before irradiation
To stimulate LD, and further investigate the effects of irradiation on lenticel sensitivity, as well as the processes taking place within the lenticels following irradiation, half of the sampled fruit were air-freighted to Sydney to be irradiated within 48 h of harvest. The remaining fruit were air-freighted (except fruit from Childers which were transported by car) to the DAFF postharvest laboratory at Maroochy Research Facility (MRF) Nambour and held as controls (not-irradiated).
Irradiation treatment
Fruit were irradiated at the Gamma Technology Research Irradiator (GATRI) at the
Australian Nuclear Science and Technology Organisat