Towards a comparable and harmonised set of performance indicators for Third Sector organisations: the Italian experience
Abstract
Purpose: This paper is intended as a contribution to the performance evaluation of Third Sector organisations. The Italian experience on the development and adoption of harmonised indicators is considered here as an example of problems and possible solutions.
Design/methodology/approach: Preliminary analysis shows that, in the Italian situation, two main gaps exist. The first one relates to the incomplete statistical information on the magnitude and performance of Third Sector organisations; the second is related to the lack of a set of harmonised indicators. To address these problems, two initiatives have been recently set up in Italy. On the one hand, the newly presented "National Strategy on Social Corporate Responsibility - 2012-2014" has been oriented to fill the statistical gap, by extending the compilation of socio-economic and environmental accounts to Third Sector organisations; on the other hand, a joint initiative of the Italian Statistical Institute (Istat) and the CSR Manager Network Italia (CMN) towards the harmonization of the “Global Reporting Initiatives (GRI)-quantitative performance indicators” and the standards of the Italian statistical system. Within the second initiative, a specific sub-set of performance indicators for Third Sector organisations is proposed and presented in this paper.
Findings: The Italian experiences reported here, together with the set of proposed indicators, can be used to improve data collection and to move towards a common framework for performance evaluation in the Third Sector organisations.
Keywords: Harmonised indicators; Global Reporting Initiatives, Inter-organisations comparability
Third Sector organisations (TSOs) are legally recognized and promoted by Article 45 of the Italian Constitution, which specifically states the socio-economic relevance of cooperation and mutual support. The large increase of Third Sector organisations that took place during the last decades generated, however, a boom of different association status and forms, not always defined by an uniform and structured legislation. Social-cooperatives, non-governmental organisations, foundation, voluntary organisations, social enterprises, associations of social promotions and not-for-profit organisations are some of the most well-known[1].
From a statistical viewpoint, not every TSOs is obliged to collect data on activities or to compile accounting. In general terms, two broad categories can be identified. The first category, that mainly includes social co-operatives and foundations, relates to the Third Sector organisations (TSOs) that are legally obliged to provide data according to the standards of National Accounts. Some of them also compile socio-economic and environmental performance accounting, as established by the Global Reporting Initiative (GRI)[2]. The second category includes the majority of the other Third Sector organisations that are not legally obliged to complete balance sheets, nor to provide any kind of sustainability accounts.
In the present situation, two main issues exist. The first relates to a statistical gap: since the majority of the largest parts of Italian Third Sector organisations are not legally obliged to provide data on activities or to compile a financial budget, the quantification of the socio-economic contribution of TSOs to the Italian system is incomplete (Ministero del Lavoro, et al., 2013). The second issue relates to the fact that since a common and legally defined statistical and performance evaluation framework is not established, a multitude of quantitative and qualitative indicators have been developed and compiled (Agenzia per le ONLUS, 2010). In contrast to other European countries, as for example Belgium and UK, where social enterprises and “community interest companies” are required to present annual social report ensuring the consistency of social purposes and community involvement, the Italian situation is largely under-regulated (Rusconi et al 2009; Consiglio nazionale dei dottori commercialisti, 2004; Ministero del Lavoro et al., 2013). A clear legislation on accounting, supported by a harmonised set of indicators, is then needed to fill the statistical gap and to improve the performance evaluation on Italian TSOs (Ranieri, 2013).
Statistical Institute (Istat) and the CSR Manager Network Italia (CMN) [3] has been specifically arranged to propose a set of indicators oriented to harmonise the quantitative performance indicators of the Global Reporting Initiatives (GRI) with the definitions and standards of the Italian statistical system. The main purpose of these initiatives is to increase statistical data collection and to propose a clear and common set of indicators allowing for inter-organisation comparability.
Moving from the Istat-CMN initiative, a sub-set of harmonised indicators, specifically oriented to address performance evaluation of Third Sector organisations, is proposed and presented in this paper. The main objective is to promote a common framework oriented to increase data availability and to improve the comparability of TSOs performance. In particular, the main contribution of the proposed set of indicators is to: (i) provide standard definitions and clear calculation methods; (ii) define quantitative measurements allowing for aggregation; (iii) promote data collection and performance evaluation in a context, as the Italian one, where statistical information for TSOs is largely incomplete.
The paper is structured as follows: Section 2 provides an overview of the state of the art in the performance measurement of the Third Sector. Section 3 summarizes the available data on the Italian Third Sector organisations and highlights the main gaps on data collection and performance evaluation. Section 4 summarizes the main outcomes of the Istat-CMN Italian initiative and provides a sub-set of harmonised quantitative performance indicators to be applied to Third Sector organisations. The main limits and advantages, together with possible research developments are also reported. Section 5 concludes.
2. State of the art
When discussing performance measurement in the Third Sector, two levels of analysis have to be considered: the micro and the macro. The micro refers to individual organisations and relates to an internal process to evaluate the individual organisations operating performances and to improve the degree to which the objectives are achieved (Bertelsmann Foundation, 2001; Poister, 2003; Tayard De Borms, 2005; Meffert, 2005). The macro relates to a country's National Accounting System and includes measurements to investigate the overall dimensions of the Third Sector's activities and to quantify their contribution to the socio-economic development.
Bill & Melinda Gates Foundation and the Pew Charitable Trusts, are examples of Third Sector organisations that regularly compile and release performance analyses (WKKF, 1998, 2002, 2006). Over the last decades, a large set of methodologies and indicators have been proposed to assist these analyses. The Social Accounting and Audit (SAA), the Logic Models (LogFrame), the Social Return on Investment (SROI) and the Global Reporting Initiatives (GRI) are some examples of the most commonly used. Recent studies have also been oriented to organize the different indicators within a comprehensive and haronised structure. However, until now a clear and consistent framework for TSOs performance evaluation is still missing (Al-Tabbaa et al., 2013; Greatbanks et al., 2010; Manville and Greatbanks, 2010; Bagnoli and Megali, 2010).
from the awareness that charities and social enterprises are interested in ensuring that invested resources are used to make the greatest difference in people’s lives, the “Inspiring Impact” project developed a methodology oriented to promote a shared approach on performance measurements. Key features are: 1) shared outcome; 2) consistent methodologies (i.e., research designs, similar sample sizes, similar analysis and consistent reporting of results); 3) focus on measuring the difference that activities or organisations make on a particular group of people; 4) agreement around what is measured (Ni Ogain, et al. 2013). The “Impact Builder” is an online hub of outcomes, indicators and data collection tools designed to help organisations to monitor and evaluate their projects and programmes. The project was developed by more than 100 UK NGOs, that through a consultation process selected and adopted the practices and approaches considered more relevant and effective. In particular, transparency on methodology, on data used and on results, together with baseline data comparisons are considered fundamental elements of analysis (Bond Effectiveness Programme, 2012).
Within the Italian context, a specific legislation and a clear harmonised reporting system is still missing, and performance evaluations of Third Sector organisations are carried out on a voluntary basis. For these reasons, a large uncertainty on data reliability and inter-organisation comparisons exists, making difficult to quantify the performance of the TSOs and to identify their contribution to the overall socio-economic system (Rusconi et al 2009; Consiglio nazionale dei dottori commercialisti, 2004; Agenzia per le ONLUS, 2010).
3. The Third Sector in Italy
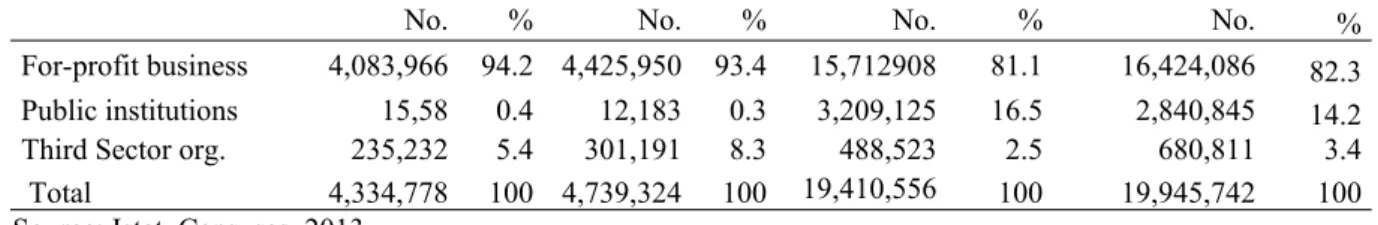
The most recent information on the Italian Third sector organisations is provided by the 9th Census of economic activities, which provides data for: (i) For-profit business activities; (ii) Public institutions and (iii) Third Sector organisations (TSOs). According to the data reported in Table 1, in 2011, TSOs corresponded to 8.3% of national economic units (5.4% in 2001), accounting for 3.4% of total Italian employment (2.5% in 2001). Around 4.8 million volunteers participating in Third Sector organisation activities need to be added to these data. Between 2001 and 2011 the number of volunteers increased by 43.5% and the percentage variation in the quantities of Third Sector organisations has been larger than those of the other Italian economic activities (Istat, 2013).
Table 1- Number of economic units and employees, Italy - 2001 and 2011 (absolute and % values)
Type Units Employees
No. % No. % No. % No. % For-profit business 4,083,966 94.2 4,425,950 93.4 15,712908 81.1 16,424,086 82.3 Public institutions 15,58 0.4 12,183 0.3 3,209,125 16.5 2,840,845 14.2 Third Sector org. 235,232 5.4 301,191 8.3 488,523 2.5 680,811 3.4
Total 4,334,778 100 4,739,324 100 19,410,556 100 19,945,742 100
Source: Istat, Censuses, 2013
Five forms of Third Sector organisations are legally recognized by Italian legislation, namely: Recognized associations; Foundations; Non recognized associations; Social cooperatives and Others. Social cooperatives and foundations are the only two kinds of TSOs legally obliged to annually provide balance sheets, so the economic value of production is regularly available only for these two categories. For the other types of TSOs the quantification of the socio-economic contribution to the overall Italian system is provided by census data, generally collected every 10 years. In Table 2 the census data for TSOs are reported for the years 2001 and 2011.
According to this data, the largest part of Third Sector organisations are classified as non-recognized associations (66.7% in 2011 and 66.4% in 2001) [4]. The remaining 55.7% is composed by recognized associations (22.7% in 2011 and 26.5% in 2001), social cooperatives (3.7% in 2011 and 2.4% in 2001), foundations (2.1% in 2011 and 1.3% in 2001) and others (4.8% in 2011 and 3.5% in 2001). Social cooperatives and foundations showed the largest percentage variations between 2001 and 2011 (+98.5% and +102.1%, respectively).
Table 2 - TSOs by legal form, Italy - 2001 and 2011(absolute and % values)
2001 2011
No. % No. %
Legal form
Recognized Association 62,231 26.5 68,349 22.7
Foundation 3,077 1.3 6,220 2.1
Non recognized association 156,133 66.4 201,004 66.7
Social cooperative 5,674 2.4 11,264 3.7
Others 8,117 3.5 14,354 4.8
Total 235,232 100 301,191 100
Source: Istat, Censuses, 2013
and standards; 2) different selection of indicators and different importance attributed to them by different organisations; 3) diverse classifications and measurement methods used to quantify indicators. Since the accounting and the financial statements are not regulated by a clear and common legislative framework, it is difficult to use these data for assessing performance of TSOs (Morgan and Fletcher, 2011; 2013; Morgan, 2013). To address these problems, a common and harmonised regulatory framework that obliged Third Sector organisations to provide economic data, annual financial statements and performance indicators is urgently needed. The two initiatives recently established in Italy, namely: the “National Strategy on Social Corporate Responsibility – 2012-2014” and the Istat-CSR initiative have been specifically oriented to that (Ministero del Lavoro et al., 2013; Istat-CMN Italia, 2013). In the next section, the Istat-CRS initiative is presented and a sub-set of harmonised indicators for Third Sector organisations is proposed.
4. Towards the harmonisation between socio-economic and environmental performance reports and official statistics: a sub-set of indicators for Third Sector organisations
The Italian Statistical Institute (Istat) together with the CSR Manager Network Italia (CMN) launched in 2012 a project oriented to harmonize the system of quantitative performance indicators established in the Global Reporting Initiative with the definition and standards of the National statistical system. The main objective was to propose a set of indicators, to be applied both for-profit and for not-for-profit activities, able to improve data collection and inter-organisation comparisons, both on socio-economic and environmental performances (Istat-CMN Italia, 2013).
The project focused on the standardisation of quantitative indicators in the belief that for this type of indicators it is easier to determine standard definitions, calculation methods and aggregation approaches. The project also recognized the importance of qualitative indicators as a tool for performance evaluation. However, since qualitative indicators cannot be easily aggregated, they have not been specifically included in the project. Following the theoretical approach supported by Balser and McClusky (2005) the GRI-related indicators have been selected by using a participatory approach. Consultations with members of the CSR Manager Network Italy and stakeholders have been performed to identify the main indicator for-profit and not-for-profit activities [5]. The guidelines of the Agenzia per le ONLUS (2010) have also been used to support the selection of indicators for the Third Sector organisations.
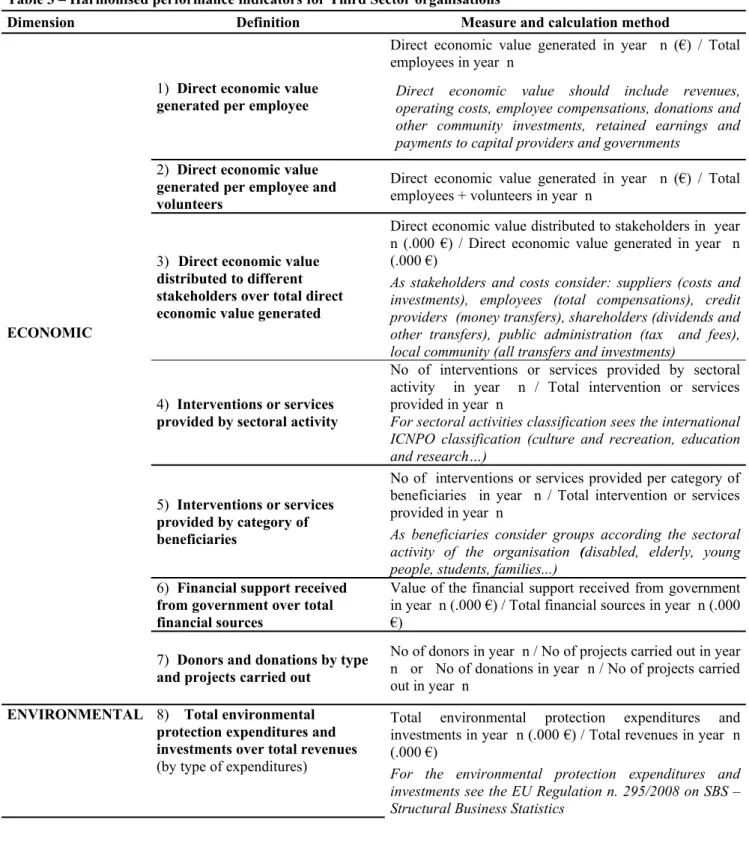
The proposed indicators for the economic, the environmental and the social dimensions are reported in Table 3, together with definitions (in italics), measures and calculation methods [6]. These indicators refer to the technical proposal of reclassification of financial budget in value added, made by the Agenzia per le ONLUS (2010) [7] and, following the National Accounts definition, the economic indicators should be calculated for resident economic units even if they operate abroad [8].
Table 3 – Harmonised performance indicators for Third Sector organisations
Dimension Definition Measure and calculation method
ECONOMIC
1) Direct economic value generated per employee
Direct economic value generated in year n (€) / Total employees in year n
Direct economic value should include revenues, operating costs, employee compensations, donations and other community investments, retained earnings and payments to capital providers and governments
2) Direct economic value generated per employee and volunteers
Direct economic value generated in year n (€) / Total employees + volunteers in year n
3) Direct economic value distributed to different stakeholders over total direct economic value generated
Direct economic value distributed to stakeholders in year n (.000 €) / Direct economic value generated in year n (.000 €)
As stakeholders and costs consider: suppliers (costs and investments), employees (total compensations), credit providers (money transfers), shareholders (dividends and other transfers), public administration (tax and fees), local community (all transfers and investments)
4) Interventions or services provided by sectoral activity
No of interventions or services provided by sectoral activity in year n / Total intervention or services provided in year n
For sectoral activities classification sees the international ICNPO classification (culture and recreation, education and research…)
5) Interventions or services provided by category of beneficiaries
No of interventions or services provided per category of beneficiaries in year n / Total intervention or services provided in year n
As beneficiaries consider groups according the sectoral activity of the organisation (disabled, elderly, young people, students, families...)
6) Financial support received from government over total financial sources
Value of the financial support received from government in year n (.000 €) / Total financial sources in year n (.000 €)
7) Donors and donations by type and projects carried out
No of donors in year n / No of projects carried out in year n or No of donations in year n / No of projects carried out in year n
ENVIRONMENTAL 8) Total environmental protection expenditures and investments over total revenues
(by type of expenditures)
Total environmental protection expenditures and investments in year n (.000 €) / Total revenues in year n (.000 €)
9) Energy consumption from renewable resources
Energy consumption from renewable resource in year n / total energy consumption in year n
For renewable resources consider biomasses & renewable wastes / hydro/ geothermal/ solar /wind
10) Women over total employees No of women employees in year n / Total employees inyear n
11) Employees with an atypical contract over total employees (by gender and age-group)
No of employees with an atypical contract in year n / Total employees in year n
The proposed age groups are: less than 30 years, 30-50 years, over 50 years
SOCIAL
12) Disadvantaged workers over total employees (by function)
No of disadvantaged workers in year n / Total employees in year n
For disadvantaged workers consider those identified by law
13) Workforce turnover (by gender)
Inflows – outflows of workforce in year n / Total personnel at the beginning of the year n
The annual turnover is calculated before professional upgrades and net of flows arising from changes in the organisation
14) Trained employeesover total employees (by gender and age-group)
No of trained employees in year n / Total employees in year n
For calculation consider all types of vocational training carried out inside and outside the organisation and paid leave for training or education. The proposed age groups are: less than 30 years, 30-50 years, over 50 years
15) Labour cost per capita (by professional level)
Total labour cost in year n (€) / Total employees in year n
For professional level consider senior manager, middle managers, functional managers, others
16) Gender pay gap (by professional level)
Average earnings for women in year n (€) / Average earnings for men in year n (€)
For professional level consider senior manager, middle managers, functional managers, blue collars, others
17) Volunteers (by gender and age
group) No of volunteers in year n less than 30 years, 30-50 years, over 50 years/ The proposed age groups are:
18) Trained volunteers over total trained employees (by gender and age-group)
Total trained volunteers in year n / Total trained employees in year n
For the calculation consider all types of vocational training carried out inside and outside the organisation and paid leave for training or education. The proposed age groups are: less than 30 years, 30-50 years, over 50 years
19) Shareholders (by gender, age-groups)and shareholders over total employees
No of shareholders in year n / The proposed age groups are: less than 30 years, 30-50 years, over 50 years
Shareholders in year n / employees in year n 20) Operations with implemented
local community engagement, impact assessments, and development programmes over total operations
21) Participation in networks or active collaborations with other organisationsover total operations
No of participation in networks or active collaborations with other organisations in year n / Total operations in year n
Possibly specify the type of organisations (government agencies, NPOs, enterprises...)
According to the 21 indicators reported in Table 3, economic performances are mainly accounted in terms of economic value generated and distributed, number and types of interventions, sectoral activities, category of beneficiaries and financial support received from government or from donors. Environmental performances are quantified in terms of environmental protection expenditures and renewable energy use. Social performances consider different subjects and measures, namely; employees (percentage of women, trainees, atypical contract, disadvantages workers, gender pay gap, and annual turnover), volunteers, shareholders, local communities and social networks (involvements of the organisation with local communities or other organisations). For all the indicators reported the reference period is the calendar year and comparisons for the last 3 years are recommended.
By using these indicators and the reference standards summarized by the calculation methods, the TSOs could provide a picture of the socio-economic and environmental performances consistent with the standard of the National statistical system.
The main advantages of the suggested framework are: 1) the proposed set of indicators is easy to calculate; 2) the information provided by these indicators can be used to improve the performance, to increase the returns of investments, to improve transparency and increase the trust of funders and society; 3) the reclassification of financial budget in value added allows to consider assets that would be difficult to quantify (i.e activities made with social groups that are difficult to reach by private and statutory sector services); 4) the measures can align with what is already in place in terms of social report, this is a fundamental element to develop shared measurement; 5) a greater transparency can improve trust of investors and funders, increase the quantity of donations and volunteers participation. Disadvantages include: 1) the skeptical attitude of some organisations, that do not think their results can be compared, could prevent the adoption of the proposed indicators; 2) a wide consensus on the relevance of the chosen indicators is needed to set up a common framework; 3) since large differences exists between TSOs, the proposed sub-set of indicators could be more suitable for some of them, as for example social cooperatives and foundations. Additional indicators are then needed to better describe the large diversity of TSOs activities.
perspective, the adoption of the proposed set of indicators could generate positive impacts on the performance evaluation of TSOs. In particular, the clear and harmonised framework will reduce the uncertainties that TSOs face when having to identify and select the most appropriate performance evaluation strategy. In addition, the adoption of the proposed framework will increase the possibility for inter-organisation comparisons. By improving the consistency of data collection and performance assessment, TSOs will be able to compare management strategies and results. This will help to improve not only the performance of the individual organisation, but also of the performance of the sector as a whole. However the necessity to compile, on a regular basis, the set of proposed indicators could increase the administrative and the accounting requirements for TSOs. In our view, however, the benefits generated by a clear and harmonised structure, will be higher than the administrative costs. Future research developments could be oriented to further simplify the accounting framework proposed here, to diversify the indicators based on TSOs characteristics and to share international experiences to move toward a consistent, harmonised and over-national framework for performance evaluation of TSOs.
5. Conclusion
This paper contributes to the performance evaluation of Third Sector organisations by presenting Italian experiences on the development of harmonised indicators. Some attempts and work in progress have already devised sets of common indicators in other countries. However, within the Italian context a clear and legally recognized framework is still missing. Since a limited number of Third Sector organisations are legally obliged to complete balance sheets, the contribution provided by TSOs to the overall socio-economic Italian system is presently incomplete. In addition the large number of indicators voluntarily presented and compiled by TSOs and the lack of a harmonised and shared framework generates inconsistencies on analysis and evaluation.
of the magnitude and performance of the Third Sector organisations; (iii) it is the first attempt to provide a harmonised set of indicators in a context, as the Italian one, where a common TSOs performance evaluation framework is missing and where statistical data are incomplete. In addition greater transparency of the activities and performance of Third Sector organisations could perhaps increase the trust of users, funders, and society, and play a key role in increasing the opportunities for funding collection.
The proposal refers to a limited set of quantitative indicators that, considering the diverse nature of TSOs activities, need to be enlarged and more specifically designed. The set of harmonised indicators reported in this paper, however, can be useful as a starting point to improve the data availability and the performance evaluation of the Italian TSOs. In the international context, the set of indicators proposed can contribute to the existing attempts on common indicators construction. However, in order to allow for a common international and harmonised performance evaluation system for Third Sector organisations, over-national coordination and cooperation is needed.
Reference
Agenzia per le Organizzazioni Non Lucrative di Utilità Sociale - ONLUS (2010), Linee Guida per la Redazione del Bilancio Sociale delle Organizzazioni non profit, Rome.
Al-Tabbaa, O., Leach, D., March, J. (2013), “Collaboration between nonprofit and business sectors: A framework to guide strategy development for nonprofit organizations”.International Journal of Voluntary and Nonprofit Organizations, (in press).
Anheier, H. (2001), “Measuring Global Civil Society”, in Anheier H., Glasius, M. and M. Kaldor (eds), Global Civil Society, Oxford University Press, Oxford.
Anheier, H.K. (2005). Nonprofit Organizations, Routledge, New York.
Anheier, H.K., Leat, D., (2006), Creative Philanthropy. Towards a New Philanthropy for the Twenty-First Century. Routledge, NY.
Balser, D., McClusky, J. (2005), “Managing Stakeholder Relationship and Nonprofit Organization Effectiveness”, NonProfit Management and Leadership, vol. 15, n. 3.
Bagnoli L. and C. Megali (2011), “Measuring Performance in Social Enterprises”, Nonprofit and Voluntary Sector Quarterly, 40(1) 149-165.
Bond Effectiveness Programme / PPA Learning Group on measuring empowerment and accountability (2012). Core principles for assessing effectiveness: A NGO approach to evidencing change. Available at:
Bertelsmann Foundation (ed.) (2001), Striving for Philanthropic Success: Effectiveness and Evaluation in Foundations. Bertelsmann Foundation Publishers.
Centre Internationale de Recherches et de l´Information sur l´Économie Sociale et Coopérative – CIRIEC (2006), Manual for Drawing up the Satellite Accounts of Companies in the Social Economy: Co-operatives and Mutual Societies, European Commission, Enterprise and Industry Directorate–General, Liege, December.
Consiglio nazionale dei dottori commercialisti - Commissione aziende non profit (2004), “Il bilancio sociale nelle aziende non profit: principi generali e linee guida per la sua adozione”, Raccomandazione n. 7, Rome.
Drucker, P.F. (1990), Managing the Nonprofit Organizations: Principles and Practices, Harper Collins, New York.
Dumay J., J.Guthrie, F.Farneti (2010), “Gri Sustainability Reporting Guidelines For Public And Third Sector Organizations”, Public Management Review, 12(4) 531-548.
Global Reporting Initiatives (GRI): https://www.globalreporting.org/Pages/default.aspx (access: 28 August 2013).
Greatbanks, R., Elkin, G., Manville, G. (2010), “The Use and Efficacy of Anecdotal Performance Reporting inthe Third Sector”. International Journal of Productivity and Performance Management, 59: 6 pp571–85.
International Labour Organization (2007), “Manual on the Measurement of Volunteer Work”, ILO, Geneva.
Istat (2005), “I conti economici nazionali per settore istituzionale: le nuove stime secondo il Sec95“, Metodi e Norme, n.23, Istat. Rome.
Istat (2013), The 9th Census of industry, services and not-for-profits institution, 2011. Preliminary results, Istat, Rome.
Istat-Corporate responsability manager network - CMN Italia (2013), Oltre il dato finanziario: imprese e benessere collettivo. L’importanza dell’armonizzazione tra bilanci sociali delle
grandi imprese e statistiche ufficiali, Istat. Rome.
http://www.istat.it/it/files/2013/03/completo.pdf
Istituto italiano della Dotazione (2011), Carta della Donazione, available at:http://www.istitutoitalianodonazione.it/menu.asp?r=564&a=4481
Marcon, G., Tieghi, M. (2000), “Sistema informativo e misurazioni economiche nelle aziende nonprofit”, in Zangrandi, A., Aziende nonprofit, Egea, Milano.
Meffert, H. (2005), “Las fundaciones como impulso para el cambio”, in Responsabilidad cívica, Fundación Bertelsmann, Barcelona.
Ministero del lavoro e delle politiche sociali, Ministero dello sviluppo economico (2013), Piano d’azione nazionale sulla responsabilità sociale d’impresa 2012-2014, Rome, Italy available at: http://www.lavoro.gov.it/NR/rdonlyres/839B6CCE-9BE5-4086-85B9-DBDBE0C60590/0/ Piano_Azione_RSI_2012_14.pdf
Monteduro, F., Hinna, A. (2005), “Il sistema integrato di controllo”, in Hinna A., Gestire e organizzare nel terzo settore, Carocci, Roma.
Morgan, G.G., Fletcher, N.J. (2011). “Public Benefit Reporting by Charitieis”, Charity Commission, Liverpool
Morgan, G.G. (2013). “Purposes, activities and beneficiaries. Assessing the use of accounting narratives as indicators of third sector performance”. Qualitative Research in Accounting and Management 10, 295-315
Morgan, G.G., Fletcher, N.J. (2013). “Mandatory public benefit reporting as a basis for charity accoutnability: findings from England & Wales”. Voluntas: International Journal of Voluntary and Nonprofit Organization 24, 805-830
Ni Ogain, E., Svistak, M., de Las Casas, L. (2013) Blueprint for shared measurement: developing, designing and implementing shared approaches to impact measurement. Inspiring Impact. Pew Charitable Trusts. Available at: http://www.pewtrusts.org/ (access: 28 August 2013)
Poister, T. H. (2003), Measuring performance in public and nonprofit organizations, Jossey-Bass, San Francisco.
Ranieri C. (2013), “La rendicontazione sociale”, presented to Terzo Incontro di preparazione del IV
Congresso regionale Forum Terzo Settore Lazio, Rome.
Rusconi, G., Signori, S., Stiz, G., Marangoni, G. (2009), Linee guida per la redazione del bilancio di missione e del bilancio sociale delle organizzazioni di volontariato, CSVNET.
Salomon, L. M., Anheier, K.H, List, R., Toepler, S., Sokolowski, S. and Associates (1999), Global Civil Society – Dimensions of the Nonprofit Sector. The Johns Hopkins Comparative Nonprofit Sector Project, Johns Hopkins University, available at: http://www.ccss.jhu.edu/ (access: 28 August 2013).
UN Statistics Division. Department of Economic and Social Affairs, (2003), United, Nations Handbook on Nonprofit Institutions in the System of National Accounts. United Nations, New York.
Notes:
[1] L49/1987 on non-governmental organisation; L218/1990 on bank foundation; L266/1991 on voluntary association; L381/1991 on social co-operatives; L383/2000 on the association of social promotions; DL460/1997 on ONLUS; L118/2005DL155/2006 on social enterprises.
[2] The Global Reporting Initiative (GRI) - launched in 1997 by the Coalition for Environmentally Responsible Economies (CERES) in partnership with the United Nations Environmental Program (UNEP) -developed international guidelines to make comparable and verifiable the corporate reporting on social and environmental performance (Dumay et al., 2010)
[3] CSR Manager Network Italia (CMN) is an Italian national association of professionals engaged in the management of socio-environmental and sustainability-related themes in for-profit and not-for profit organisations.
[4] Recognized association (art. 12 and 14-35 civil code) is defined as an association that has obtained legal personality based on the following conditions: (i) its patrimony is adequate in order to achieve the association’s objective; (ii) its purposes are lawful; (iii) its statutes are written by a notary public. Non-recognized association (art. 36-42 civil code) is an association that operates without having obtained legal
personality.
[5] The survey includes 300 social enterprises, 1200 volunteer organisations, 1200 foundations, 239 NGOs and over 2,600 social cooperatives. They are interviewed about the existence of a social report, the model of reporting, the editing and the content, the purpose of use.
[6] For further information on specific definitions, classifications and accounting methods see Istat-CMN Italia, 2013
[7] The Agency in 2010 proposed a performance measurement scheme for TSOs market activities. The reclassification scheme provides a table on the formation and distribution of value added which takes into account that for the non-profit production a social enterprise can use volunteer work (ie without monetary compensation) or that the price of services can be determined by agreements with a client institution. The representation of the formation and distribution of value added is facilitated when the not-for-profit organisation - as well as in the case of social co-operatives - draw up the budget in accordance with the statutory scheme pursuant to art. 2425 of the Civil Code. In other cases, a reworking of the available financial budget is needed.