M ofi di, R e z a a n d M a r r ow, C a r ol ( 2 0 1 7 ) T h e eff e c t s of t h e N H S r e f o r m s o n q u a li ty of c a r e . B ri ti s h Jo u r n a l of H e a l t h c a r e M a n a g e m e n t , 2 3 ( 3). p p . 1 2 0-1 3 0 .
Do w n l o a d e d fr o m : h t t p ://i n si g h t . c u m b r i a . a c . u k /i d/ e p ri n t/ 2 7 3 5 /
U s a g e o f a n y i t e m s f r o m t h e U n i v e r s i t y o f C u m b r i a’ s i n s t i t u t i o n a l r e p o s i t o r y ‘I n s i g h t ’ m u s t c o n f o r m t o t h e f o l l o w i n g f a i r u s a g e g u i d e l i n e s .
Any it e m a n d it s a s s o ci a t e d m e t a d a t a h el d i n t h e U niv e r si ty of C u m b r i a ’s in s ti t u ti o n al r e p o si t o r y I n si g h t ( u nl e s s s t a t e d o t h e r wi s e o n t h e m e t a d a t a r e c o r d ) m a y b e c o pi e d , di s pl ay e d o r p e rf o r m e d , a n d s t o r e d i n li n e wi t h t h e JIS C f ai r d e a li n g g ui d eli n e s ( av ail a bl e h e r e) fo r e d u c a t i o n al a n d n o t-fo r-p r ofi t a c tiviti e s
p r o v i d e d t h a t
• t h e a u t h o r s , ti tl e a n d full bi blio g r a p h i c d e t ail s of t h e it e m a r e ci t e d cl e a rly w h e n a n y p a r t
of t h e w o r k is r ef e r r e d t o v e r b a lly o r i n t h e w ri t t e n fo r m
• a h y p e rli n k/ U RL t o t h e o ri gi n al I n si g h t r e c o r d of t h a t it e m is i n cl u d e d i n a n y ci t a ti o n s of t h e w o r k
• t h e c o n t e n t is n o t c h a n g e d i n a n y w a y
• all fil e s r e q ui r e d fo r u s a g e of t h e it e m a r e k e p t t o g e t h e r wi t h t h e m a i n it e m fil e.
Yo u m a y n o t
• s ell a n y p a r t of a n it e m
• r e f e r t o a n y p a r t of a n it e m wi t h o u t ci t a ti o n
• a m e n d a n y it e m o r c o n t e x t u ali s e it i n a w a y t h a t will i m p u g n t h e c r e a t o r ’s r e p u t a t i o n
• r e m ov e o r a l t e r t h e c o py ri g h t s t a t e m e n t o n a n it e m .
T h e full p oli cy c a n b e fo u n d h e r e.
British Journal of Healthcare Management
Quality of care provided by the Shelford Group of NHS trusts before and after the
enactment of Health and Social Care Act of 2012 (HSCA2012).
--Manuscript
Draft--Manuscript Number: bjhc.2016.0020R1
Full Title: Quality of care provided by the Shelford Group of NHS trusts before and after the enactment of Health and Social Care Act of 2012 (HSCA2012).
Short Title: Health and Social care act of 2012 and Quality of care in England
Article Type: Original research
Keywords: Shelford Group
Quality of Care
NHS Quality Outcomes Framework Key Performance Indicators
Health and Social care act of 2012 (HSCA2012)
Corresponding Author: Reza Mofidi, M.B., M.Ch, M.B.A, M.Sc., F.R.C.S. South Tees Hospitals NHS Foundation Trust Middlesbrough, UNITED KINGDOM
Corresponding Author Secondary Information:
Corresponding Author's Institution: South Tees Hospitals NHS Foundation Trust
Corresponding Author's Secondary Institution:
First Author: Reza Mofidi, M.B., M.Ch, M.B.A, M.Sc., F.R.C.S.
First Author Secondary Information:
Order of Authors: Reza Mofidi, M.B., M.Ch, M.B.A, M.Sc., F.R.C.S.
Carol E Marrow, BA (Hons), M. Phil, PhD, RGN
Order of Authors Secondary Information:
Abstract: Health and Social Care Act of 2012 (HSCA2012) has altered the operational and business environment within which NHS trusts in England operate. Shelford group are the leading multi-specialty NHS trusts in England. The aim of this study was to assess the impact of HSCA2012 on the quality of care provided by the Shelford group. Annual quality of accounts produced by each of the Shelford group NHSTs for financial years FY 12-13, FY 13-14 and FY 14-15 were reviewed. The key performance indicators for each organization were collected and classified in line with NHS Quality Outcomes Framework (QOF). KPIs for the period just prior to enactment of HSCA2012 (FY12-13) were compared with the corresponding values for the period after the enactment of HSCA2012.The benchmarking model used in the study was validated against the Hospital Intelligent Monitoring Report (HIMR) used by the Care Quality Commission.
The clinical services provided by the Shelford group increased year on year by 7.5%, 6.4% and 4% respectively . In the FY14-15 Shelford group collectively provided 14,735,000 patient care episodes There was no significant difference in the value of the KPIs before and after enactment of HSCA2012 along the 6 domains defined by the NHS-QOF. Good correlation was observed between the benchmarking method used in the study compared with the HIMR (r2=0.86).
The quality of care provided by the Shelford group of NHS trusts did not change following enactment of HSCA2012.
Suggested Reviewers:
Response to Reviewers: Dear Sir/Madame
This manuscript has been rewritten significantly to take the reviewers comments into account. The following changes have been made:
1- The introduction and background has been shortened significantly and now includes
only pertinent material.
2- The Methodology has been shortened and simplified. The authors believe that should this paper be published, it would be one of very few publications which has used independent methodology to assess quality of care in healthcare (Rather than use the results of analyses by organisations like CQC). This is important as the authors hope that simplified methodology which is for benchmarking of quality of care which is accessible to clinicians practitioners and managers is the key to quality of care improvement. Otherwise all assessments of quality of care would be post-hoc and by regulatory organisations and would serve to regulate rather than improve services.
3-The discussion has been completely re-written and is significantly longer now. It reads more like a commentary on the health and Social care act of 2012. It discusses how the health care land scape has changed including specific changes regarding regulation of quality of care. The final 2 paragraphs which discuss integrated
healthcare systems have been retained as they discuss the way forward re delivery of quality services in the future.
Specific changes:
Table-2 is removed as it does not add significantly to the paper and the data is also presented in figure-2.
Figure-1 is removed as this figure also appears in the recent paper published by us in your esteemed journal. (Mofidi 2016).
The authors do believe that there is room for a commentary (a separate publication) on how NHS reforms have delivered efficiency and quality improvement in NHS England. Particularly with Brexit looming and the manpower and staffing challenges that are facing the NHS today.
Additional Information:
Question Response
Please enter the word count of your manuscript
3384
Quality of care provided by the Shelford Group of NHS trusts
before and after the enactment of Health and Social Care Act of
2012 (HSCA2012).
Reza Mofidi
Carol Marrow
Correspondence: Mr Reza Mofidi MB MCh MSc MBA FRCS
Department of Vascular Surgery
James Cook University Hospital
Middlesbrough, United Kingdom
TS4 3BW
Email: [email protected]
Quality of care provided by the Shelford Group of NHS trusts
before and after the enactment of Health and Social Care Act of
2012 (HSCA2012).
Abstract:
Health and Social Care Act of 2012 (HSCA2012) has altered the operational and business
environment within which NHS trusts in England operate. Shelford group are the leading
multi-specialty NHS trusts in England. The aim of this study was to assess the impact of HSCA2012
on the quality of care provided by the Shelford group.
Annual quality of accounts produced by each of the Shelford group NHSTs for financial years
FY 12-13, FY 13-14 and FY 14-15 were reviewed. The key performance indicators for each
organization were collected and classified in line with NHS Quality Outcomes Framework
(QOF). KPIs for the period just prior to enactment of HSCA2012 (FY12-13) were compared
with the corresponding values for the period after the enactment of HSCA2012.The
benchmarking model used in the study was validated against the Hospital Intelligent
Monitoring Report (HIMR) used by the Care Quality Commission.
The clinical services provided by the Shelford group increased year on year by 7.5%, 6.4% and
4% respectively . In the FY14-15 Shelford group collectively provided 14,735,000 patient care
episodes There was no significant difference in the value of the KPIs before and after enactment
of HSCA2012 along the 6 domains defined by the NHS-QOF. Good correlation was observed
between the benchmarking method used in the study compared with the HIMR (r2=0.86).
The quality of care provided by the Shelford group of NHS trusts did not change following
enactment of HSCA2012.
Anonymous manuscript Click here to download Anonymous manuscript revision.docx
Introduction
The structures and processes for delivery of healthcare in England have been evolving
continuously in the past 30 years (Jones 2010), (Cooper 2009). These reforms have been
iterative in nature (Nicoletti 2003). Health and Social Care Act of 2012 is most recent package
of healthcare reforms in England (Mofidi 2016). A significant number of NHS trusts in England
have reported a deterioration in their financial position following enactment of the Health and
Social Care Act of 2012 (Lacobucci 2014). There has been concern that this impairment in the
financial position of NHS trusts leads to the deterioration in the quality of care provided by
these organizations.
The Care Quality Commission (CQC) is the regulator of health and social care in the United
Kingdom. CQC collects surrogate markers of quality on a diverse range of key performance
indicators (KPIs) from each healthcare provider in the United Kingdom and uses these to
monitor and report the quality of care provided by each organisation(CQC 2013, Grol 2001).
The Shelford group of NHS trusts are the leading NHS trusts in England. (Hawkes 2013).The
the quality of care provided by the Shelford group is a reflection on the conditions of NHS in
England. The aim of this study was to assess the impact of HSCA2012 on quality of care
Methods
NHS trusts in England produce annual quality accounts in accordance with the National Health
Service act of 2006. This document provides the levels of clinical activity as well as the quality
of Services provided by the organisation (DOH 2013). The levels of clinical activity and quality
of care provided by each of the 10 members of the Shelford group of NHS trusts for the
financial years 2012-13 (prior to enactment of HSCA2012), 2013-14 and 2014-15 (after
enactment of HSCA2012) were collected and analysed.
Assessment of quality of care provided by the Shelford group
Quality of care was assessed using a standardized benchmarking tool. Benchmarking tools
utilize key performance indicators in order to build an accurate and reproducible picture of
quality of care provided (Donabedian 205). The CQC uses the Hospital Intelligence
Monitoring Report (HIMR) in order to assess whether healthcare providers meet the national
standards of quality and safety(Addicott 2014). The HIMR was introduced in the 3rd quarter
of 2013, after the enactment of HSCA2012(Graf 2014, Jarman2014). Therefore, HIMR could
not be used to assess quality of care before that point. HIMR was used as a gold-standard to
validate the benchmarking tool designed and used for this study.
The benchmarking tool which was used in this study was inspired by the Acute Trust Quality
Dashboard® (ATQD). ATQD is a benchmarking tool which was developed by East Midlands
Quality Observatory, using over 50 quality indicators and performance metrics to provide
quarterly reports for each NHS Trust(Gray 2011). Unprocessed quarterly values for the KPIs
for the years 2012, 2013, 2014 and the first quarter of 2015 were obtained from the annual
benchmarking tool were those pertaining to the delivery of non-specialist care in an acute NHS
trusts. The indicators were grouped into 6 domains in line with NHS Quality Outcomes
Framework(Gillam 2012), (Table-1), and analysed using cross-sectional as well as time series
analysis:
Cross-sectional examination: examines organisational outcomes for each quarter providing a
snapshot of activities of the organisation. This involves calculating the variance (deviation) of
each KPI from the mean value. In order to perform cross-sectional analysis, Z scores were
calculated:
Z= (Trust Outcome-Expected Value)/ (Standard deviation for that value at the specified time)
The predefined value which triggers an adverse outcome for each KPI was 2 standard
deviations in the undesired direction from mean value for all the acute NHS trusts in England.
Time series assess risk by examining a series of indicators over a time, detecting trends and
highlights any deterioration of KPI measures before an outcome indicator reaches a threshold
of concern.Using each of the available KPI values from the 12 quarters studied, time series
were constructed and analysed using the Cumulative Sum method (CUSUM) as follows:
CUSUMt= Max{CUSUMt-1+Wt,0}
CUSUM at time=t is the Sum of CUSUM at time=t-1 and the Wt which is the weightor Log of
likelihood ratios when the weight is greater than zero (This is done so the CUSUM calculations
Validating the benchmarking tool
HIMR was considered the gold standard benchmarking tool. The HIMR risk scores for
FY-2013-14 and FY-2014-15 were obtained and used for direct comparison with the corresponding
values obtained from the benchmarking tool used in this study. The comparison between HIMR
and the quality benchmarking tool was performed using coefficient of correlation as well as
Bland-Altman analysis (Bland 1999) using direct comparison of proportional risk scores
(calculated by HIMR) with the corresponding value obtained for the years 2013 and 2014 using
the benchmarking tool used in this study.
Statistical Analysis
Statistical analysis was performed using the Statistical Package for Social Sciences, version 23
(SPSS, Inc., Chicago, IL). Matched sets of quality indicators were treated as the primary units
for analysis from which changes in quality measures before and after enactment of HSCA2012
were compared. Benchmarking scores were considered continuous variables and were
compared using a paired student t-test. Man-Whitney test was used to compare non-parametric
variables. The number of at risk indicators for each of the 6 domains of NHS-QOF before and
Results
The Shelford group NHSTs provided 13,197,281 patient care episodes in the FY2012/13,
14,188,708 in FY2013/14 and 14,735,000 in FY14/15. representing annual increases of 7.5%
6.4% and 4% in levels of clinical activity respectively.
Validation of the benchmarking model for assessment of Quality of care
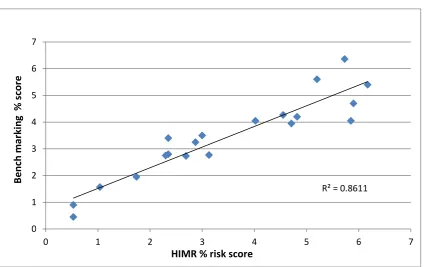
A close correlation was observed between HIMR percentage risk-score and the corresponding
value from the benchmarking model used in this study (Figure-1A). Bland-Altman analysis
revealed a high degree of agreement between the HIMR and the benchmarking model used in
this study (Figure-1B).
Assessment of Quality of care
Domain-1 Preventing People from dying prematurely
This domain includes 4 different KPIs and is the final arbiter of how care is provided by acute
hospitals. Figures 3A to D illustrate progression of each KPI over 12 quarters (second quarter
of 2012 to the first quarter of 2015) in the 10 organizations studied. There was no significant
difference between Standardised mortality ratios (SMR)s before and after enactment of
HSCA2012, (P=0.65). Similarly with regards to mortality for low-risk conditions, (P=0.74),
(Figure-3B) and in-hospital crude mortality rate for high-risk conditions (Cardiovascular,
Respiratory, Liver disease) in under 75 year olds (P=0.77), (Figure-3D) no differences were
observed between the period before HSCA2012 and the two years after the enactment of
Perinatal mortality is a complex KPI. Its absolute value depends on a range of variables
including the complexity of cases treated in each organization. There was a small but
significant reduction in perinatal mortality between the year before [mean: 7/1000 births
(standard deviation: 1.85)] and the 2 years immediately after enactment of HSCA2012 [mean:
6.15/1000 births (standard deviation: 1.85)], (P=0.045), Figure-3C). Prior to enactment of
HSCA2012 out of 156 available KPI data points in domain-1, 6 were considered adverse
outcomes following enactment of HSCA2012 out of 312 available KPI data points 14 were
adverse outcomes (χ2=0.42, P=NS).
Domain-2 Enhancing Quality of life for patients with long-term conditions
Many patients in acute hospitals suffer from long-term conditions which are not amenable to
cure. Transforming care of these patients is critical to delivering better quality of services
(Gillam 2012). Table-2 lists the mean value (standard deviation) of each of these KPIs before
and after HSCA2012. There was a significant increase in the incidence of admissions in
patients with dementia no significant difference was observed in the value of other domain-2
key performance indicators. Prior to the enactment of HSCA2012, 38 out of 360 available KPI
quarterly data points registered a risk compared with 49(out of 720) after HSCA2012. This
difference was not statistically significant (χ2=1.82, P=0.18).
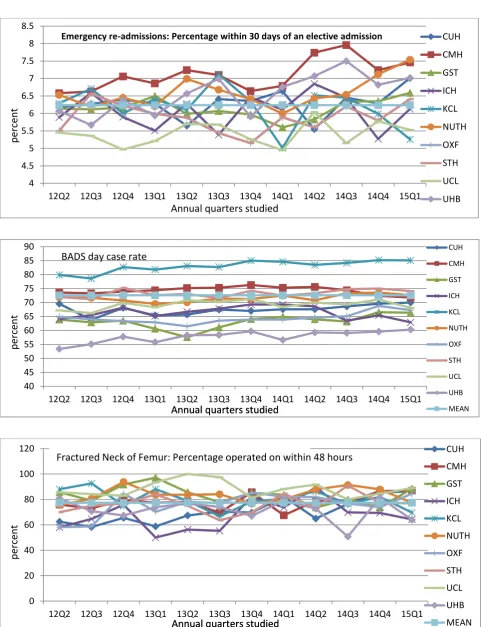
Domain-3 Helping patients recover from episodes of ill health
Re-admissions to hospital soon after a period of hospital stay are surrogate markers of
post-treatment complications. It may also indicate that care was not adequately planned or that the
patient has not been given adequate support for self-care(Gillam 2012). Table-3 lists the mean
significant difference in in the incidence of at risk indicators in this domain before and after
the enactment of HSCA2012 (χ2=1.08, P=NS). Figure-4 illustrates the quarterly trends in 2
representative KPIs in this domain.
Domain-4 Ensuring that patients have a positive experience of their care
The focus of domain-4 relates to time to treatment. These KPIs are important as they are in
public domain had have been regularly discussed in media. Traditionally inability to meet these
KPIs has attracted financial penalties. Table-4 lists these KPIs before and after enactment of
HSCA2012. Assessment of quarterly results revealed a small but significant difference in one
of these indicators (accident and emergency 4 hour wait); no significant difference was seen in
the rest (Table-5). There was no difference in the number of domain-4 at risk indicators before
and after enactment of HSCA2012 (χ2=2.44, P=0.15).
Domain-5 Caring for people in a safe environment
Patient safety is very important attribute of any healthcare organization. Table-6 lists these
KPIs. Incidence of adverse events (venous thrombo-embolism, healthcare associated infections
and pressure sores, patient harm episodes) is closely monitored by the CQC. As table-5
illustrates the quarterly incidence of these events did not increase after HSCA2012. There was
a significant reduction in rate of moderate or severe patient safety incidents and increased
compliance with standardized VTE assessments at the time of admission. There was no
difference in the number of domain-5 at risk indicators before and after enactment of
Domain-6 Organizational context
The importance of leadership in bringing about organizational goals in acute hospitals is
recognized by the NHS. Whilst there are no reliable tools for assessment of organizational
attributes, efficiency by which an organization is run and the way it is perceived by its staff
and staffing levels are the means by which quality of leadership in NHS trusts is assessed. This
being relatively new domain it is likely to develop further. Table-6 lists these KPIs and records
their mean value (standard deviation) before and after enactment of HSCA2012. There were
some improvements in these indices such as in depth and quality of recording clinical activities
(coding) for care episodes provided and the use of integrated palliative care pathway
(addressing the needs of patients in whom their condition is not amenable to treatment). There
was no difference in the number of domain-6 indictors registering risk before and after
Discussion
In today’s world of Brexit Britain, the Health and Social Care Act of 2012 feels like old news.
A relic from a bygone era, a time of coalition politics, when we still listened to the alternative
points of view. This alternative point of view at that time was that HSCA2012 would privatise
and eventually put pay to the NHS as we know it (Pollock 2011, Pollock 2012). The acts’ critics
argue that HSCA2012 has been responsible for deepening health inequalities (Hunter 2011),
has led to rationing of services (Lister 2012) and worsened democratic accountability by ending
provision of healthcare by the state sector (Peedell 2011 and Davies 2013). Whilst its’
proponent point to opportunities for expansion of capacity and innovative practices which lead
to better services through private sector investment (Le Grand 2013). Despite the dissenting
nature of the opposing viewpoints, the criticisms of the initial Health and Social Care Bill
(2011) did much to shape the eventual HSCA2012. HSCA2012 remains the most
comprehensive set of structural changes in delivery of healthcare in England for at least 30
years and attracts similar amounts of controversy when discussed today as it did when it was
introduced in April 2013 (Blumenthal). In a splendid review of the healthcare market in
England following the enactment of HSCA12, Krachler et al. showed that HSCA2012 meets
the most commonly accepted definitions of ‘privatisation’ and is the logical progression of the
process of ‘marketization’ which had been gradually happening in the preceding 20 to 25 years
(Krachler 2013).
Many commentators trace any deficiencies in hospital care in England back to HSCA2012. A
lot has been said and written about the organisational and structural changes brought about by
the HSCA2012 and participation of the private sector in the delivery of secondary and tertiary
services (Speed 2013, Marshall 2014, Mofidi 2016). The provisions of HSCA2012 on quality
drafted and enacted following the publication of the Francis report into the Mid-Staffordshire
NHS trust and consequently contains significant provisions regarding efficacy and quality of
services provided by secondary and tertiary services (Speed 2013). Amongst these were
establishing NHS commissioning boards tasked with assessing the efficacy of treatments and
the introduction of quality outcome frameworks for secondary care services.
The adoption of quality outcomes frameworks (QOFs) have helped consolidate
evidence-based methods for quality improvement initiatives in healthcare. The use of QOFs
have been associated with improvements in quality of care, reductions in mortality and hospital
admissions, by creating structured clinical benchmarks which can be used to compare outcomes
(Gillam 2012). Although QOFs have been perceived as a threat to professionalism and
clinical autonomy of health professionals, the fact that HIMR has been designed around
NHS-QOF means that all new services being commissioned and quality improvement programs need
to be responsive to and designed around NHS-QOF as this will be the framework by which
they will be assessed (Checkland 2010).
This study revealed no evidence of deterioration in quality of care provided by
the Shelford group after enactment of HSCA2012. In fact, there were moderate but significant
improvements in some of the KPIs studied. These findings were consistent throughout
the 6 domains which characterize the NHS-QOF (Diley 2014). These domains are
comprehensive and cover aspects of quality of care. NHS-QOF replaces the use of standardized
mortality rates as the sole means of assessment of quality. Standardised mortality ratios are
merely one aspect of one of the 6 domains of NHS-QOF(Mant 2001). Calculation of mortality
ratios is prone to some methodological bias(Mohammad 2009). This bias is minimized if
As one might expect, there is a positive correlation between productivity of healthcare systems
and the availability of capital and labour (Wilkie 2010). Although it is possible to increase
productivity through efficiency, a point is reached where the system runs close to or at
maximum efficiency beyond which further attempts at cost-control or increasing productivity
result in either reduced quality or generation of a funding gap (Appleby 2015). This is known
as the productivity frontier (Porter 2009). When this point is reached, inevitable trade-offs
between quality and cost of care would have to be made however implicit and undesirable this
may be (Jones 2011). For example, it is commonly observed that bed occupancy greater than
85% leads to increased risk of hospital acquired infections, serious errors and higher mortality
(Jones 2015).
Bed occupancy greater than 85% is a surrogate marker of reduced staff per patient ratios and
is an indicator of a cost efficient but under resourced service (Jones 2011, 2015, 2016). Jones
et al reported a close correlation between annual Summary Hospital-level Mortality Indicator
(SHMI) and inpatient bed occupancy above 85% (Jones 2016). Stargardt and co-workers have
examined the relationship between hospital costs and mortality from acute myocardial
infarction and revealed that even following relatively modest reductions in costs there is a
measurable increase in mortality rates (Stargardt 2014). No healthcare manager explicitly sets
out a process of cost-control at the expense of quality, yet this does not mean that such
trade-offs do not happen implicitly. If such a process is continued to its logical conclusion, the
inevitable outcome is the position which Mid-Staffordshire NHS trust found itself in.
External drivers for productivity are well known and include competition, regulation and
HSCA2012 has had a significant impact on these external drivers. It has changed the
competitive environment within NHS England, and created Monitor which regulates the flow
of capital to the NHS foundation trusts as well as local and regional healthcare markets. Labour
market is regulated by the General Medical and Nursing councils which are in responsible for
certification and revalidation healthcare professionals and the Royal Colleges (Physicians,
Surgeons, GPs and Midwifery and Nursing) which are involved in training and workforce
planning.
When it comes to reforming healthcare processes, NHS England’s major leverage over
secondary and tertiary care services remains commissioning (Krachler 2013). HSCA2012
abolished the primary care trusts and strategic health authorities and created Clinical
Commissioning Groups (CCGs) which are staffed by general practitioners, nurses and lay
members and commission (purchase) services for a geographically defined area. This
arrangement heavily favours the incumbent providers which are the NHS trusts (Krachler
2013). CCGs are advised by ‘Health And Wellbeing Boards’, Monitor (the financial regulator
of NHS) and of course the CQC. The process of marketisation after enactment of HSCA2012
is characterised by a complex and fragmented regulatory environment (Krachler 2013).
HSCA2012 is only one of many challenges facing NHS trusts in this decade. In fact, almost all
of the internal and external drivers for change are liable to undergo significant change.
Prolonged austerity and iterative efficiencies introduced through QIPP (Quality, Innovation,
Productivity and Prevention) program (HSC 2013) have reduced available capital whilst
changes to medical and nursing licencing and tightening of immigration rules have effected
availability of appointable staff. Under these circumstances internal drivers of productivity can
services transformational change is needed. Value based healthcare which has been proposed
by the distinguished Harvard economist Michael Porter is an example of such change (Porter
2010).
Value-based healthcare seeks to enhance the quality of care by placing the entire cycle of
disease-specific care in new organizational structures which have at their disposal all the
resources required to effectively treat the condition, focusing on the value provided to the
patient (Porter 2009). MD Anderson cancer center in Houston Texas reported significant
improvements in cancer related outcomes and patient experience following an institution-wide
reorganization to incorporate value-based principles (Pollock 2008). Recent experience with
delivery of a purely integrated healthcare system in Germany suggests that in addition to
the qualitative benefits, such a system is associated with significant cost savings (Hildebrandt
2012). Developing value-based solutions requires levels of coordination and collaboration
between stakeholders currently lacking in NHS. Optimizing and coordinating activities of NHS
trusts into a seamless process is a potential and yet untapped source of efficiency and
References
Addicott R (2014). How do Care Quality Commission hospital inspections measure up? The Kings Fund.http://www.kingsfund.org.uk/blog/2014/07/how-do-care-quality-commission-hospital-inspections-measure.
Appleby J (2015). UK NHS: Less money (but more bangs per buck)? BMJ, 350, h1037. doi: http://dx.doi.org/10.1136/bmj.h1037.
Bland JM, Altman DG (1999). Measuring agreement in method comparison studies. Statistical methods in medical research, 8(2), 135-160.
Blumenthal, D., & Dixon, J. (2012). Health-care reforms in the USA and England: areas for useful learning. The Lancet, 380(9850), 1352-1357.
Checkland K, Harrison S (2010). The impact of the Quality and Outcomes Framework on practice organisation and service delivery: summary of evidence from two qualitative studies. Quality in primary care; 18(2): 139-146.
Cooper ZN, McGuire A, Jones S, Le Grand J. (2009). Equity, Waiting Times and NHS reforms: Retrospective study. British Med J; 339:b3264.
CQC S 2013. Intelligent Monitoring – NHS acute hospitals: statistical methodology.
http://www.cqc.org.uk/sites/default/files/20141127_intelligent_monitoring_statistical_methodology.pdf
CQC M 2013. Intelligent Monitoring – NHS acute hospitals: indicators and methodology.
http://www.cqc.org.uk/sites/default/files/20141127_intelligent_monitoring_indicators_methodology_v4.pdf
Davies, A. C. (2013). This time, it's for real: the Health and Social Care Act 2012. The Modern Law Review, 76(3), 564-588.
Department of Health (2013). NHS foundation trusts: annual reporting manual
2013/14.https://www.gov.uk/government/publications/nhs-foundation-trusts-annual-reporting-manual-2013-to-2014
Diley I, Badrinath P, Annon S (2014). Is mortality a good indicator of the clinical quality of National Health Service hospitals? A cross-sectional study of outlier trusts for mortality indices using quality dashboards. JRSM Open, 5(8), 2054270414533325. doi:10.1177/2054270414533325.
Donabedian A (2005). Evaluating the quality of medical care. Milbank Q.;83(4):691-729.
Fox JT, Smeets V (2011). Does input quality drive measured differences in firm productivity? National Bureau of Economic Research Working Paper www.nber.org/papers/w16853.
Gillam SJ, Siriwardena AN, Steel N (2012). Pay-for-performance in the United Kingdom: impact of the Quality and Outcomes Framework—a systematic review. The Annals of Family Medicine, 10(5), 461-468.
Graf B, Richards M (2014). Inspection as a driver for quality improvement. Future Hospital Journal, 1(2), 76
Gray M, Swift S, Suleman M, SHA EM, Beasley N et al (2011) Value Based Clinical Commissioning of Elective Surgical Care. http://www.rightcare.nhs.uk/wp
content/uploads/2011/12/right_care_elective_surgery_phase1_report.pdf.
Grol, R. (2001). Improving the quality of medical care: building bridges among professional pride, payer profit, and patient satisfaction. JAMA, 286(20), 2578-2585.
Health Select Committee of The House of Parliament of the United kingdom (2013). http://www.publications.parliament.uk/pa/cm201213/cmselect/cmhealth/651/65107.htm
Hildebrandt H, Schulte T, Stunder B (2012). Triple Aim in Kinzigtal, Germany: Improving population health, integrating health care and reducing costs of care-lessons for the UK? Journal of Integrated Care, 20(4), 205-222.
Hunter DJ (2013). Will 1 April mark the beginning of the end of England’s NHS? Yes. BMJ, 346, 1951.
Jarman B (2014). Quality and safety in healthcare revisited: a challenge to anaesthetists. Anaesthesia, 69(6), 531-536.
Jones R (2010). The nature of healthcare costs and financial risk in commissioning. British Journal of Healthcare Management 16(9): 424-430.
Jones R (2011) Hospital bed occupancy demystified and why hospitals of different size and complexity must operate at different average occupancy. BJHCM 17(6): 242-248.
Jones R (2015) Recurring outbreaks of an infection apparently targeting immune function, and consequent unprecedented growth in medical admission and costs in the United Kingdom: A review. British Journal of Medicine and Medical Research 6(8): 735-770. doi: 10.9734/BJMMR/2015/14845
Jones R (2016) Bed occupancy and hospital mortality. British Journal of Healthcare Management 22(6): 380-381.
Lacobucci G (2014). Foundation trusts in England record overall deficit for first time. British Medical Journal349: doi: http://dx.doi.org/10.1136/bmj.g5769.
Le Grand, J., 2013. Will 1 April mark the beginning of the end of England’s NHS? No. BMJ, 346, p.f1975.
Lister, J. (2012). In defiance of the evidence: conservatives threaten to “reform” away England's National Health Service. International Journal of Health Services, 42(1), 137-155.
Mant J. (2001). Process versus outcome indicators in the assessment of quality of health care. International Journal for Quality in Health Care;13(6):475-80.
Marshall L, Charlesworth A, hurst J. (2014). The NHS payment system: evolving policy and emerging evidence. Nuffield trust.
http://www.nuffieldtrust.org.uk/sites/files/nuffield/publication/140220_nhs_payment_research_report.pdf.
Mofidi, R., Marrow, C. (2016). Effects of the NHS reforms on financial sustainability. British Journal of Healthcare Management, 22(11), 561-571.
Mofidi R, Wong P, Gatenby T, Milburn S. (2016). Value based healthcare and delivery of vascular surgery services in the United Kingdom. Reviews in Vascular Medicine; 6:1-9.4
Mohammed MA, Deeks J, Girling A, Rudge G, Carmalt M, Stevens AJ, Lilford RJ (2009). Evidence of methodological bias in hospital standardised mortality ratios: retrospective database study of English hospitals. BMJ; 338:b780. doi:10.1136/bmj.b780
Nicoletti, G Scarpetta S (2003). Regulation, Productivity Growth, the OECD experience. Economic Policy; 18(36): 9-72.
Pollock RE (2008). Value-based health care: the MD Anderson experience. Annals of surgery; 248(4), 510-516.
Pollock A, Price D, Roderick P, Treuherz T, McCoy D, McKee M and Reynolds L (2012) ‘How the Health and Social Care Bill 2011 Would End Entitlement to Comprehensive Health Care in England’, The Lancet 379: 387– 389.
Porter ME. (2009). A Strategy for Health Care Reform Toward a Value-Based System. N Engl J Med; 361:109-112.
Porter ME (2010). What is value in health care? N Engl J Med; 363:2477-81.
Speed, E., & Gabe, J. (2013). The Health and Social Care Act for England 2012: the extension of ‘new professionalism’. Critical Social Policy, 33(3), 564-574.
Stargardt, T., Schreyögg, J., & Kondofersky, I. (2014). Measuring the relationship between costs and outcomes: the example of acute myocardial infarction in German hospitals. Health economics, 23(6), 653-669.
Syverson C (2011). What determines productivity? Journal of Economic Literature, 49(2):326–65.
Bloom N, Van Reenan J (2007). Measuring and explaining management practices across firms and countries. Quarterly Journal of Economics; 122(4): 1351–408.
Wilkie P (2010). ‘Does the patient always benefit?’ The Quality and Outcomes Framework: QOF-transforming general practice. Heath I, Siriwardena A (Eds). Radcliffe Publishing.
Captions for Figures and Tables:
Table-1: The 6 domains which encompass NHS Quality Outcomes Framework (Gillam 2012).
Table-2: Domain-2 KPIs assessing enhancing quality of life for patients with long term conditions mean values (standard deviations) before and after enactment of the HSCA2012 are listed as are the probability values for difference between the two for each KPI.
Table-4: Domain-4 KPIs before and after enactment of HSCA2012.
Table-5: Domain-5 KPIs before and after enactment of HSCA2012.
Table-6: Key Performance Indicators relating to organizational development before and after enactment of HSCA2012.
Figure-1A: The correlation between HIMR % risk and the benchmarking risk score used in this dissertation
Figure-1B: Bland-Altman analysis applied to the comparison between the HIMR and benchmarking risk score used in the study. The difference between two values in each data point lies within 2 standard deviation of mean difference suggesting high degree of agreement and absence of a structural bias.
Figure-2(A): Hospital mortality from conditions amenable to healthcare (Standardized Mortality Ratio).
Figure-2(B): In-hospital mortality in low risk diagnosis groups (per 1,000 admissions).
Figure-2(C): In-hospital perinatal mortality, including still births (per 1,000 births). Note this value is dependent on the complexity of perinatal and intensive care services provided.
Figure-2(D): In-hospital mortality rate for Cardiovascular/Respiratory/Liver disease in patients 75 years of age (per 1,000 admissions).
Domain Description Number of KPIs
Domain-1 Preventing people from dying prematurely 4
Domain-2 Enhancing Quality of life for patients with long term conditions 8
Domain-3 Helping people recover from episodes of ill health 11
Domain-4 Ensuring patients have a positive experience of care 9
Domain-5 Treating patients in a safe environment (prevent avoidable harm) 10
Domain-6 Metrics relating to organisational development 10
Table-1: The 6 domains which encompass NHS Quality Outcomes Framework (Gillam 2012).
Pre HSCA 2012 Post HSCA 2012 p
Emergency admissions for Ambulatory Care Sensitive Conditions
193(15.7) 198.8(16.2) 0.062
Length of Stay for emergency admissions for Ambulatory Care Sensitive Conditions
6 (1.3) 5.95(0.98) 0.83
Emergency admissions for asthma, diabetes and epilepsy in under 19 year olds
51.23(18.4) 50.75(16.1) 0.89
Length of Stay for emergency admissions for asthma, diabetes, and epilepsy
2.11 (1.1) 2.34 (0.97) 0.27
Emergency admissions for patients age 65 and over with Dementia
131.4(20.8) 140.2(19.1) 0.029
Length of Stay for patients aged over 65 admitted in an emergency with Dementia
16.57(3.08) 16.49(3.27) 0.89
Length of Stay for patients age 65 and over admitted in an emergency
11.43(2.56) 11.2(1.92) 0.6
Length of Stay for patients age 65 and over admitted for or with a fall
13.16(3.2) 12.32(3.41) 0.2
Table-3: Domain-2 KPIs assessing enhancing quality of life for patients with long term
conditions mean values (standard deviations) before and after enactment of the
HSCA2012 are listed as are the probability values for difference between the two for each
KPI.
KPI
Pre-HSCA2012
Post
HSCA2012 p
Emergency re-admissions: Percentage within 30 days of an elective
admission 6.14 (0.46) 6.25 (0.68) 0.27
Emergency re-admissions: Percentage within 2 days of an elective admission 0.79 (0.15) 0.83 (0.15) 0.16
Emergency re-admissions: Percentage within 30 days of a non-elective
admission 12.21 (1.72) 12.43 (2.05) 0.54
Emergency re-admissions: Percentage within 2 days of a non-elective
admission 2.29 (0.27) 2.34 (0.28) 0.32
Average Length of Stay for elective admissions 3.55 (0.65) 3.59 (0.66) 0.76
Average Length of Stay for non-elective admissions 5.75 (1.03) 5.8 (0.92) 0.82
Patient Reported Outcome Measures for primary hip replacement (Adjusted
average health gain) 21.39 (0.69) 21.65 (1.17) 0.15
Patient Reported Outcome Measures for primary knee replacement
(Adjusted average health gain) 15.56 (1.43) 15.57 (1.00) 0.78
BADS Day Case Rate 68.6 (6.84) 69.6 (6.9) 0.25
Day-case to Inpatient Conversion Rate 4.54 (0.98) 4.65 (0.99) 0.6
Fractured Neck of Femur: Percentage operated on within 48 hours 76.2 (11.64) 78.3 (9.12) 0.33
Table-3: Domain-3 KPIs assessing Helping patients recover from episodes of ill health. Mean
values (standard deviations) before and after enactment of the HSCA2012 are listed as are
the probability values for difference between the two for each KPI.
KPI Pre-HSCA2012
Post
HSCA2012 p
Friends and Family Score: In-Patient NA 94.94 (2.48) NA
Friends and Family Score: Accident & Emergency NA 88.67 (3.87) NA
A&E 4hr Wait (Percentage seen within 4 hours) 95.7 (2.14) 94.5 (1.93) 0.02
Diagnostic waits: Percentage of patients waiting over 6 weeks 90.4 (3.55) 89.75 (3.42) 0.34
Inpatient Referral to Treatment (RTT): Percentage of patients seen
within 18 weeks
90.5 (3.1) 89.75 (3.42) 0.26
Cancellations of elective surgery for non-clinical reasons (rate per
1,000 procedures)
7.99 (3.44) 9.15 (4.48) 0.12
Cancer waits: Percentage with first out-patient appointment within
14 days of referral
95.94 (1.52) 95.94 (1.79) 0.91
Cancer waits: Percentage waiting less than 31 days from diagnosis to
first treatment
97.38 (2.39) 97.34 (1.55) 0.93
Cancer waits: Percentage waiting less than 62 days from GP referral
to first treatment
84.7 (6.77) 83.2 (65.42) 0.22
Table-4: Domain-4 KPIs before and after enactment of HSCA2012.
KPI
Pre-HSCA2012
Post
HSCA2012 p Patient safety incidents (Crude rate per 100 admissions) 7(3.15) 7.78(3.48) 0.22
Patient safety incidents causing at least moderate harm (Proportion of all
incidents reported) 6.34 (3.77) 3.28(1.91) 0.008
Never Events (Crude rate per 1,000,000 bed days) NA 1.94 (1.12) NA
Harm free care: Percentage of patients with no harms recorded NA
97.78
(0.98) NA
Pressure ulcers: Percentage of patients with a newly acquired pressure ulcer
(category 2,3 and 4) NA 0.89 (0.4) NA
Percentage of patients with a hospital acquired VTE NA 0.54 (0.29) NA
VTE Assessments: Percentage of patients undergoing a VTE assessment on
admission 88.4 (8.41) 95.1 (2.4) 0.01
Medication errors (Crude rate per 1,000 bed days) 8.9(3.1) 10.0(3.3) 0.067
MRSA bacteraemia (Crude rate per 1,000,000 occupied bed days) 14.4 (12.1)
16.48
(12.9) 0.39
Clostridium difficile infection (Crude rate per 100,000 occupied bed days) 21.8 (8.04) 19.1 (7.66) 0.08
MSSA bacteraemia (Crude rate per 100,000 occupied bed days) 10.3 (4.48) 10.4 (4.45) 0.9
VTE: Venous Thrombo-embolism
Table-5: Domain-5 KPIs before and after enactment of HSCA2012.
KPI Pre HSCA2012 Post HSCA2012 p
Depth of coding: Mean number of secondary diagnoses 3.15(1.23) 3.53(0.43) <0.0001
Mean Charlson co-morbidity score 3.5(1.1) 3.47(0.88) 0.88
Proportion of palliative care episodes (ICD10: Z515) per 1,000
episodes 5.41(1.86) 6.67(1.66) 0.0006
Proportion of episodes with palliative medicine as main
specialty per 1,000 episodes 0.25(0.63) 0.25(0.62) 0.94
Use of integrated palliative care pathway: Proportion of
episodes with diagnosis Z518 per 1,000 episodes 2.01(0.82) 3.35(1.08) 0.018
Full Time Equivalent (FTE) nurses per occupied bed day 2.27(0.21) 2.25(0.2) 0.54
Full Time Equivalent (FTE) medical staff per occupied bed day 0.94(0.24) 1.01(0.24) 0.26
Overall sickness: Percentage of Full Time Equivalent (FTE) days
available 3.69(0.68) 3.62(0.7) 0.56
Staff recommendation of the trust as a place to receive
treatment (Percentage) 74.3(9.04) 74.7(8.63) 0.85
Staff recommendation of the trust as a place to work
(Percentage) 63.3(7.5) 66.74(6.9) 0.86
Table-6: Key Performance Indicators relating to organizational development before and after enactment of HSCA2012.
Figure-1A: The correlation between HIMR % risk and the benchmarking risk score used in this dissertation
Figure-1B: Bland-Altman analysis applied to the comparison between the HIMR and benchmarking risk score used in the study. The difference between two values in each data point lies within 2 standard deviation of mean difference suggesting high degree of agreement and absence of a structural bias.
R² = 0.8611
0 1 2 3 4 5 6 7
0 1 2 3 4 5 6 7
HIMR % risk score
B en ch marki n g % sc o re -2 -1.5 -1 -0.5 0 0.5 1 1.5 2 2.5
0 1 2 3 4 5 6
Mean value Di ffe re n ce b e tw e e n HI M R an d b e n ch m ar king % r is k
+ 2 std deviation
- 2 std deviation Mean difference
Figure-2(A): Hospital mortality from conditions amenable to healthcare (Standardized Mortality Ratio).
Figure-2(B): In-hospital mortality in low risk diagnosis groups (per 1,000 admissions).
0 20 40 60 80 100 120 140 160
12Q2 12Q3 12Q4 13Q1 13Q2 13Q3 13Q4 14Q1 14Q2 14Q3 14Q4 15Q1
CUH CMH GST ICH KCL NUTH OXF STH UCL UHB Mean Sta n d ar d iz ed Mo rta lity r ati o s %
Annual quarters studied
0 0.5 1 1.5 2 2.5
12Q2 12Q3 12Q4 13Q1 13Q2 13Q3 13Q4 14Q1 14Q2 14Q3 14Q4 15Q1
CUH CMH GST ICH KCL NUTH OXF STH UCL UHB Mean Annual quarter studied
C ru de ra te pe r 1 0 0 0 a dmi ssion s
Figure-2(C): In-hospital perinatal mortality, including still births (per 1,000 births). Note this value is dependent on the complexity of perinatal and intensive care services provided.
Figure-2(D): In-hospital mortality rate for Cardiovascular/Respiratory/Liver disease in patients 75 years of age (per 1,000 admissions).
0 2 4 6 8 10 12 14
12Q2 12Q3 12Q4 13Q1 13Q2 13Q3 13Q4 14Q1 14Q2 14Q3 14Q4 15Q1
CMH GST ICH KCL NUTH OXF STH UCL UHB Mean
Annual quarter studied
Per 1 0 0 0 b ir th ss 0 5 10 15 20 25 30 35 40
12Q2 12Q3 12Q4 13Q1 13Q2 13Q3 13Q4 14Q1 14Q2 14Q3 14Q4 15Q1
CUH CMH GST ICH KCL NUTH OXF STH UCL UHB Mean Per 1 0 0 0 a d mi ss io n s
Figure-3 Quarterly rate of a number of domain 3 indicators. (BADS: British Association for Day Surgery)
4 4.5 5 5.5 6 6.5 7 7.5 8 8.5
12Q2 12Q3 12Q4 13Q1 13Q2 13Q3 13Q4 14Q1 14Q2 14Q3 14Q4 15Q1
CUH CMH GST ICH KCL NUTH OXF STH UCL UHB p erce n t
Annual quarters studied
Emergency re-admissions: Percentage within 30 days of an elective admission
40 45 50 55 60 65 70 75 80 85 90
12Q2 12Q3 12Q4 13Q1 13Q2 13Q3 13Q4 14Q1 14Q2 14Q3 14Q4 15Q1
CUH CMH GST ICH KCL NUTH OXF STH UCL UHB MEAN p erce n t
Annual quarters studied Annual quarters studied BADS day case rate
0 20 40 60 80 100 120
12Q2 12Q3 12Q4 13Q1 13Q2 13Q3 13Q4 14Q1 14Q2 14Q3 14Q4 15Q1
CUH CMH GST ICH KCL NUTH OXF STH UCL UHB MEAN p erce n t
Annual quarters studied Annual quarters studied
Fractured Neck of Femur: Percentage operated on within 48 hours
Figure (i.e. diagram, illustration, photo) Click here to download Figure (i.e. diagram, illustration, photo)