19
in Software Effort Estimation
MICHAEL F. BOSU,
University of Otago and Waikato Institute of Technology, New ZealandSTEPHEN G. MACDONELL,
University of Otago, New ZealandData is a cornerstone of empirical software engineering (ESE) research and practice. Data underpin numerous process and project management activities, including the estimation of development effort and the prediction of the likely location and severity of defects in code. Serious questions have been raised, however, over the quality of the data used in ESE. Data quality problems caused by noise, outliers, and incompleteness have been noted as being especially prevalent. Other quality issues, although also potentially important, have received less attention. In this study, we assess the quality of 13 datasets that have been used extensively in research on software effort estimation. The quality issues considered in this article draw on a taxonomy that we published previously based on a systematic mapping of data quality issues in ESE. Our contributions are as follows: (1) an evaluation of the “fitness for purpose” of these commonly used datasets and (2) an assessment of the utility of the taxonomy in terms of dataset benchmarking. We also propose a template that could be used to both improve the ESE data collection/submission process and to evaluate other such datasets, contributing to enhanced awareness of data quality issues in the ESE community and, in time, the availability and use of higher-quality datasets.
CCS Concepts: •Information systems→Data provenance;Incomplete data;Inconsistent data; Additional Key Words and Phrases: Data quality, benchmarking, empirical software engineering, software effort estimation, noise, missing data
ACM Reference format:
Michael F. Bosu and Stephen G. Macdonell. 2019. Experience: Quality Benchmarking of Datasets Used in Software Effort Estimation.J. Data and Information Quality11, 4, Article 19 (August 2019), 38 pages. https://doi.org/10.1145/3328746
1 INTRODUCTION
As the name implies, empirical software engineering (ESE) employs observational data in the mod-elling and understanding of software engineering phenomena. ESE has gained particular promi-nence in the past decade after Kitchenham Dybå and Jorgensen (2004) espoused the ambitions
The work of M.F. Bosu was supported by a University of Otago Doctoral Scholarship. M.F. Bosu also thanks the Gradu-ate Research Committee of the University of Otago for supporting this research with a PostgraduGradu-ate Publishing Bursary (doctoral).
Authors’ addresses: M. F. Bosu and S. G. MacDonell, Department of Information Science, University of Otago, New Zealand; emails: [email protected], [email protected].
Author’s current address: M. F. Bosu is currently with the Centre for Information Technology, Wintec, Private Bag 3036, Waikato Mail Centre, Hamilton 3240, New Zealand; email: [email protected]; S. G. MacDonell is also with the School of Engineering, Computer and Mathematical Sciences, Auckland University of Technology, Private Bag 92006, Auckland 1142, New Zealand; email: [email protected].
Permission to make digital or hard copies of all or part of this work for personal or classroom use is granted without fee provided that copies are not made or distributed for profit or commercial advantage and that copies bear this notice and the full citation on the first page. Copyrights for components of this work owned by others than ACM must be honored. Abstracting with credit is permitted. To copy otherwise, or republish, to post on servers or to redistribute to lists, requires prior specific permission and/or a fee. Request permissions [email protected].
© 2019 Association for Computing Machinery. 1936-1955/2019/08-ART19 $15.00
of evidence-based software engineering, being the incorporation of up-to-date research evidence with practical experience, tempered by human values when making decisions during software development and maintenance. ESE was preceded by “software metrics,” a term that referred to activities and data associated with measurement in software engineering. Some of these activities revolved around the production or collection of values to characterize software code properties (the “classic” software metrics) and the development of models to predict various aspects of soft-ware, such as resource requirements, defect rates, broader quality concerns, development effort, and others. The central role of data was evident even then—Hall and Fenton (1997) described soft-ware metrics as including the collection of quantitative measures as a key part of softsoft-ware quality control and assurance activities (and specifically the monitoring and recording of defects during development and testing). This thinking has prevailed. While a range of topics has since been ad-dressed within ESE research, the most substantial bodies of work in this field have proposed or evaluated models constructed primarily for effort/cost estimation or for defect prediction.
The use of metrics in ESE has been asserted as invaluable in facilitating rational decision mak-ing durmak-ing software development and maintenance (Mazinanian et al.2012; Schalken and van Vliet2008), with the expectation that this will in turn lead to positive outcomes such as increased development productivity, reduced deployment cycle time, and improved quality of the software product (Daskalantonakis1992). Although the in-principlebenefits of metrics to software engi-neering is not in doubt, thein-practicebenefits have been questioned increasingly in recent years due to growing concerns over the quality of the data being collected and used in the building of models to predict characteristics such as software size and development effort.
The challenges associated with the collection and use of empirical software engineering datasets have thus been documented in several recent publications (Gray et al.2012; He et al.2013; Liebchen and Shepperd2008). Problems such as noise, outliers, and missingness (or incompleteness) have been acknowledged and afforded particular attention by the ESE research community, in terms of both their detection and their resolution (Buglione and Gencel2008; Khoshgoftaar and Hulse 2005; Liebchen and Shepperd2008; Liebchen and Shepperd2005), while other problems, such as poor provenance, inconsistency, and commercial sensitivity, have been largely overlooked. Our previously published taxonomy (Bosu and MacDonell2013a) identified a number of distinct data quality challenges exhibited in respect to ESE datasets. In this study we apply the taxonomy to some “classic” ESE datasets, found primarily in the PROMISE1repository, that have been widely used in studies of software effort estimation.2These datasets were selected because they are easily
accessible and (so) are frequently used in ESE modeling. Our intent is to benchmark these datasets against the elements of the taxonomy with the goal of evaluating their quality. This will serve to highlight any areas of general concern regarding the collection of ESE data and will also indicate any specific shortcomings in each dataset. We will also gain some insight into the utility of the taxonomy as a benchmarking mechanism. In providing a benchmark of this nature, researchers and practitioners will be able to compare the quality of any new datasets with these classic alternatives. This should lead to more informed decisions as to whether to use a given dataset in ESE modeling. Although a range of techniques have been proposed to identify or assess the various quality characteristics of ESE datasets, there is no single “front-runner” technique for any of the data quality issues in the taxonomy. As a result, we employ what are considered to be among the best practice technique(s) (described in Section4) with a view to assessing the quality of these widely used datasets. It is hoped that researchers and practitioners would use appropriate techniques, such
1http://openscience.us/repo/.
2While “estimation” and “prediction” have slightly differing meanings, in that the latter explicitly refers to the forecasting
as these, in assessing the quality of their own datasets and to in fact develop or utilize new and better methods of data collection; in the meantime, however, the objective of this benchmarking exercise is to illustrate and so promote a holistic assessment of data quality prior to modeling. The contributions of this article are as follows:
• First, we deliver insights into the state of data quality of some of the most widely used datasets in software effort estimation.
• Second, we assess the previously proposed taxonomy in terms of its utility as a mechanism for benchmarking.
• Third, we propose a template that should provide a transparent means of data collection and submission and should support quality assessment of other datasets.
To the best of our knowledge, this is the first study in ESE that has sought to holistically assess the state of quality of a number of commonly used datasets; most prior studies have addressed a limited range of issues or quality concerns associated with one, or perhaps two, datasets. It is also the first study to explicitly advocate the use of a non-proprietary template to guide the collection and submission of datasets to ensure that their quality across multiple relevant dimensions is made clearly “visible.”
1.1 Motivation
This work is motivated by previous studies that have addressed the impact of data quality in ESE. In each of the case studies presented in this section, a single data quality issue was addressed. We are of the view that if data quality can be addressed holistically, then ESE practice stands to benefit greatly, given the improvements experienced through the addressing of single data quality issues. Khoshgoftaar and colleagues applied several noise detection and correction procedures to ESE datasets across a range of studies (Folleco et al.2008; Hulse et al.2006; Khoshgoftaar and Hulse 2005; Khoshgoftaar and Rebours 2004), with varying degrees of success. Noise detection tech-niques, including Bayesian multiple imputation, a clustering-based noise detection approach us-ing thek-means algorithm, an Ensemble-Partition filter, a technique to detect noise “relative to an attribute of interest (AOI),” rule-based noise detection, and Closest List Noise Identification, were applied to various ESE datasets. In all these studies, the authors show that addressing the noise issue in software effort estimation datasets has the potential to improve the performance of their prediction models, leading them to conclude that noise is detrimental to the performance of machine-learning algorithms used in ESE prediction.
Outliers have been a constant source of problems in the analysis of ESE data (Morasca2009). For instance, Lavazza and Morasca (2012) used a generalized robust regression method to not discard too many data points due to outliers, because as much as 57% of the data points in one of their datasets were determined to be outliers from a Least Squares perspective. The adoption of this approach ensured that they were able to build models that were statistically significant and had superior effort estimation accuracy.
models were built using the corrected data. The results indicated superior software prediction models based on the corrected data.
It should be evident from the above studies that robustly addressing any aspect of data quality in ESE can lead to improvements in the available dataset and/or the resultant models that are built. Different data quality issues might be associated with different problems. For instance, the presence of noise may mean that a dataset is not fit for purpose, existence of outliers could mean that the results of models might need to be adjusted for skewing, and missing data might lead to the building of models with smaller datasets, which could lessen the power of a model.
The remainder of this article is organized as follows. In Section2, we present related work, and in Section3we describe the datasets selected for assessment. In Section4, we present the best practice methods used in assessing dataset quality. A discussion of the results of this assessment is presented in Section5. In Section6, we propose a template that should aid in data quality as-sessment and in the collection and submission of datasets in the future. Finally, we present the conclusions of our study in Section7.
2 RELATED WORK
Data are at the core of the practice of ESE, and, as such, its importance to the discipline cannot be overstated. Most researchers use secondary data in ESE modeling (Mair et al.2005; Shepperd et al.2014); it is therefore critical that those responsible for collecting data are well trained and aware of the potential problems that could exist in datasets, so that suitable processes are employed to generate, and use, the most reliable data available. At a minimum, the processes used should be documented to inform secondary users of how the data were collected. The challenges faced by those collecting and utilizing empirical software engineering datasets have received increased recognition in recent times (Bosu and MacDonell2013a; Liebchen and Shepperd2008; Shepperd et al.2013), although as a whole the body of literature on ESE data quality remains quite limited (Bosu and MacDonell2013b). In this section, we review prior assessment studies and we briefly note some of the measures others have taken to improve the quality of ESE datasets and reposi-tories. We first present a representative set of studies that have assessed the state of ESE datasets from one viewpoint or data quality dimension, as this is the predominant approach taken by the ESE community in addressing issues that affect software engineering datasets. In this subsection, we also present example studies that have used metrics from open source projects in building ESE prediction models. This is followed by a review of the few studies that have assessed the state of ESE datasets from multiple viewpoints or considering multiple data quality dimensions.
2.1 Single Issue Studies
Noise—erroneous data—has been identified as a problem in several software measurement datasets (Johnson and Disney1999; Khoshgoftaar and Hulse2005; Hulse and Khoshgoftaar2011; Liebchen and Shepperd2005), and the ESE community has responded with a number of studies seeking to address the incidence and effects of noise. Liebchen et al. (2006) conducted classification experi-ments to assess the effect of noise on the accuracy of predictions and to evaluate the robustness of techniques for handling noise in ESE datasets. Three noise correction techniques were employed: robust algorithms, filtering, and polishing. Their results demonstrated that polishing is a more effective classification algorithm as compared to robust algorithms and filtering.
patterns that meet a certain minimum confidence threshold; and, third, software project data are mapped to the DAPs to identify any abnormal attributes. One of the objectives is to facilitate root cause analysis so as to prevent reoccurrences in the future. The Yoon and Bae (2010) study is significant in the sense that the abnormality of outliers is determined and acted upon relative to other data, in contrast to many studies that classify all outliers as noise and so simply (but perhaps inappropriately) remove them.
Two embedded strategies to addressmissing data(toleration and imputation) when using naïve Bayes and Expectation Maximization algorithms for software effort prediction were proposed by Zhang et al. (2011). The missing data toleration strategy simply ignores missing values and makes use of existing data values of software projects for prediction. Its strength lies in its low com-putational complexity requirements. The imputation strategy uses existing values of attributes to estimate missing values. Experimental results drawn from their analyses (of the ISBSG and CSBSG datasets) demonstrated that both strategies outperformed classic imputation techniques.
Inexperienced measurers were identified as contributors of poor data quality in the form of
inconsistencies(Cuadrado-Gallego et al.2010), especially during the data collection stage due to
their lack of understanding of software project metrics. It is important for software engineers to be trained in all aspects of data collection so that the quality of the data can be assured.
Redundant and duplicate datain ESE datasets (Bettenburg et al.2008) might lead to misleading
results and can also detrimentally affect the performance of classifiers. Prifti et al. (2011) found that, in their analysis of the Firefox bug repository, there were 748 bugs that had been assigned to multiple groups, after they applied a method that detected duplicates through local references. If effort modeling is based on such data, then clearly there is scope for over-estimation of the actual effort required. Moreover, the building of classification models using data-mining methods will be slowed by the additional processing needed to parse and consider the redundant entries/values.
Models generated fromheterogeneous multi-organization datasetshave been employed in esti-mating effort or predicting defects of software projects in a single company in a growing body of research (Bettenburg et al.2008; Kocaguneli and Menzies2011; Mendes et al.2007; Mendes and Lokan2008; Menzies et al.2011; Turhan et al.2009; Zhihao et al.2005). In spite of the extensive attention given to this issue, results to date have been inconclusive as to whether single organiza-tion datasets are superior to those collected from multiple organizaorganiza-tions. Kocaguneli et al. (2010) proposed the use of relevancy filtering so that organizations that lack historical data can supple-ment their software cost estimation with relevant data from other projects or organizations, as this approach was found to be effective as compared to using the data without any relevancy filtering.
Theamount of dataavailable for model building contributes to the likely statistical significance
of generated models. Small datasets are an acknowledged problem in ESE as they do not lend themselves to the generalization of results. The range of suitable analysis techniques is also con-strained (Bennett et al.1999; Hall2007), as some approaches assume the availability of a minimum volume of data. Naturally, this issue is particularly pertinent to organizations that are just begin-ning a measurement programme or that embark on projects that are substantially different to those undertaken in the past.
Commercial sensitivityis one of several constraints on provenance in ESE. Organizations that
proposed the CLIFF+MORPH algorithm that anonymized data without substantially degrading its use in software defect prediction. This algorithm was applied to good effect on 10 defect datasets from the PROMISE repository.
In the defect prediction study of Turhan et al. (2009), they found it difficult to access failure logs, because several large teams of contractors were working on projects for a single organization— NASA—and each viewed the failure logs as critical to their competitive advantage. The authors note that acquisition of even coarse-grained information was only attained after several years of negotiation. When finally provided, the data were highly sanitized by NASA to the extent that the research team was not able to have information concerning project or module names. Robles (2010) assessed the possibility of replicating experiments reported in papers published in the proceedings of the Mining Software Repositories Workshop/Conference between 2004 and 2009. It was determined that only 6 of 154 experimental papers were replicable, because the data and scripts used in the other 148 original studies were not accessible.
Catal and Diri (2009) performed several experiments to assess researchers’ claims that their fault prediction models provided the best performance. When the models were assessed using public datasets, the results were not as strong as had been claimed by their proponents. This may reflect problems with the models themselves (and possible researcher bias), or it may again signal the extent to which models are tied to the underlying data. Whatever the cause, conflicting reports such as this raises trust issues about software engineering experiments and the reliability of the datasets that are used in these experiments.
Empirical software engineering models for effort estimation and defect prediction have been built for open source projects such as the Linux kernel, Mozilla Firefox, Eclipse, and the like. Capiluppi and Izquierdo-Cortázar (2013), in their study of software effort estimation of FLOSS projects using the Linux kernel as a case study, extracted time-aware information from the repos-itory to enable them to identify the occurrence of major development activities. The metrics col-lected include commits (additions, deletions and modifications), committer, author, major release, timezones (office hours, after office and late night), and code complexity (McCabe’s cyclomatic index).
In addition to employing traditional metrics such as function points and Lines of Code, Qi et al. (2017) introduced another group of metrics they termed personal factors, which were determined objectively when they mined the GitHub repository to create effort estimation models for open source projects. The personal metrics are APEX, which refers to the project team experience in a specific kind of application, and LTEX, which is also associated with the programming language and tool experience of the project team. This project was undertaken to address the lack of ade-quate data for software effort estimation. It is worth noting that personal metrics are not a new idea in software effort estimation datasets, as they have been associated with datasets such as COCOMO, Desharnais, and others.
Metrics such as Commits, PullReqs, PullReqsHandled, ProjectsWatched, IssueComments, Issues-Reported, IssuesHandled, Followers, and Mentions have also been tracked in GitHub (Badashian Esteki Gholipour Hindle and Stroulia2014) to study developer activities. There are therefore di-verse metrics that can be tracked in the GitHub repository for which some can be employed to build effort estimation models, while others have different uses such as commit classifications and developer activity analyses.
maintainability index, Files and directories, and the rate of releasing new versions. Their study found support for Lehman’s law in relation to growth and stability of software systems.
Shin, Meneely, Williams, and Osborne (2011) investigated the use of three broad metrics of com-plexity, code churn, and developer activities as reliable indicators of identifying software system vulnerability. Using the aforementioned metrics, they were able to predict code vulnerabilities in the Mozilla Firefox browser and Red Hat Enterprise Linux.
2.2 Multiple Issue Studies
The above studies considered the state of ESE datasets in terms of just one quality dimension; we now consider studies that have assessed the state of ESE datasets from multiple viewpoints.
It has been generally established that the quality of ESE datasets cannot be taken for granted, as data collected even by highly mature organizations can have issues. This is evident in the discovery by Gray et al. (2012) of several data quality problems with the NASA Metrics Data Program (MDP) datasets that are used widely for defect prediction research. The issues evident in these datasets are several and include redundant data, inconsistencies, constant attribute values, missing values, and noise. Shepperd et al. (2013) proceeded further to compare two versions of a NASA dataset (one in the PROMISE repository and the other in the MDP repository) with respect to the data instances and their attributes and discovered that they differed in several respects. They proposed an algorithm that could be used to clean this data of multiple data quality issues.
Rodriguez et al. (2012) used a position paper to classify ESE repositories and the data quality problems that are faced by researchers when using these sources. The repositories were classified into five main groups based on the type of information stored, public or private availability of the dataset, existence of single project or multi-project data, type of content, and the format of data storage. In noting the challenges that these sources posed to (primarily machine learning) researchers the authors referred to difficulties in data extraction, the insufficient provision of in-formation to support replication, and a range of data quality problems, including outliers, missing values, redundant observations, overlapping classes, data shift over time, unbalanced distributions, measurement variability, and model accuracy variability (Rodriguez et al.2012). The classification of datasets by their distinct properties and the acknowledgement of data quality problems is a positive initiative. The research reported in this article is intended to further enhance data quality in ESE by providing a transparent and consistent means of collection and evaluation that could lead to the use of high(er)-quality data in software engineering experiments.
data quality assessment, whereas the data collection and submission template proposed in this article provides a comprehensive and transparent means of verifying any data collected and all assessments undertaken, with a view to facilitating replication. Such efforts should go some way to addressing quality problems at the data collection stage, which could also be beneficial in terms of early intervention. As noted above, however, empirical software engineering researchers often work with secondary data, and therefore it is similarly important to identify the quality challenges associated with secondary data, a second point of emphasis in this article.
A reasonably recent systematic mapping by Rosli et al. (2013) identified the data quality problem as an issue in ESE and discussed prior assessment techniques as applied to software engineering datasets. Although 10 different data quality problems were identified, nine of them fall into the Accuracy class of the data quality taxonomy (Bosu and MacDonell2013a). This again signals the sometimes narrow conceptualization of data quality in software engineering, as it is mostly seen from the (albeit important) perspective of accuracy. The present research intentionally adopts a broader conceptualization, and the proposed data collection and submission template should en-able users to capture other aspects of data quality in ESE that have to date been largely ignored.
Gencel et al. (2009) attributed the problem of inconsistent results when software effort estima-tion models are developed using benchmark repositories to two factors:
1. Thelack of common standards and vocabulary.
2. Thedifferences in definitions and categories of attributesof the different repositories. The authors went on to propose a mechanism for improving the classification of attributes by adapting the parametric estimation method that is used in civil engineering and two software engineering standards (ISO 12182 and ISO 14143-5). The parametric estimating method relies on the use of a classification database of past projects’ parameters to estimate new project parameters. The ISO 12182 standard consists of definitions of software application types and the ISO 14143-5 standard is the grouping of software applications into classes based on the functional properties of the software. The authors assert that (more) consistent use of terminology and definitions should lead to better quality ESE data. To date the proposal has been untested. However, in adherence to this suggestion by Gencel et al. (2009), the use of the data collection and submission template proposed in this article should offer a consistent and comprehensive approach for evaluating the quality of data for software engineering experiments.
Cheikhi and Abran (2013) surveyed the PROMISE and ISBSG repositories with the objective of making it easier for researchers to understand the data in them and thus more readily use the data in modeling. The datasets were classified according to the types of studies in which they could be used, such as effort estimation, defect prediction, and others. Properties of the datasets, including the name of the dataset; whether attributes have been described; the source/donor of the dataset; the year the dataset was made available in a repository; and the mode of accessibility of the dataset (such as public or private) were established for each of the data files in the repositories. These important factors form part of the provenance requirement of the proposed data collection and submission template (Section6).
Denoted “ISBSG” in the preceding text, the International Software Benchmarking Standards Group applies data quality ratings as a mechanism for indicating the quality of the data submitted for inclusion in its repositories:
“This field contains an ISBSG rating code of A, B, C or D applied to the project data by the ISBSG quality reviewers to denote the following:
B= The submission appears fundamentally sound but there are some factors that could affect the integrity of the submitted data.
C= Due to significant data not being provided, it was not possible to assess the integrity of the submitted data.
D= Due to one factor or a combination of factors, little credibility should be given to the sub-mitted data.”
How those heuristics are operationalized in practice, however, is not known. As such, the quality rating has been said to be a proxy for completeness of data (Liebchen and Shepperd2008), and researchers have tended to discard data with ratings lower than B in their analyses. Using a “blunt” approach such as this may not be optimal, however, in that, depending on the specifics of the research question being addressed, it may be too conservative or too optimistic. In related prior work, we have suggested a more nuanced way to maximize data use from the ISBSG repository (Deng and MacDonell2008).
The Experience database also uses data quality rating rules, in this case developed by the Finnish Software Measurement Association (FiSMA) to evaluate the data submitted to this particular repos-itory (Forselius2008). The FiSMA rules are publicly available (Forselius2008) and anyone inter-ested can apply them to evaluate the quality of data. The rules are designed to ensure that attributes of interest are explicitly described so that all three levels of stakeholders in the data collection pro-cess (customer company project management staff, project manager and repository manager) have the same understanding of the data requirements. The FiSMA rules categorize attributes into three classes for which metrics are recorded for each attribute (Forselius2008). The first class comprises the “basic” attributes of projects such as size, measured in function points, effort, measured in person-hours, and duration, computed from the start date and end date of a project. The second class comprises attributes that are used to determine the context for which projects were devel-oped, such as programming language, platform type, type of projects, and type of business of the customer organization. The third class of attributes are associated with productivity factors of software projects, such as the use of automated tools, customer participation, experience level of developers and project managers, and so on.
There are mandatory attributes (including size of software, effort, start date, end date, and oth-ers) for which if any attribute value is missing the data are rejected outright (Forselius2008). In determining the quality rating of a project, scores are assigned to each attribute, and the scores for all the attributes are aggregated to arrive at a final score for the project. The quality of the content of an attribute value impacts on the score assigned to that attribute. The maximum score possible for a project is 100. In all, seven quality levels are possible upon evaluation of the data. Six of the quality levels are acceptable and mean that records are stored in the Experience database, with the highest data quality level having a score of 90 or above indicated as “AAA” and “D” being the lowest-quality projects stored in the database with scores that lie between 40 and 49. Projects that evaluate to “X” are rejected and not stored in the database. Below are the quality ratings of projects that are assigned based on evaluation of the FiSMA rules by the repository manager:
AAA Highest quality 90+
AA Excellent 80–89
A Very good 70–79
B Good 60–69
C Satisfactory 50–59
D Acceptable 40–49
FiSMA provides documentation to aid in the determination of scores for the individual attributes— this is said to ensure that the process of evaluating the quality of projects is repeatable and can be carried out independently by all stakeholders. Application of this process of data evaluation is said to have contributed to the increased quality of this repository as compared to the ISBSG repository (Forselius2008). Project Managers responsible for data collection are also able to use it to self-evaluate the quality of their data prior to submitting it to the Experience database.
In spite of these provisions, some researchers have identified quality issues with this dataset. Outliers and missing and unexplained values have led to the removal of data from this dataset prior to analysis (Maxwell and Forselius2000; Premraj et al.2005). Though these problems are acknowledged by Forselius (2008), it is claimed that the Experience dataset is improving in quality upon every new release, due to ongoing enhancement of the rules applied in the collection of the data. Data that do not satisfy the minimum quality requirements are rejected, and so it has been asserted that the Experience database therefore contains high-quality data (Forselius2008). To indirectly illustrate this focus on quality, the FiSMA rules were applied to the ISBSG dataset in 2008, and it was found that more than 1,000 projects in the ISBSG repository would have been rejected from inclusion if assessed against the FiSMA criteria (Forselius2008).
The adoption of quality rules in the Experience database is to be commended in terms of con-tributing to improved data collection practices. There are, however, other datasets that have been used in many more ESE studies due to their public availability. While this open availability is pos-itive in terms of facilitating research, we have limited knowledge of how they were collected or of any quality checks that were applied to them—particularly when researchers do not return to the original source of the data. This has motivated us to provide a comprehensive set of data assess-ment procedures as described in Section4. Prior to that, we provide a brief overview of the ESE data quality taxonomy (Bosu and MacDonell2013a), which is the basis of the data benchmarking in this article.
2.3 The ESE Data Quality Taxonomy
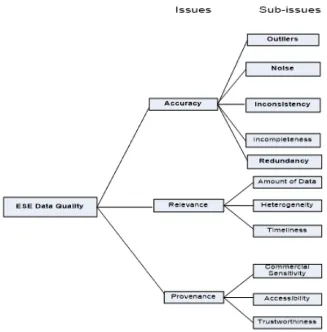
In this section, we present a brief overview of the ESE Data Quality Taxonomy based on our prior work (Bosu and MacDonell2013a). The ESE data quality taxonomy was created by surveying a decade of ESE literature on data quality. The study (Bosu and MacDonell2013a) identified 57 papers that had addressed one or more issues of data quality, and a total of 74 data quality issues were identified by these papers. These issues were grouped into three main classes: accuracy, relevance, and provenance. Sub-issues (or elements) were identified for each of the main classes. We provide a brief definition or explanation of the main issues and sub-issues of the taxonomy as shown in Figure1.
2.3.1 Accuracy. Accuracyrefers to the group of data characteristics that, if encountered, ren-ders observed data unfit for modeling. According to theOxford English Dictionary, accuracy is “the state of being accurate; precision or exactness resulting from care; hence precision . . . exactness, correctness.” The elements of accuracy are noise, outliers, inconsistency, incompleteness, and re-dundancy.
Noise.Noise is erroneous data or incorrect data—several empirical software engineering
stud-ies have identified noise in ESE datasets (Johnson & Disney1999; Liebchen et al.2006). Noise is deemed to reduce the accuracy of models; as such, software researchers have proposed noise de-tection techniques such as Bayesian multiple imputation, rule-based noise dede-tection, and Closest List Noise Identification to address the issue of noise in datasets prior to model development.
Outliers.Being data points that lie outside the overall pattern of a distribution (Yoon and Bae
Fig. 1. Taxonomy of Data Quality in ESE (Bosu and MacDonell2013a).
et al.2006; Yoon and Bae2010). The presence of outliers might be an indication of an error in the measurement of data or that the data are not fit to be used in the development of a model.
Incompleteness.Primarily found in the form of missing values, incompleteness affects several
ESE datasets (Liebchen et al.2006; Liebchen and Shepperd2005; Chen and Cheng2006). “Missing” is defined as “not able to be found, because a value is present but not in its expected place, or is not present when it is expected.” The definition of incompleteness is, however, broader, as it refers to not complete or finished or imperfect.
It also refers to a part that is not whole or requires some other parts to be complete. Due to the small size of many ESE datasets, the existence of incompleteness in data might render a model sta-tistically insignificant. The ESE research community has proposed several imputation techniques (e.g, Khoshgoftaar et al.2006; Hulse and Khoshgoftaar2008,2014) to deal with the phenomenon of incompleteness/missing data.
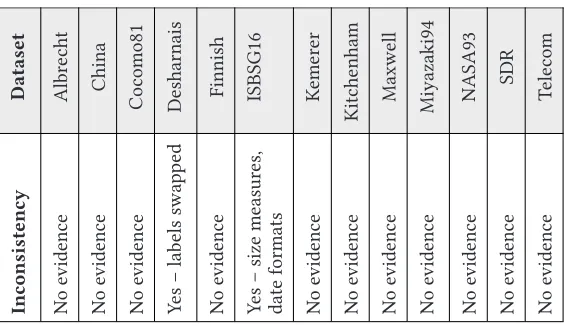
Inconsistency. Inconsistency, according to theOxford English Dictionary, is defined as “a lack of
Redundancy. In software effort estimation and defect prediction datasets, redundancy might exhibit in the form of duplicates or multicollinearity between variables. For example, Prifti et al. (2011) applied a technique that detects duplicates on the Firefox bug repository and discovered as many as 748 bugs that had been described in multiple groups. The use of such a dataset for effort estimation is likely to lead to an overestimation of the required effort—clearly an undesirable outcome.
2.3.2 Relevance.TheOxford English Dictionarydefines relevance as “the quality or fact of be-ing relevant—bearbe-ing upon, connected with, pertinent to, the matter in hand.” The use of appro-priate data in the development of models—usually classification or prediction is pertinent to the relevance element. Data collected from a different context or system such as real-time embedded system would be unsuitable to be used in estimating development effort for transaction-intensive retail systems. Relevance essentially captures the characteristics of data that are used in modeling. Several ESE studies have considered relevance from the perspective of either single organization datasets or multi-organization datasets. The elements considered under relevance in the taxonomy are heterogeneity, amount of data, and timeliness.
Heterogeneity. In ESE, software effort estimation research has considered heterogeneity partic-ularly in relation to whether the source of the data used in model development is from a sin-gle organization or multiple organizations. Researchers have employed heterogeneous datasets from multi-organizations in developing software effort and defects models for single organiza-tions (Mendes et al.2008; Turhan et al.2009; Zhihao et al.2005). Results have proven inconclusive so far as to the superiority of either single organization datasets or multi-organization datasets. The single-company/multi-organization dichotomy may have been oversimplified, as some single organizations are mostly engaged in many diverse projects.
Amount of Data. The statistical significance of models is hugely dependent on the amount of available data used in the development of the models, thus the amount of data available is an important factor of relevance. It is a widely held fact that small datasets is an issue in ESE model development, as they hinder the generalization of results. This also limits the selection of analysis techniques (Bennett et al.1999; Hall2007), as some techniques are suited to large amounts of data. Although a dataset might initially consist of large number of records, pre-processing such as the application of stratification and feature set selection approaches could result in data subsets that lack statistical significance power when used in model development. Researchers are therefore required to ensure that pre-processing does not create data subsets that raises questions about results generalizations due to the small nature of datasets and/or the application of inappropriate modeling techniques to the data.
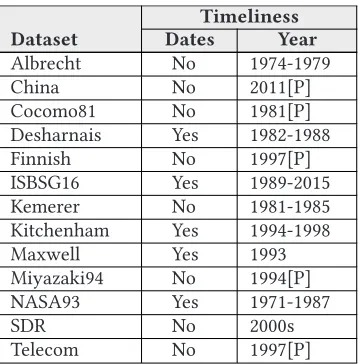
Timeliness. An element of relevance that has received little attention in the ESE research liter-ature is timeliness or currency of data. Mair et al. (2005) conducted a survey in 2005 and found that many ESE studies relied on data that are very old. The analysis of ESE conference and journal publications confirms that these old datasets are still being used in present-day research. To en-sure the timeliness of data, it is important for researchers and practitioners to regularly review the characteristics of datasets, taking into consideration the operational context so that the dataset is appropriate for contemporary use. Timeliness is more about the appropriateness of the data use in model development than anything to do with the datasets being inherently “wrong.” The question that still remains is “Why are ESE researchers still using old datasets in developing models to be used in effort estimation and defect prediction of contemporary projects?”
information has been used in the determination of the historical chain of ownership of important objects of value (mostly art work and literature) (Tan 2007). Guaranteeing provenance, while extremely significant for such valuable objects, is also important in relation to results generated by digital systems and other scientific applications. Information regarding provenance establishes something of an audit trail, providing the supporting evidence for scientific results, and, in turn, can directly influence the extent of trustworthiness associated with such results. Because of the reasons enumerated, the value placed on the provenance of digital systems and scientific applications is usually said to be the same as the results they generate (Tan2007).
Considered broadly, provenance is related to the issue of experimental replication. Replication is or at least should be important (Shull et al.2008) in empirical software engineering (as it is in other empirical fields) in that it enables the community to build cumulative knowledge concerning which results or observations can be relied upon under different conditions. Shull et al. (2008) advocated the production of good and consistent documentation for all ESE experiments to facilitate replica-tion. This is consistent with previous observation made by Wieczorek (2002), who indicated that a negligible number of empirical software engineering studies were replicated, and, surprisingly, that the use of even the same datasets across multiple studies continued to yield results that were not comparable in most cases, due to differences in the employed experimental designs. She con-tended that the diverse reporting formats of studies in the ESE domain meant that replication and results comparison was a challenge (Wieczorek2002). The challenge still persists as supported by the Lokan and Mendes (2006) study that replicated cross-company and single-company effort mod-els using the ISBSG database. They were unable to apply the same experimental procedure due to lack of consistent documentation. Replication can be more effective by the use of provenance sys-tems that will provide transparency between the results of an original study and a replicated study.
Commercial Sensitivity. Commercial sensitivity is one of the factors that restrains the use of provenance in ESE. This is due to the unwillingness of an organization to disclose and/or release data to researchers outside of their organization when it is believed that the data provide them competitive advantage or might be potentially harmful to the image of the organization. In the rare occasions where data have been released to researchers, they are made to commit to non-disclosure agreements (Liebchen and Shepperd2005; Mair et al.2005), which prevents studies based on such data from being replicable. Although non-disclosure agreements protect donor organizations, it limits what can be learned from such data analysis.
Accessibility. Researchers having access to data is another issue of provenance in ESE. Turhan et al. (2009) struggled to access the failure logs of NASA due to the fact that several contractors were working on projects for NASA. Each of these independent contractors considered the failure logs as an important element of their competitive advantage. It therefore took several years of negotiations for the researchers to be given access to the failure logs. The released data were highly sanitized to the extent the researchers could not even identify module and project names. Robles (2010) analyzed the experiments reported in published in the proceedings of the Mining Software Repositories Workshop/Conference between 2004 and 2009 with the objective of replicating the studies. To the surprise of the author, a mere 6 of 154 papers were replicable, because there was no access to the data and scripts used in the other 148 papers.
factor is that it could be difficult to map open source model of development to that of industrial software development. To increase the availability of data to researchers, it is essential that pub-lic repositories with provenance information such as the ISBSG (www.isbsg.org) and PROMISE (http://openscience.us) should be encouraged. Effective collaboration between academia and in-dustry is another means through which more data can be made accessible to researchers, which ultimately will improve the practice and reliability of ESE models.
Trustworthiness. There is a lot of innovation in the field of SE, leading to the creation of new tools, models, techniques, and other related artifacts; however, the field is constrained by lack of rigorous evaluation of these proposals. Glass et al. (2002) concluded that the research approach in SE is narrow and mostly dominated by the “Formulate” approach, with very few studies concentrating on evaluation as a major research activity when the authors analyzed software engineering studies prior to the year 2002. Similar outcomes have been found in other reviews (Clear & MacDonell 2011). It is therefore difficult to have confidence as to the extent to which results reported are applicable beyond the often-limited evaluations performed. This is applicable not only to tools, techniques, and methods; it also affects prediction and classification models as well. Catal and Diri (2009) conducted several experiments to verify researchers’ assertions that their fault prediction models provided the highest performance; however, when public datasets were used in assessing some of the models, the results were not as strong as had been claimed by their proponents. This may be due to problems inherent in the models, or it could be an indication as to the extent to which the efficiency of the models is heavily dependent on the underlying data.
Empirical software engineering researchers mostly have limited access to the source of original data, and the most reliable option is to work with secondary data. Researchers therefore have no option but to place their trust in people and systems used in collecting the data and hope that the data are fit for their purposes. Provenance systems is a means to overcome this challenge, as it will provide researchers and all other data users relevant information, including metadata and the origins of the data, that will increase the trust that is placed in the data. Changes in data, such as masking, anonymization or transformation, and other pre-processing, can subsequently be tracked and verified by both data users and data providers. This is essential in building models with high integrity.
3 DATASET DESCRIPTIONS
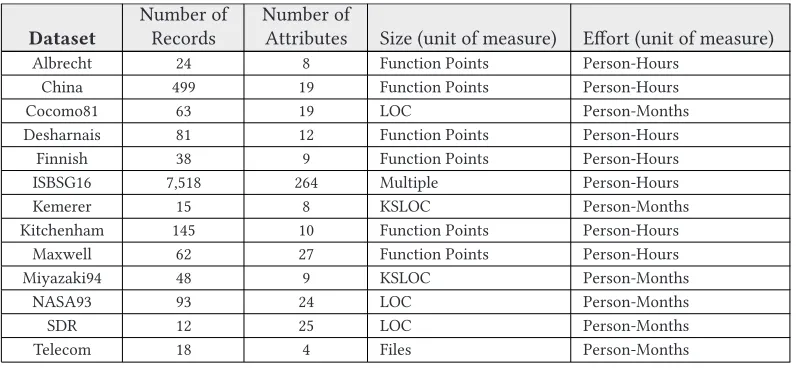
The 13 datasets used in our quality benchmarking exercise and listed in Table 1have all been used previously in ESE research (Amasaki2012; Miyazaki et al.1994; Prabhakar and Dutta2013; Shepperd and Schofield1997). The choice of datasets was informed by a prior study reported in 2005 (Mair et al.2005) that identified 9 of the datasets as being among those most widely used in software effort estimation, noting that the COCOMO81, Desharnais, Kemerer, and Albrecht datasets were the most widely used of all. The China dataset, although comparatively new (being made available in the PROMISE repository in 2010), has also been included in this assessment, because it consists of 499 records—a large number relative to most other publicly available software engineering datasets. All of the datasets have recently been used together in a number of individual studies by Kocaguneli and colleagues (Kocaguneli et al.2012; Kocaguneli et al.2013; Kocaguneli et al. 2015), thus emphasizing their ongoing perceived utility in effort estimation research. An introduction to each of the datasets is provided in this section (in alphabetical order of the commonly used dataset name). Twelve of the datasets have been drawn from the PROMISE repository. (Note that 2 datasets, the Desharnais3 and Finnish datasets, were available at a
Table 1. Dataset Description
Dataset
Number of Records
Number of
Attributes Size (unit of measure) Effort (unit of measure)
Albrecht 24 8 Function Points Person-Hours
China 499 19 Function Points Person-Hours
Cocomo81 63 19 LOC Person-Months
Desharnais 81 12 Function Points Person-Hours
Finnish 38 9 Function Points Person-Hours
ISBSG16 7,518 264 Multiple Person-Hours
Kemerer 15 8 KSLOC Person-Months
Kitchenham 145 10 Function Points Person-Hours
Maxwell 62 27 Function Points Person-Hours
Miyazaki94 48 9 KSLOC Person-Months
NASA93 93 24 LOC Person-Months
SDR 12 25 LOC Person-Months
Telecom 18 4 Files Person-Months
previous instance of the PROMISE repository but are no longer accessible.) This study also uses the International Software Benchmarking Standards Group (www.isbsg.org) Release 2016 R1, herein referred to as ISBSG16. All of the datasets contain information reflecting some measure(s) of system size/scope and of development effort, and, as such, these attributes are not emphasized in the description of the datasets. Information concerning the period in which projects were undertaken are stated in the description of datasets where it is known. The number of attributes varies greatly for the datasets—the Telecom dataset consists of only four attributes whilst the IS-BSG16 dataset is composed of 264 attributes. This is noteworthy, as it demonstrates the diversity of datasets and the non-uniformity in the properties collected by different software organizations. In counting the number of attributes, project or record identifiers are also included. While the num-ber of attributes in each dataset varies from just a few variables up to 27 attributes (for Maxwell) and 264 attributes (for ISBSG16), typically only a small number are used in effort modeling.
TheAlbrechtdataset (Albrecht and Gaffney1983) comprises 24 records collected from projects undertaken in the 1970s at IBM Data Processing Services. The systems themselves were devel-oped using the COBOL, PL/I, and DMS programming languages. System size and complexity were measured using the function point approach proposed by Albrecht (1979).
The Chinadataset comprises 499 projects characterized by 19 attributes. Among these, the function point measures proposed by Albrecht (1979) are again used to quantify system size. It is difficult to provide any further information concerning this dataset—papers that have used this data have provided no background information (Kocaguneli et al.2013; Prabhakar and Dutta2013). (An email was also sent to Professor Tim Menzies, who has oversight of the PROMISE repository, and he confirmed that he had no background information on the China dataset and that he received the data in April 2010 without any further details.)
The Desharnais dataset was collected by Jean-Marc Desharnais from 10 organizations in Canada. The projects in this dataset were undertaken between 1983 and 1988. The dataset con-sists of 81 records and 12 attributes, with size measured in function points. In most studies that employ this dataset, 77 of the 81 records are used because of missing data in 4 records (Shepperd and Schofield1997). In this study, the version that is used in any particular analysis is described as part of the analysis.
TheFinnishdataset was collected from nine firms in Finland by the TIEKE organization. Ini-tially, 40 records were collected, but missing values in some of the attributes of two projects (Kitchenham and Kansala1993) meant that their data were removed, leaving 38 records for anal-ysis. This dataset consists of nine attributes, with size measured in function points.
The International Software Benchmarking Standards Group dataset(ISBSG16)consists of soft-ware development and enhancement project data collected over several years. This study used Release 2016 R1, which was released in March 2016. The data include project records collected from 32 countries and across more than 12 different industry types (www.isbsg.org). The stated purpose of the ISBSG in compiling the dataset is to aid the software industry in estimating aspects of their projects such as their size, effort, duration, and speed of delivery. The dataset is also said to be useful for benchmarking of projects—so that an organization might compare itself to ‘best practice’ as represented in the dataset—as well as in the effective planning and management of software projects via software productivity improvements, team size planning, and project risk management. The dataset is available for a fee for commercial organizations. The March 2016 re-lease of the dataset is composed of 7,518 projects with 264 attributes. The size measures used for most of the projects are based on IFPUG function points, but other size measures include NESMA FPs, COSMIC-FP, Mark II FPs, LOC, Dreger, and “Backfired.” That said, for reasons discussed later in the paper, researchers often use a subset of the data for modeling, after applying several filters to arrive at the data of interest.
TheKemererdataset (Kemerer1987) was collected from an American Computer and Consult-ing firm that developed data-processConsult-ing software. The data were collected in 1985, and the oldest project at that time was started in 1981, with most of the projects starting in 1983. The projects were said to be medium to large in size based on thousands of source lines of code (measured in KSLOC). The dataset is composed of 15 projects with eight attributes.
TheKitchenhamdataset (Kitchenham et al.2002) was collected from American-based multi-national Computer Sciences Corporation (CSC). This dataset contains information related to 145 software development and maintenance projects that CSC undertook for several clients. There are 10 attributes considered, and the size attribute was measured in function points. The attributes also include start date and estimated completion dates, and the projects were undertaken between 1994 and 1999.
The Maxwelldataset was collected from a Finnish commercial bank. It is composed of 62 projects represented by 27 attributes (Maxwell2002). There are 22 categorical attributes that were asserted to have an influence on software productivity. The size attribute was again measured in function points. The start years of projects were between 1985 and 1993.
TheMiyazaki94dataset was collected by Fujitsu’s Large Systems Users Group (Miyazaki et al. 1994). The data were obtained from 48 COBOL systems developed in 20 different organizations and across multiple departments within those organizations. There are nine attributes for each project/system; the size attribute was measured in the number of COBOL source lines of code (in thousands).
dataset consists of 24 attributes of which 15 are cost drivers, as the approach is based on that used in COCOMO81. The size attribute was measured in (estimated) lines of code.
TheSDRdataset was collected from five software organizations in Turkey and is based on the COCOMO II format, having 22 of its 25 attributes as cost drivers (Kocaguneli et al.2012; Minku and Yao2013). There are 12 projects in this dataset, and the size attribute was measured in (estimated) lines of code.
TheTelecomdataset (Shepperd and Schofield1997) consists of data on 18 software enhance-ment projects that were undertaken on a U.K. telecommunications product. The version of the dataset used in this study comprises four attributes. Having said that, only the number of files attribute is used in effort estimation, since the other three attributes are not available at the time that estimation would occur.
4 DATA QUALITY ASSESSMENT APPROACH
In this section, we provide a description of the methods that we applied to the selected datasets to evaluate them against the taxonomy (Bosu and MacDonell2013a), which has been briefly described in Section2.3. The intention is not to develop or promote any particular data quality assessment techniques; rather, the objective is to use known methods to establish the extent to which the data quality challenges identified in the taxonomy may be found in real, widely used ESE datasets. This is important, as we found previously (Bosu and MacDonell2013b) that data quality assessment is generally not reported in ESE publications. Thus, there is a tendency to simply adopt datasets for analysis without consideration—or perhaps even awareness—of their quality.
Perhaps because of data scarcity, ESE does not use a Kaggle-like approach, wherein datasets are ranked by their users while being made freely available. Much ESE data are proprietary or are closely curated (e.g., by the ISBSG), the Promise repository being the main exception. Under such an approach, the higher-quality datasets would be ranked more highly and so would gain greater prominence, while those with quality problems might lose visibility—and therefore see limited use. While this idea seems appealing in terms of promoting high-quality modelling, it is really moot at present given the limited public access to such datasets.
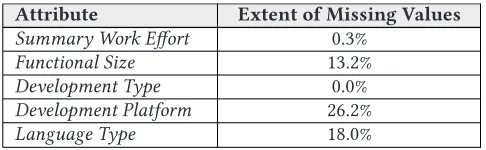
In the analysis that follows, as many as possible of the available variables and records in each dataset were considered, with the exception of the ISBSG16 dataset, where subsets of attributes and records were used. While the ISBSG16 dataset includes 264 attributes, many records have missing values for a number of these characteristics (due to their not being applicable to a given project, or not being mandatory so not provided by the submitting organization). Therefore, a partial set of the attributes (comprising Functional Size, Summary Work Effort, Development Type, Development Platform, and Language Type) was used in the determination of noise, whilst the (continuous) Functional Size and Summary Work Effort variables were considered in determining outliers. The independent variables selected are known from previous studies to have some degree of influence on effort (Letchmunan et al.2010; Lokan and Mendes2009; Seo et al.2008). Deng and MacDonell (2008) highlighted seven reasons why it might not be possible to use the entire ISBSG dataset for effort estimation, as follows:
• Some variables are not normalized into atomic values.
• Inconsistent recording of variable values.
• There are too many distinct levels for some variables.
• The contexts for some variable values are not discrete.
• Some variables are derived from other variables.
• Some variables are not relevant for effort estimation.
The formalization of the ISBSG release 9 dataset by Deng and MacDonell (2008), with the objective of retaining as many data points and attributes as possible for software project effort prediction, resulted in the identification of 12 usable predictor variables. All of the attributes used here in the assessment of noise and in outlier identification were among those 12 variables. The total number of records retained by the same formalization was 2,862 of the 3,024 records in the ISBSG database. This number in fact represents a substantial proportion of those available, as most studies use fewer than 800 records for modeling. The quality assessment under the three classes of the taxonomy is now presented.
Accuracy. This taxonomy class considers noise, outliers, inconsistency, incompleteness, and re-dundancy, each of which is now addressed in turn.
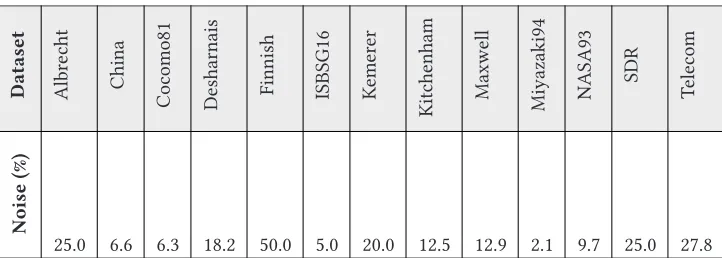
Noise has been acknowledged as being difficult to determine in respect of ESE datasets (Liebchen et al. 2007), especially when those datasets are secondary sources, meaning the re-searchers may be far removed from their origin. Since it is difficult to be certain about noise in a dataset, and given that researchers may be willing/able to tolerate a certain degree of noise, the assessments undertaken in this study should be interpreted as a guide to the potential state of the datasets rather than definitive statements that a dataset is noisy or otherwise. Even indicative noise assessments such as these are necessary, however, so that researchers and estimators are at least aware of the nature of the datasets they are using and can consider whether preprocessing might be beneficial in improving the quality of the data (and hence any models developed using that data). Following prior research, we employed two different approaches in determining noise for the 13 datasets selected here. The first approach was to examine whether any formulas used in deriving data were incorrect or violated relational integrity constraints (Shepperd et al.2013), which are the stated rules/formulas or the expected outcome of a computation. The second technique utilized data classification, where incorrect classification represents a proxy for noisy instances in the data, as implemented by Liebchen et al. (2007). Classification algorithms are able to segment data into the required categories—in this study it is expected that data will be classified as “noisy” or “not noisy.” Specifically, for software effort estimation, the classification algorithm identifies a record as noisy where the predicted dependent value of the classifier is different from the actual value. We used a decision tree algorithm (specifically the C4.5 algorithm available as part of the Weka data-mining toolbox) first because it is able to build relationships between data as well as to build models independent of the underlying assumptions of the relationships between the attributes under consideration. Second, decision trees are robust in the presence of missing data, an important consideration given the fact that missingness is a predominant problem in ESE datasets. Third, decision trees are accessible and simple to explain. As such, they have been widely used in general machine learning (González et al.2008; Moser et al.2008; Teng2000) and also in software defect prediction (Folleco et al.2008; Tang & Khoshgoftaar2004). Last, to the best of our knowledge, the only two prior studies that attempted to identify or address noisy data in effort estimation datasets (Liebchen et al.2006;2007) used the decision tree algorithm. In this article, the effort attribute was discretized, because it was a continuous variable, forming the target class for all of the datasets. Preliminary analyses indicated that most of the datasets could be split into up to four classes; therefore, the discretized effort attribute values were divided into four classes for all 13 datasets. The classifier was then applied to the datasets using fivefold cross-validation. The percentages of the effort class that were incorrectly classified were deemed to be noisy.
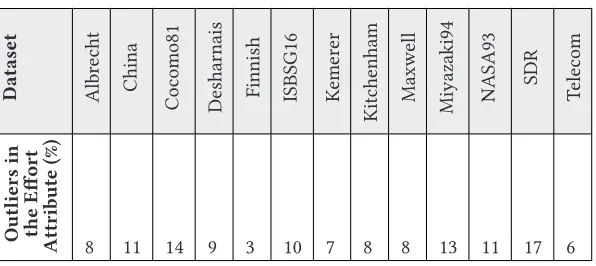
Boxplots were generated using the R statistical tool to determine outliers in the datasets under consideration. The plots include the Effort attribute for all 13 datasets as the target outcome vari-able of interest in software project effort estimation. In general, categorical varivari-ables and other attributes that have limited ranges of values were omitted from the plots as follows:
• TheFPAdjandAdjFPof the Albrecht dataset were not included in the boxplot, because there
is a transformation relation between them andthe RawFPcounts.
• In the China dataset,the Resourceand Dev_Typeattributes were excluded, because they are categorical variables.N_effortwas also excluded as it is a transformation of theEffort attribute.
• TheLOCandEffortattributes were those plotted for the COCOMO81 dataset, because the
other attributes were the cost drivers that are assigned according to a fixed range of values in relation to the application’s characteristics.
• For the Desharnais dataset,TeamExpandManagerExpwere not plotted, because they con-tain discrete values that range from 1 to 4 and 1 to 7, respectively.YearEndwas removed, be-cause it represents project completion date (and so is not known in advance). TheEnvergure
andPointsAjustattributes have a relation with thePointsNonAjustand as such
PointsNonA-justwas plotted, as it has not been subjected to any transformation.
• Thehw (hardware type),at (application type), andco (function point contribution of each
type) attributes in the Finnish dataset were not plotted, because they are limited-range cat-egorical variables. Thelnsizeandlneff are the log transformations of size and effort, re-spectively, and as such they are not also plotted, since our primary interest lies with orig-inal values or attributes (although it is worth noting that the log transformation is a valid preprocessing technique that is often a sensible choice in the case of highly skewed data distributions). The product delivery rate,prod, was also not plotted, because it is a derived attribute based on theeffortandsizeattributes.
• SizeandEffortare the only attributes plotted for the ISBSG16 dataset due to the categorical
nature and/or high proportion of missing values for many of the other characteristics. Note that theSizeandEffortrecords themselves contained several 0s and blanks, and these were removed (leaving a total of 4,805 records) before the boxplots were generated. It is worth noting that the number of records used in the boxplots is higher than that used in the determination of noisy records, because five attributes were considered in finding the noisy instances whilst only two attributes were considered in the generation of the boxplots.
• In the Kemerer dataset,LanguageandHardwareare categorical values and as such were not plotted.AdjFP, which is a transformation of theRAWFP, was also not included on the boxplot.
• In the Kitchenham dataset, theStart_DateandEstimate_CDateattributes were not plotted, because they represent dates rather than numeric values. TheClient, Type, andMethod at-tributes are categorical, and so they were also not plotted.
• In the Maxwell dataset, theDuration, Size, andEffortwere the only attributes plotted, be-causeSyearrepresents the start year of projects and the other attributes were categorical variables.
• All the attributes of the Miyazaki94 and Telecom datasets were plotted.
• Only theLOCandEffortattributes were plotted for the NASA93 and SDR datasets, because the other attributes were categorical and/or had limited ranges of values.
researchers work with secondary data, and as such we need to be sure we have datasets that are as close to “ground truth” as possible. More than that, if summary statistics were routinely provided with datasets, then this would enable users to check whether the data are likely to be true to the original, as these computations can be quickly performed on other versions of the data (similar to calculating a checksum). More generally, information that accompanies the data in the form of metadata, which explains the relevant details of the attributes and values of a dataset, would seem to be increasingly necessary as it further supports verification of the dataset. Our proposed template is one attempt at promoting the inclusion of such metadata.
Incompletenesswas relatively easy to determine, as some of the datasets actually state the number of records with missing values. In addition, missing values were represented uniformly as “?” or null values in some of the fields (and such indicators are evident in most ESE datasets). However, when missing values are represented—inappropriately—with zeros (0s), then domain knowledge or metadata are required to interpret such instances correctly.
While the taxonomy considers duplicates and multicollinearity in datasets under the subject of
redundancy, in this benchmarking exercise only duplicates are sought, because there is no inten-tion at this point to build estimainten-tion models with the datasets. We used the advanced filter feature in Microsoft Excel to identify duplicate records. In any case, multicollinearity would be an issue only if certain, related variables were included in a given model. Though multicollinearity is not being given specific attention in this study, we suggest that ESE researchers should routinely ex-amine the correlations among independent variables once they have decided to develop prediction models. This should enable them to avoid introducing the destabilizing effects of multicollinearity in their models.
Relevance. The second of the three classes in the taxonomy considers the amount of data, their heterogeneity, and their timeliness.
A straightforward indication of the amount of data in each dataset was determined by simply counting the number of records; in some cases this information is helpfully stated in the metadata that accompanies datasets. Dataset size is an important consideration in terms of having a sufficient number of records to satisfy the assumptions of the various modeling and analysis methods that are used in effort prediction. In assessing heterogeneity, information on whether the data had been collected from multiple organizations or from a single organization was also sought from dataset metadata. Heterogeneity also relates to other factors, however, such as the different types of application that constitute the projects—data subsets might have distributional characteristics that are distinct from others. It is also worth noting that feature subset selection practices can indicate another form of heterogeneity or the broader aspects of relevance for datasets used in modeling as it selects the variables or features that have the most predictive power instead of using all features for model building. In this article, information on the heterogeneity of datasets was extracted from prior publications that had used these datasets. If a new dataset is donated to a repository and has yet to be reported in a publication, however, then current submission practice and the limited prior reporting of data quality characteristics means that it might be difficult for a researcher or practitioner to know the state of the data with respect to heterogeneity based on its origin. In considering heterogeneity alongside the amount of data, while a single dataset may seem sufficiently large in absolute terms, if it is heterogeneous, then the size of the data subsets becomes another important consideration in terms of their adequacy for analysis.
Table 2. Results of Noise Classification Assessment
Dataset Albr
echt
China
Co
como81
Desharnais Finnish ISBSG16 Ke
m
er
er
Kitchenham Maxw
ell
Miyazaki94 NASA93
SDR
Te
le
co
m
Noise
(%)
25.0 6.6 6.3 18.2 50.0 5.0 20.0 12.5 12.9 2.1 9.7 25.0 27.8
1. Where start and/or completion dates have been recorded in a dataset the date (year) of the dataset was listed as the range of the earliest project and the latest project recorded. For instance, if the projects in a dataset were noted to have been undertaken between 1998 and 2006, then “1998-2006” was recorded as the year for the dataset.
2. Where start and/or completion dates are not recorded in a dataset, but where there are publications that stated the period in which projects were conducted, the range of the years as indicated in 1 was used to represent the year of the dataset.
3. Where start and/or completion dates are not recorded in a dataset nor stated in a publica-tion, the year of the first publication that referred to the dataset was used as the year of the dataset.
Provenance.This third class in the taxonomy considers issues of commercial sensitivity, ac-cessibility, and trustworthiness.
To assess whether datasets faced commercial sensitivity issues, we sought information that might indicate dataset, variable, record, or data item anonymization or transformation. Commer-cial sensitivity information could also be indicated as part of the metadata embedded in a dataset or provided in a separate document. Since all of the datasets studied here are in public repositories, we deemed all of them to be accessible. In regard to trustworthiness, we sought any documentation that would provide us with detailed information about how and when the datasets were collected, with the intention that the data generation procedure could be checked and/or replicated. Though this detailed information was generally not available, for some of the datasets there was contact information about the donors of the datasets.
The results of our evaluation of the 13 datasets against the quality criteria in the taxonomy are presented next.
5 DATA QUALITY ASSESSMENT RESULTS