Comparing the Effect of Task-Oriented Intervention Program vs.
Strength Training Program in Improving Motor Proficiency in
Children Aged 8-12 Years with Developmental Coordination
Disorder (DCD):
A Randomized Controlled Pilot Study
Alena Adaikina
Submitted in part-fulfilment of the requirements for the degree of
Master of Sport and Exercise Science
Centre for Sport Science and Human Performance
Waikato Institute of Technology
i
Keywords
Developmental Coordination Disorder (DCD) Enjoyment level
Movement Assessment Battery for Children (MABC-2) Motor Proficiency
Motor Skills
ii
Abstract
Background: Despite the fairly high prevalence of developmental coordination disorder (DCD) among children (5-6% of school population), existing research and therapeutic practice lack rigorously conducted, randomised controlled studies that could be instrumental in finding the most effective intervention programs as judged by improvements of various facets of patients’ motor proficiency, their physiological status, and adherence rates.
Purpose: This study sought to compare the outcomes of task-oriented and strength training exercise intervention programs in terms of improving motor proficiency as well as the levels of enjoyment and compliancy to treatment among children with DCD.
Design: Randomized controlled pilot trial.
Methods: Eighteen children aged 8-12 years diagnosed with DCD were randomly assigned to the task-oriented exercise program (n=9) or strength training program (n=9). Children were assessed using the Developmental Coordination Questionnaire and the Movement
Assessment Battery for Children, as well as a battery of self-reported measures of enjoyment and the level of parental encouragement needed. Intervention consisted of 8-week exercise physiologist-led individual or group exercise sessions held once a week plus a series of home exercise program.
Analysis: A series of one-way ANOVAs and paired t-tests were used to investigate the within-group and between-group effects of the two programs. Multiple linear regressions were run to test whether and which contextual and child-related characteristics affected the treatment success.
Results: Both programs have led to statistically significant improvements in terms of children’s motor proficiency as measured by total score (p<.001 for both groups), manual
iv
Table of Contents
Keywords ... i
Abstract ... ii
Table of Contents ... iv
List of Figure... vi
List of Tables ... vii
Statement of Original Authorship ... ix
Acknowledgements ... x
Chapter 1: Introduction ... 1
1.1. Background ... 1
1.2. Statement of the problem ………...1
1.3. Research questions ... 2
Chapter 2: LiteratureReview ... 3
2.1. Definition ... 3
2.2. Epidemiology ... 3
2.3. Aetiology and pathogenesis ... 4
2.4. Signs and symptoms ... 4
2.5. Assessment ... 7
2.6. Intervention approaches ... 11
2.7. Conclusion ... 16
Chapter 3: Research Design ... 17
3.1 Methodology and Research Design ... 17
3.2. Assessment ... 22
3.3. Order of testing ... 25
3.4. Intervention ... 25
Chapter 4: Results ... 29
4.1. Recruitment ... 29
4.2. Randomisation ... 29
4.3. Pre-screening: Developmental coordination disorder questionnarie -2007 (DCDQ-07) ... 31
4.4. Baseline characteristics (controls) ... 31
4.5. Primary outcome measure: Movement assessment battery for children (MABC-2) .... 32
4.6. Statistical analysis of the baseline variables ... 33
v
4.8. Home exercises and loogbooks ... 37
4.9. Statistical analysis of the primary outcome measure (MABC-2) ... 39
4.10. Exercise enjoyment scale ... 47
4.11. Post-intervention interviews with parents ... 48
4.12. Statistical analysis of the compliance to treatment ... 50
Chapter 5: Discussion ... 53
5.1. Introduction ... 53
5.2. Baseline variables of the study population ... 53
5.3. Changes in Movement assessment battery of children (MABC-2) score in each intervention group ... 54
5.4. Between-group analysis of the effectiveness of the programs in terms of primary outcomes (MABC-2) ... 55
5.5. Exercise enjoyment and compliance to treatment ... 56
5.6. Study strengths ... 57
5.7. Study limitations ... 57
5.8. Recommendations ... 58
References ... 60
vi
List of Figures
1. Figure 3.1. Stages of the recruitment process………20
2. Figure 4.1. Recruitment: number of participants at each point of the process……….30
3. Figure 4.2. Comparison of the baseline average raw total test score, manual dexterity, ball skills, and balance………32
4. Figure 4.3.: Exercise compliance in percentages from week 1 to 8 in the task-oriented group………38
5. Figure 4.4.: Exercise compliance in percentages from week 1 to 8 in the strength training group………38
6. Figure 4.5. Weekly levels of home exercise enjoyment of the task-oriented group……..47 7. Figure 4.6. Weekly percentage of the home exercise enjoyment of the strength training
vii
List of Tables
1. Table 2.1. Developmental Coordination Disorder screening protocols………...8 2. Table 2.2. Reliability and validity of some assessment tools for children with DCD…..10 3. Table 2.3. Studies examining the effectiveness of strength training intervention
programs………14 4. Table 2.4. Studies comparing different approaches to DCD treatment……….…….15 5. Table 4.1. Baseline characteristics of study participants………...31 6. Table 4.2. Mean and SD volumes of the score bands for task-oriented and strength training
group………..33
7. Table 4.3. Between-group analysis of the baseline data………..…34
8. Table 4.4. Attendance of the exercise sessions……….36
9. Table 4.5. Intervention groups by the mode of delivery of supervised sessions…………37 10. Table 4.6. Within-Group Analysis of the MABC total score, manual dexterity, ball skills, and balance for the task-oriented group……….40 11. Table 4.7. Within-Group Analysis of the MABC total score, manual dexterity, ball skills,
and balance for the strength-training group……….…..41 12. Table 4.8. Between-Group Analysis of MABC total score, manual dexterity, ball skills,
and balance………42
13. Table 4.9. Linear regression model predicting the level of post-intervention total score (Total2)……….……….44
14. Table 4.10. Linear regression model predicting the level of post-intervention manual dexterity score (MD2)………...………45
15. Table 4.11. Linear regression model predicting the level of post-intervention aiming and catching skills (Ball2)………46
16. Table 4.12. Linear regression model predicting the level of post-intervention balance (Balance2)……….………46
17. Table 4.13. Responses to the parent post-intervention interview questions……….49 18. Table 4.14. Between-group analysis of the research-led exercise sessions
attendance………..50
viii 20.Table 4.16. The between-group analysis of enjoyment and level of encouragement
ix
Statement of Original Authorship
The work contained in this thesis has not been previously submitted to meet requirements for an award at this or any other higher education institution. To the best of my knowledge and belief, the thesis contains no material previously published or written by another person except where due reference is made.
Signature: Alena Adaikina____________
x
Acknowledgements
I would like to express my sincerest gratitude and appreciation to the people who have assisted me and contributed to the accomplishment of this degree.
I am particularly grateful to my supervisor Dr. Glynis Longhurst for her guidance and continuous support through my two years at Wintec, for her advice and sharing her expertise in this particular field, her valuable and constructive suggestions during the planning and implementation of this work.
My special thanks are extended to the staff of the School of Sport and Exercise Science of Wintec led by Greg Smith for their continued support and encouragement.
Thanks to Craig Harington and Mary Silcock for the interest in this research, their help in providing invaluable resources in running this project.
My special words of gratitude go to the 20 children and their families who participated in this study on top of all of their other activities. The time dedication of these families to this research was incredible. Without you, this study would not have been possible. I would also like to thank the teachers of schools for their help in the recruitment process and for
providing the school facilities to run exercise sessions.
I also want to acknowledge the help provided by Sagun Mahajan.
1
Chapter 1:
Introduction
1.1. BACKGROUND
Developmental Coordination Disorder (DCD) has been recognized as one of the most common developmental dysfunction during childhood (Blank, Ouwien Smits-Engelman, Polatajko, & Wilson, 2012) with worldwide distribution from 5-6% (American Psychiatric Association, 2013; Gaines, Missiuna, Egan, and McLean, 2008) to 5-10% (Wilmut, Brown, & Wann, 2007).
DCD is characterized by difficulties in performing everyday motor skills that are not attributed to another physical, sensory or intellectual impairment (Wilson & Crawford, 2007).
Compared with the typical development children, children with DCD are reported to demonstrate poorer performance of ADL, delays in learning ADL and less frequent participation in physical activities (Missiuna, Moll, King, & Law, 2007; Summers, Larkin, Dewey, 2008; Van der Linde, Van Netten, Otten, Postema, Geuze, and Schoemaker, 2015; Zwicker, Harris, & Klassen, 2012), the symptoms treated as diagnostic criteria for DCD (American Psychiatric Association, 2013).
1.2. STATEMENT OF THE PROBLEM
The review of the existing research has revealed two main points. First of all, developmental coordination disorder is a broadly defined problem that affects a lot of children and has negative impact not only on their motor skills, balance, strength, but also daily activity, social life, psychological health and learning process as well (Fong, Velma, Lee, Chan, Chak, and Pang, 2011; Jarus, Lourie-Gelberg, Engel-Yeger, & Bart, 2001; Poulson, Ziviani, Cuskelly, & Smith, 2007; Poulson, Ziviani, Johnson, Cuskelly, 2008; Van der Linde et al., 2015).
Second, existing research and therapeutic practice suffer from a lack of rigorously conducted, randomised controlled studies that could be instrumental in finding the best intervention program as judged by not only improvements of patients’ motor proficiency, but
2 Moreover, there is a clear need in finding an optimal program for children in different age groups as well as exploring ways to adjust each program to specific patients’ needs, which
is particularly important given that children with DCD have a widely ranging set and severity of symptoms (Blank et al., 2012).
The proposed research seeks to contribute to filling some of these gaps, by comparing the effect of task-oriented intervention program versus strength training in terms of improving motor proficiency in children aged 8-12 years with developmental coordination disorder in a randomized controlled pilot study.
1.3. RESEARCH QUESTIONS
The research study addressed the following research questions:
RQ1: Does the strength training intervention program has similar results in improving motor proficiency as the task-oriented program?
RQ2: Which type of the intervention program has better outcomes in terms of manual dexterity, balance, and ball skills?
3
Chapter 2:
Literature Review
2.1. DEFINITION
Developmental Coordination Disorder (DCD) is a chronic neuro-developmental condition that significantly affects the development of motor coordination and is not explicable in terms of general intellectual retardation or any specific congenital or acquired neurological disorder. Being diagnosed with DCD has been found to be associated with problems in language, writing skills, perception, learning and attention, daily activity and social life, personality and behaviour (Blank et al., 2012).
In 1987 the term “developmental coordination disorder” and the diagnostic criteria for DCD were added to the third edition of the Diagnostic and Statistical Manual of Mental Disorders (APAS, 1987), and Leeds Consensus Statement (Sugden, 2006) confirmed the agreement of international researchers and clinicians to retain the term “DCD”. In 2010, European Academy for Childhood Disability (EACD) recommended that the term “DCD” be
used in countries that adhere to the DSM-IV classification and the term “Specific
developmental disorder of motor functions” (SDDMF) in countries where ICD-10 has legal status.
At the same time, some other terms can still be found both in scholarly literature and among clinicians. These include “dyspraxia,” “clumsy child syndrome,” “sensory integrative
dysfunction,” “physical awkwardness,” and “perceptual motor dysfunction” (Blank et al., 2012).
2.2. EPIDEMIOLOGY
Developmental Coordination Disorder has been recognized as one of the most common developmental dysfunctions in childhood (Blank et al., 2012). According to literature, the prevalence of DCD varies from 5-6% (American Psychiatric Association, 2013; Gaines et al., 2008) to 5-10% (Wilmut et al., 2007).
4 DCD has been found to be more common among boys than girls, with male-female ratios varying from 2:1 to 3:1 (Blank et al., 2012).
2.3. AETIOLOGY AND PATHOGENESIS
Unfortunately, the aetiology and pathogenesis of the disorder are still unknown. The symptoms and their onset, progress, and co-morbidities vary, which makes defining aetiology difficult.
Seeking to explain the underlying mechanism behind the disorder, previous research has put forward two hypotheses (Zwicker et al., 2012).
The first one, referred to as the automatisation deficit hypothesis, views DCD as stemming from difficulties in making motor skills automatic (Fawcett, 1992) and therefore views DCD as having to do with the cerebellum.
The second, internal modelling deficit hypothesis, also views cerebellar involvement as being central to the development in DCD (Kageger, Bo, Contreras-Vidal, and Clark, 2004). However, it posits that unsuccessful motor control results from ineffective functioning of an internal model that forecasts the likely sensory effects of motor command (Krakauer & Shadmehr, 2007) and therefore treats motor difficulty as stemming from a mismatch in cerebellar motor signals.
Although the discussion about what exact mechanism could account for DCD is still open, previous research has often viewed it as being related to the functioning of the cerebellum (Canten, Polatajko, Thach, and Jaglal, 2007; Zwicker, Missiuna, and Boyd, 2009). A recent study by Zwicker and colleagues (2012) compared the structure of brains of children with and without DCD in terms of integrity of cerebellar, motor, and sensory pathways and found DCD patients exhibit significantly lower mean diffusivity of the
posterior corticospinal tract and posterior thalamic radiation than healthy individuals. This led the research team to conclude that DCD may be explained by the microstructural
development of sensory and motor pathways.
2.4. SIGNS AND SYMPTOMS
2.4.1. Diagnostic criteria
5 A. The acquisition and execution of coordinated motor skills is substantially below the expected level given the individual’s chronological age and available opportunities for skill learning and use. Difficulties are manifested as clumsiness (e.g., dropping or 3 bumping into objects) as well as slowness and inaccuracy of motor skills performance (e.g., when catching an object, using scissors or cutlery, handwriting, riding a bike, or participating in sports
B. The motor skills deficit in Criterion A significantly and persistently interferes with activities of daily living appropriate to chronological age (e.g., care and
self-maintenance) and impacts academic/school productivity, prevocational and vocational activities, leisure, and play
C. Onset of symptoms is in the early developmental period
D. The motor skills deficits are not better explained by intellectual disability (intellectual developmental disorder) or visual impairment and are not attributable to a neurological condition affecting movement (e.g., cerebral palsy, muscular dystrophy, degenerative disorder).
2.4.2. DCD and daily activities
DCD has a significant influence on daily activity life. Children experience difficulties with daily activities skills such as dressing (i.e., clothing themselves, fastening button or zips, tying shoelaces), eating, personal hygiene, spatial orientation (i.e., buttons in wrong holes, shoes on the wrong feet) (Missiuna, Moll, King, & Law, 2007; Bart, Jarus, Erez,
&Rosenberg, 2011; Van der Linde et al. 2015; Summers, Larkin, & Dewey, 2008).
The two main reasons responsible for changes in daily activity life and participation in self-maintenance activities (such as dressing, bathing, teeth cleaning, and eating) that have been identified by both researchers and parents include a lack of postural control and motor coordination as compared with typically developmental children (Summers et al., 2008; Mandich, Polatajko, & Rodger, 2003).
Parents of children suffering from DCD also report that they have to find ways to help their children cope with those difficulties, for example, by putting kids’ clothes on a bed that
6 2.4.3. DCD and sport and out of school time activities (OST)
Participation in leisure and sport activities has been identified as a major factor promoting community affiliation and therefore contributes to better socializing and a higher quality of life.
It is well known that children with DCD participate in sport and OST activities less (Bult, Verschuren, Jongmans, Lindeman, and Ketelaar, 2011; Jarus et al, 2001; Fong et al., 2011) than typically developed children of the same age. Evidence suggests (Jarus et al, 2001; Fong et al., 2011) that children with DCD not only tend to participate in physical activities less frequently, but also have limited variety of those activities, as well as prefer quieter and more socially isolated activities compared to children without DCD. Jarus and colleagues (2001) found that even mild motor disabilities have a significant impact on children’s participation in OST activities.
In addition, as reported by Fong and colleagues (2011), the level of participation is significantly affected by a child’s weight status, making it difficult for overweight or obese
children with DCD to participate in physical activities, which may be explained by both the reduced physical fitness level and the social stigma associated with obesity (Puhl & Latner, 2007).
2.4.4. DCD and social life
Social participation is one of the most important part of people's lives. Children with DCD often experience social isolation (Mandich et al, 2003; Poulsen, Ziviani, Cuskelly, Smith, 2007). Negative self-image and failure to manage anxiety in social situations are often associated with DCD and may both been linked to social phobia (Hofmann, 2005).
Poulsen and colleagues (2007; 2008; Jarus et al., 2011) found coordination difficulties to be significantly associated with loneliness. Young children and teenagers with DCD have difficulties in communication with their peers and are often excluded from team sports games because of their lack of physical coordination. Stephenson & Chesson (2008) reported that bullying was a commonly identified problem among children with DCD.
Parents of children with motor skill deficits (‘‘clumsiness’’) also reported that their
7 2.4.5. DCD and psychological problems
A recent meta-analysis of 41 articles has demonstrated that children with DCD tend to report lower self-efficacy and competence in physical and social domains, experience greater symptoms of depression and anxiety (Zwicker et al., 2012).
Stephenson and Chesson (2008) found children with DCD experience emotional problems that were described by their mothers as anger, frustration, unhappiness, distress, depression, low self-esteem, shyness, and embarrassment. These mothers also reported that the impact of those difficulties in their children affected the entire family, and at times the extended family as well.
Pearsall-Jone and colleagues (2011) examined pairs of twins and concluded that the levels of anxious and depressive symptomatology were significantly higher among twins with a motor disorder.
Psychological problems experienced by children with DCD have also been found to become more severe with time, progressing from motor and play concerns in early years, to self-care and peer problems in middle childhood, to significant challenges with self-esteem and emotional health in later childhood (Missiuna et al., 2007).
Even more so, these problems are carried over into adulthood, putting adults with DCD at a higher risk for social and psychiatric problems (Mandich et al., 2003).
2.5. ASSESSMENT
A number of assessment tools exist for diagnosing DCD, measuring movement ability, strength, balance, daily activity performance in children with DCD. Screening protocols most often used by health professionals and researchers to reveal and assess children with DCD are presented in Table 2.1.
2.5.1.Movement Assessment Batteries for Children
The Movement Assessment Batteries for Children are norm-referenced tests for
8 MABC/ MABC-2 is considered to be the most appropriate test among available tests for assessing motor proficiency and is recommended as the preferable test with good-to-excellent test–retest reliability and fair-to-good validity (Blank et al. 2012; Bieber, Smits-Engelsman, Sgandurra, Cioni, Feys, Guzzetta, Klingels, 2016).
Intra-class correlation coefficient (ICC) was used in some studies investigating MABC reliability. For example, Croce and colleagues (2001) conducted MABC test with a sample of 106 boys and girls of 5–12 years old and found the values of the ICC to range from 0.92 (for children aged 9–10 years) to 0.98 (for children aged 5–6 years). Chow and Henderson (2003) assessed the reliability of M-ABC among 79 children aged 4–6 years and found ICC of 0.96 across items.
At the same time, a recent study that examined if MABC-2 could be a “gold standard” came to conclusion that it should not be utilized as a sole measurement tool for correctly diagnosing children with DCD (Venetsanou, Kambas, Ellinoudis, Fatouros, Giannakidou, Kourtessis, 2011).
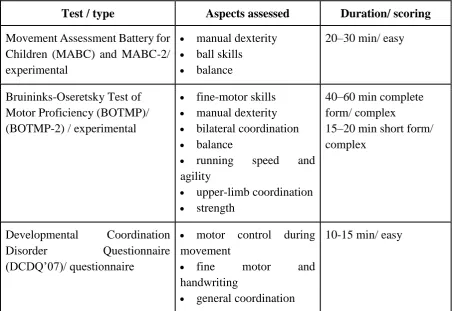
Table 2.1.
Developmental Coordination Disorder screening protocols
Test / type Aspects assessed Duration/ scoring
Movement Assessment Battery for Children (MABC) and MABC-2/ experimental
manual dexterity
ball skills
balance
20–30 min/ easy
Bruininks-Oseretsky Test of Motor Proficiency (BOTMP)/ (BOTMP-2) / experimental
fine-motor skills
manual dexterity
bilateral coordination
balance
running speed and
agility
upper-limb coordination
strength
40–60 min complete form/ complex
15–20 min short form/ complex
Developmental Coordination
Disorder Questionnaire
(DCDQ’07)/ questionnaire
motor control during movement
fine motor and
handwriting
general coordination
10-15 min/ easy
9 2.5.2. Bruininks-Oseretsky Tests of Motor Proficiency (BOTMPs)
BOTMP and BOTMP-2 are standardized, norm-referenced tests of motor function with norms set for 4 to 21 years. The age norms have 4-month intervals for preschool children, half-year intervals for schoolchildren and 1-year intervals for adolescents above 14 years, with separate norms provided for each sex.
The BOTMP/BOTMP-2 shows good-to-excellent reliability, fairly good validity, good 8 specificities, but lower sensitivity than MABC (Blank et al. 2012; Deitz, Kartin, & Kopp, 2007; Bieber et al., 2016). Deitz and colleagues (2007) used Pearson product moment correlation coefficient to assess reliability of the BOTMP-2. The Inter-rater reliability coefficient was found to be over .90 for the Short Form and for all Complete Form subtests and composites with one exception (the Fine Motor Precision subtest, Adj. r = .86). Pearson product moment correlation coefficients for the Test-retest reliability exceeded .80 for the three age groups for the Total Motor Composite and the Short Form.
In order to examine validity of the measures, Deitz and colleagues (2007) conducted three studies and found that in all three studies, each clinical group had significantly lower scores (p < .001) than a non-clinical comparison group, thus confirming the ability of BOTMP-2 to distinguish between non-clinical groups and specific clinical groups. Findings were similar for both the Complete Form and the Short Form.
The authors also assessed the strengths and limitations of BOTMP-2 and concluded that the short form of the BOTMP-2 is clinically useful for assessing 6-21 year olds with
suspected global motor delays. However, due to reliability limitations (see Deitz et al., 2007, Table 2.2.), authors suggest that therapists be cautious when using this test for determining a child’s skill level in specific areas of motor development. Bieber and colleagues (2016)
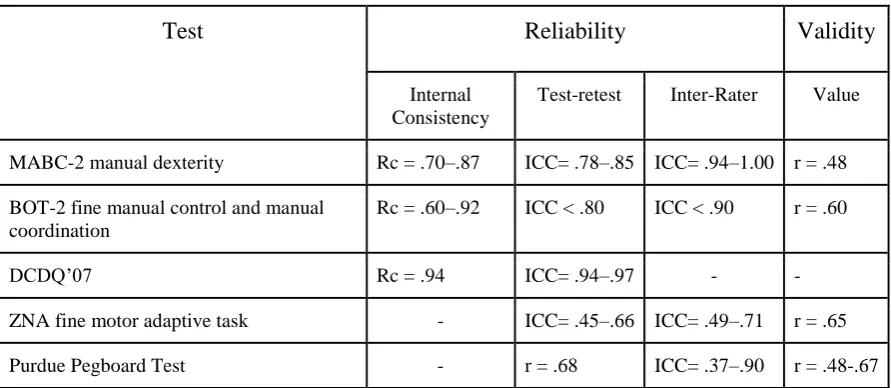
10 Table 2.2.
Reliability and validity of some assessment tools for children with DCD
Test Reliability Validity
Internal Consistency
Test-retest Inter-Rater Value
MABC-2 manual dexterity Rc = .70–.87 ICC= .78–.85 ICC= .94–1.00 r = .48
BOT-2 fine manual control and manual coordination
Rc = .60–.92 ICC < .80 ICC < .90 r = .60
DCDQ’07 Rc = .94 ICC= .94–.97 -
-ZNA fine motor adaptive task - ICC= .45–.66 ICC= .49–.71 r = .65
Purdue Pegboard Test - r = .68 ICC= .37–.90 r = .48-.67
Note: Rc - Cronbach’s alpha; Rp - Pearson correlation; Rs - Spearman correlation; ICC- intraclass correlation coefficient; r - type of correlation not specified
2.5.3. Developmental Coordination Disorder Questionnaire (DCDQ-07)
DCDQ’07 is a questionnaire for children aged 5-15 years that is used to diagnose DCD. DCDQ’07 questionnaire is to be filled out by parents as individuals having the arguably best
knowledge of their children and therefore the best ability to reliably report their children’s developmental problems.
By design, the DCDQ’07 has been found to be the most accurate in identifying children
who may have DCD (Wilson, Crawford, Green, Roberts, Aylott, & Kaplan, 2009). The overall sensitivity of DCDQ’07 is 84.6% (ranging from 75.0% to 88.6%) and the specificity
is 70.8% 9 (66.7%-75.6%) (Wilson & Crawford, 2012).
2.5.4. Other assessment diagnostic tools
Several other tests for assessing motor functions have been used in research studies, such as Zurich Neuromotor Assessment (Kakebeeke, Egloff, Caflisch, Chaouch, Rousson, Largo, Jenni, 2014; Rousson et al., 2008), McCarron Assessment Neuromuscular
11 according to the established standards for rigorous research design (Bowling, 2014, pp. 166-168). It is for this reason that they are not discussed in greater detail here.
Bieber and colleagues (2016) suggested that another test be used to assess hand
dexterity for children with DCD: Purdue Pegboard Test (PPT). PPT is a norm-referenced test for children aged 5-18 years and has been recommended in previous research as having relatively higher reliability and validity and fewer confounding variables, such as age, gender, and handedness (Causby, McDonnell, Hillier, 2014; Lindstrom-Hazel & Vander Vlies Veenstra, 2015).
2.6. INTERVENTION APPROACHES
Due to the existing lack of knowledge about the aetiology and pathogenesis of DCD, there is no unified approach and standards of treatment. The majority of intervention
approaches could be divided into two groups: task-oriented and process-oriented intervention programs. Two recent reviews of effectiveness of intervention for children with DCD (Hillier 2007; Offor, Williamson, Caçola, 2016) both found intervention programs to be effective in terms of improving balance, coordination, muscle strength and function, and motor function. At the same time, the most recent of those reviews emphasized the lack of rigorous research studies and suggested that future researchers should explore the effectiveness of therapy modalities and their outcomes for children with DCD (Offor et al., 2016).
2.6.1. Task-oriented approach
Task-specific intervention focuses on problem solving and direct teaching of specific functional, meaningful skills, with the goal of optimizing movement efficiency and
performance given an individual’s abilities (Blank et al., 2012; Wilson et. al., 2005).
Task-oriented frameworks are informed by the dynamical systems and the neural group selection theory and include functional, task-specific, and cognitive approaches.
12 2.6.2. Process-oriented approach
The process-oriented approach in the context of intervention means that the treatment addresses components or body functions needed to perform activities. In the case of DCD, the underlying assumption is that the improvement of body functions, such as perception, sensory integration, muscle strength, and visual–motor perception, leads to better skill performance (Blank et al., 2012). Sensory integration therapy (SIT) (Leong, Carter, & Stephenson, 2015), kinaesthetic training (Laszlo & Bairstow, 1983; Sims, Henderson, Hulme, Morton, 1996), perceptual motor training (PMT) (Jonstone & Ramon, 2011; Milander, 2015) are the examples of the process-oriented approach.
Besides these intervention methods, another example of applying the process-oriented approach could be traditional physical therapy, such as strength training. Strength training has been found to improve balance and coordination as well as muscular strength and endurance (Kordi, Sohrabi, Kakhki, Hossini, 2016).
One of the more well-explored programs is a core stability training, which develops the muscles of the lumbopelvic and abdominal regions that provide stability of the spine during movement and during a change in posture (Bhayani & Singaravelan, 2012; Kane & Bell, 2009). This program potentially affects the lack of strength, coordination, and balance that children with DCD have, as core muscles are fundamental for developing awareness of position and movement. They were some research that have been studied strength training program (see Table 2.3). The major outcomes were improvement of the trunk stability, balance, physical skills (running, jumping, hopping), the level of participation through the promotion of muscular capacity (strength and endurance) and improved recruitment at the level of neural control.
2.6.3. Comparing of the effectiveness of approaches
There is a lack of studies that would compare different approaches to the treatment of children with DCD in terms of influence on motor proficiency. Only those study that compared different approaches and where motor skills of children with DCD were assessed are reported in Table 2.4.
13 trial by allocating twenty-two children diagnosed with DCD aged 6-9 years in two different groups. BOT-SF and Sensory Organization Test (SOT) were used as main measures in the pre- and post-interventions. Both groups completed a 8-week program of face-to-face sessions once a week, complemented with a program of exercises performed at home. The comparative analysis of the results in the two groups found the two programs to be equally effective in improving motor proficiency among children with DCD.
However, there were several limitations of this study. First of all, BOT-SF and SOT were used as the main assessment tools, even though they are not considered to be the “gold standard” for DCD and have not been recommended by EACD to be used in clinical studies.
Moreover, only the total score for BOT-SF was counted without specifying scores for subtests. Secondly, the study relied on a small group (N=22) of children of a rather narrow age range of 6 - 9 years old.
14 Table 2.3.
Studies examining the effectiveness of strength training intervention programs
Author (year)/ Country
Participants (number,
age, sex)
Study design Assessment tools Type of exercises Frequency & duration of intervention
Findings
Kordi et al. (2016)/ Iran
N: 30 A: 7-9 yrs S: M & F
RCT IG: Strength training group CG: Routine exercises in physical education class BOT-2 HHD (isometric strength of hip abductor muscles/ plantar flexors )
IG: Theraband elastic exercises: - leg abductors
- leg adductors - knee flexion - knee extension - bridging
- bilateral heel raises
2 sess/week
60 mins
12 weeks
Muscle strength significantly increased (p <0.001)
Static balance performance improved (p <0.05)
No significant impact on the dynamic balance performance (p >0.05)
Kane & Bell (2009)/ Canada
N: 3 A: 9-11 yrs S: M& F
Case Study DCDQ-07 BOTMP-SF COPM CSAPPA CSS
Core Stability:
exercises to increase strength of key trunk and hip muscles
+ Task-Specific Intervention:
teaching of age-appropriate sport skills
2 sess/week
6 weeks
home exercise program
Improved static balance
Increased core muscles strength
Improved jumping, running skills
CSAPPA increased
Bhayani & Singaravelan (2012)/ India
N: 30 A: 6-16 yrs S: M & F
RCT IG: Strength training + Task- training exercises CG: Task- training exercises DCDQ-07 BOTMP-SF CSAPPA FPFHS
IG: Core stability
(bird dog, plunk, hip bridge, roll up with a ball, single leg bean bag kick) + Task-Specific Intervention (teaching of age-appropriate sport skills)
CG: Task-Specific Intervention
2 sess/week
6 weeks
55 mins
Change scores[post-pre]
BOTMP-SF IG: 24.38± 6.911 CG: 2.928± 1.639
CSAPPA IG: 15.923± 8.261 CG: 5.714 ±1.637
FPFHS
IG enhanced motivation and increased in task-specific confidence for physical activity more than CG Note: A - Age of Participants; BOTMP-SF - Bruininks-Oseretsky Test of Motor Proficiency (Short Form); CG -Control group; COPM - Canadian Occupational and Performance Model; CSAPPA - Children’s Self - Perceptions of Adequacy in and Predilection for Physical Activity; CSS - Core Stability Screen; F - female.
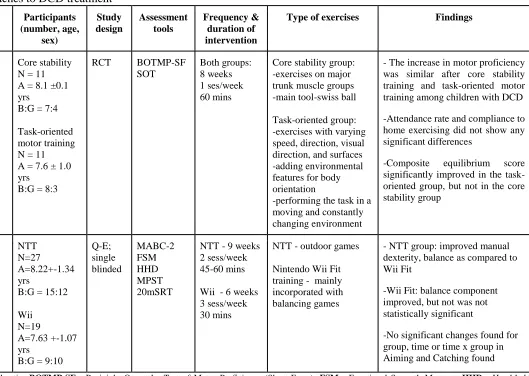
15 Table 2.4.
Studies comparing different approaches to DCD treatment
Author (year)/ Country Intervention program Participants (number, age, sex) Study design Assessment tools Frequency & duration of intervention
Type of exercises Findings
Au et al. (2014)/ China
Core stability exercises vs task-oriented motor training
Core stability N = 11 A = 8.1 ±0.1 yrs
B:G = 7:4
Task-oriented motor training N = 11 A = 7.6 ± 1.0 yrs
B:G = 8:3
RCT BOTMP-SF SOT
Both groups: 8 weeks 1 ses/week 60 mins
Core stability group: -exercises on major trunk muscle groups -main tool-swiss ball
Task-oriented group: -exercises with varying speed, direction, visual direction, and surfaces -adding environmental features for body orientation
-performing the task in a moving and constantly changing environment
- The increase in motor proficiency was similar after core stability training and task-oriented motor training among children with DCD
-Attendance rate and compliance to home exercising did not show any significant differences
-Composite equilibrium score significantly improved in the task-oriented group, but not in the core stability group
Ferguson et al. (2013)/ South Africa
NTT vs Nintendo Wii Fit training
NTT N=27
A=8.22+-1.34 yrs
B:G = 15:12
Wii N=19
A=7.63 +-1.07 yrs
B:G = 9:10
Q-E; single blinded MABC-2 FSM HHD MPST 20mSRT
NTT - 9 weeks 2 sess/week 45-60 mins
Wii - 6 weeks 3 sess/week 30 mins
NTT - outdoor games
Nintendo Wii Fit training - mainly incorporated with balancing games
- NTT group: improved manual dexterity, balance as compared to Wii Fit
-Wii Fit: balance component improved, but not was not statistically significant
-No significant changes found for group, time or time x group in Aiming and Catching found
16 2.7. CONCLUSION
The most recent of the relevant review articles on DCD emphasized the lack of rigorous research studies and suggested that future researchers should explore the effectiveness of therapy modalities and their outcomes (Offor et al., 2016).
17
Chapter 3:
Research Design
3.1 METHODOLOGY AND RESEARCH DESIGN
3.1.1. Study Design & Setting
The study was designed as a randomized controlled trial. Participants were randomly assigned into two groups. The first group underwent a task- training program (n=9), the second one (n=91) performed a strength- training program.
The study took place in three settings, the Biokinetic Clinic at Waikato Institute of Technology and two primary schools (Knighton Primary School and Hamilton East Primary School) in Hamilton, Waikato region. Recruitment was conducted through schools and occupational therapy services.
3.1.2. Ethics
As the research project had participants undergo a fitness testing and exercise rehabilitation program, the study was submitted for approval to the Ethics Commission of Wintec Research Office. The letter of approval from the Ethics Commission is in Appendix 1.
All potential participants of the study and their parents were provided with detailed information about the project, including information about risks, benefits, and the type of feedback to be provided once the project would be completed (see Appendices 2 and 3). Full consent from parents was obtained prior to the study (see Appendix 4).
The participation in the study was voluntary and participants could withdraw from taking part at any time if they wished to do so. This information was also provided in the information leaflets for kids and their parents.
All information about participants was kept confidential, with the name and any other identifiable information not to be published or publicly referred to elsewhere. For this reason,
18 all the participants are referred to hereafter by the generic name “Participant,” followed by an
ID number they were assigned at the point of recruitment.
3.1.3. Recruitment
The recruitment of participants was carried out through teachers and healthcare professionals. At the first stage, information leaflets (see Appendix 5) were emailed to schools and occupational therapy (OT) services, after which the following steps were taken, depending on the entity involved:
Schools: Upon the receipt of the leaflets, schools were asked to share information about the project with parents. This was done in two ways, at the schools’ discretion. In some schools, class teachers identified possible DCD candidates according to the guidelines laid out in the leaflets. Parents of those children were then contacted by a class teacher or a deputy principal, who provided them with information about the research study and the researcher’s contact details. The alternative way for distributing information was posting the recruitment announcement in schools’ newsletters, with the invitation for interested parents to contact the researcher via email or phone.
Occupational therapists: All occupational therapists were provided with the
researchers’ contact information and were asked to inform parents, once they had identified any eligible study participants. The parents then contacted the researcher directly by email.
An attempt was also made to recruit participants through the Waikato DHB Child Development Centre. However, upon discussing this possibility with the Centre staff, it became clear that the Centre is working exclusively with children diagnosed with a concomitant pathology, an excluding criterion in the study. That is why the decision was made not to recruit children through the Waikato DHB.
19 filled out a DCDQ-07 questionnaire and signed a consent form. In some occasions, when parents were not able to meet with the researcher personally due to a scheduling conflict or some other reason, they were sent the DCDQ-07 questionnaire and the consent form by email.
If the DCDQ-07 score based on the analysis of the questionnaire data met the DCD criteria, a child and his/her parents were invited to an assessment session, during which the child was tested using the MABC-2. If the DCDQ-07 score did not meet the DCD criteria, parents were informed that child did not meet the eligibility criteria and were thanked for their responsiveness.
As soon as a child had completed the test, data were analysed, and the final decision whether to include the child in the study was taken. After that, a child was randomly assigned to either treatment group. An online random number generator (https://www.random.org/) was used to assist in randomisation process.
A total of 20 children were recruited between July and September 2017, assigned to the groups of 9 (task-oriented) and 11 (strength training). In the course of the program, two children dropped from the study, which left the researcher with a total of 18 participants (9 children per group).
20
Figure 3.1. Stages of the recruitment process
Information sent to schools, OT services, Waikato DHB
Children Referred Parents contacted directly
Children pre-screened Providing a consent
form and DCDQ-07
Sending consent form
and DCDQ-07 Parents declined
Face-to-face meeting with parents and kids
Parents contacted in a week Parents provided with information
leaflets for parents and children
Task-oriented group
Randomised
Intervention Intervention
Strength-training group Pre-tested (MABC-2)
Deemed eligible
Dismissed if the DCD pre-screening criteria not met
21 3.1.4. Sampling
Initially 23 schools in Hamilton were sent an information leaflet with an invitation to take part in the project, followed up by a meeting with a schools’ principal or deputy
principal. Seven schools agreed to participate. In three schools, teachers contacted the parents of 4-6 grade children who displayed DCD symptoms as laid out in leaflets for teachers. The four remaining schools chose to distributed information about research by posting it in the school newsletters. Parents who were interested in participation then directly contacted the researcher.
Out of the three occupational therapists contacted, one agreed to participate in the study and referred two children as a result.
For participation in the project, children of both genders were selected. The age frame was 8 yrs. 0 months – 11 yrs. 11 months, chosen to correspond to the age of a primary school 4-6th-grader.
3.1.5. Eligibility Criteria
In order to be considered eligible for the trial, individuals had to comply with the following inclusion criteria:
● Male and female children aged 8 yrs. 0 months – 11 yrs. 11 months
● Have a total test score at or below the 15th percentile on the Movement Assessment Battery
for Children (MABC-2)
● Have a total score of 15-57 on the Developmental Coordination Disorder
Questionnaire-2007 (DCDQ-07)
3.1.6. Exclusion Criteria
The exclusion criteria were as follows:
● Children with a total score above the 15th percentile on MABC-2 ● DCD children with mental retardation
● DCD children with any congenital cardio-respiratory condition, congenital musculoskeletal
condition
● DCD children with severe visual and/or hearing disability preventing them from
22 ● Children with behavioural difficulty making them unable to complete exercises prescribed
by either program
3.2 ASSESSMENT
As soon as children had been deemed meeting the eligibility criteria and all preparatory work had been completed, children were invited to assessment sessions. Assessments took place at the Biokinetic Clinic at Wintec and at schools. Parents were invited to be present during the assessment session if they chose to do so. The assessments lasted about 60 minutes each and were conducted by the researcher.
3.2.1. Pre-screening
The DCDQ-07 questionnaire was used for screening purposes, as a tool providing the optimal combination of user-friendliness and reliability despite its self-reported nature.
3.2.1.1. Developmental Coordination Disorder Questionnaire - 2007 (DCDQ-07)
DCDQ-07 has been chosen as a measurement tool as providing the best combination of user-friendliness and demonstrated reliability despite its self-reported nature and was used in the study for screening purposes.
The DCDQ-07 questionnaire was filled out by parents as possessing arguably the best knowledge of their children as compared with other individuals and therefore having the best ability to reliably report their children’s developmental problems. Despite its self-reported
nature, previous research has found DCDQ-07 to be the most accurate pre-screening tool for identifying children who may have DCD (Wilson, Crawford, Green, Roberts, Aylott, & Kaplan, 2009).
3.2.3. Primary outcome measure
23 3.2.3.1. Movement Assessment Battery for Children (MABC-2)
The MABC-2 is designed to identify and assess the severity of the coordination and balance impairments in motor skills of children and adolescents and has been validated in previous research by using a large representative normative sample (Blank et al., 2012).
MABC-2 contains 8 subtests in three domains: manual dexterity, aiming and catching, and balance. It includes different tasks for three age bands: 3-6 years, 7-10 years, 11-16 years. Given the age of the study participants, the second and third age bands were applied.
7-10 years age band: The manual dexterity subtest involves three separate tasks: (1) drawing a line within a printed pattern, with the number of mistakes counted; (2) timed peg-placing test, with the speed of completing the task recorded (both hands are tested); (3) threading task using a piece of lace and a plastic board with holes. The best result out of two trials is recorded.
The aiming and catching subtest involves two separate tasks: (1) the aiming task has a child stand 1.8 meters from a target mat attempting to throw a beanbag into a defined red mark on the mat (the number of correctly executed throws out of 10 is recorded); (2) for the catching task, a child stands 2 meters from a wall and throws a tennis ball against the wall, attempting to catch the ball without trapping it against the body with two hands (the number of correct catches out of 10 is recorded).
The balance subtest has three tasks: (1) hopping on one leg across 5 mats; (2) standing on a balance board as long as a child can (maximum time is 30 secs); (3) walking forward heel-to-toe along a 4.5-meter line on the floor marked with a tape. Each test has a practice trial and two actual trials, with the best out of two attempts recorded.
11-16 years age band: The manual dexterity subtest involves three tasks: (1) inverting 12 pegs, timed (both hands are tested); (2) constructing triangles from perforated plastic strips with nuts and bolts; (3) drawing a line within a printed pattern. The best result out of two trials is recorded.
24 The balance includes three subtests: (1) static balance is tested by timing a child
balancing on two balance boards; (2) dynamic balance is assessed by having a child walk backward toe-to-heel along a 4.5-meter line and zigzag hoping on 5 mats. A child has two attempts for each of these tests, with the best result written down.
The raw scores from each domain were then transformed into standard scores and added to ascertain the total test score, which ranges from 0 to 40 (Henderson & Sugdon 2007). Normative data are available for each age from the Examiner’s Manual (2007). The
total test score was then used to calculate the overall movement difficulty percentile. According to the Examiner’s Manual (2007), a child with score below the 5th percentile is considered to have a definite movement difficulty. Those whose score below the 15th percentile are deemed to be at risk of movement difficulty, and child with score above the 15th percentile is considered a healthy child without disorder.
3.2.4. Secondary outcome measures
3.2.4.1. Home exercise enjoyment scale for children
The home exercise enjoyment scale for children utilized the images of smiling faces (smileys) as measurements units, which children had to circle themselves to indicate their level of enjoyment from the home exercise. Pictures with smileys were included in each home exercise program sheet and had five faces, with captions ranging from “Absolutely No” to “Yes!”. The scale was then converted into a 5-point Likert scale (from 1= “Absolutely No”
to 5 = “Yes!”), with greater values corresponding to a greater level of enjoyment.
3.2.4.2. Post-intervention interviews with parents
A post-intervention parent interview questionnaire had three bands of questions. The first one asked if a child had enjoyed exercise sessions delivered in the Clinic or at school. A five-point Likert scale was used, with answers, 1= “Strongly agree”, 2= “Agree”, 3= “Neither agree nor disagree”, 4= “Disagree”, 5= “Strongly disagree”. The second and third bands contained questions about the enjoyment and encouragement needed during home exercises, asking parents to indicate, on a 5-point Likert scale, how often a child seemed to be enjoying the exercises and how often the child needed parental encouragement to complete the
25 and 5= “Never”. A copy of the post-intervention parent interview questionnaire is presented in Appendix 6.
3.2.5. Controls
3.2.5.1. Height
Height was measured in centimetres using a standard Seca 206 Body measuring tape with wall stop. Children were instructed to take their shoes off and to stand close to the wall with feet together and arms along the body, so that their head, upper back, buttocks and heels were touching the wall. Once positioned this way, children were then asked to look straight ahead, take a deep breath in and out. The height reading was then taken three times, with the average result recorded.
3.2.5.2. Weight
Weight was measured in kilograms using a standard Seca scales. Children were asked to wear light clothes and to remove their jackets and shoes. Three measurements were then taken and averaged.
3.2.3.3. Body Mass Index (BMI)
Body Mass Index (BMI) was expressed in kg/m2 and was calculated by using the standard formula of dividing the weight by the height squared.
3.3.ORDER OF TESTING
Testing was conducted in a standardised manner. All testing was done by the researcher, using the same equipment tools. Firstly, measures of height and weight were done, then MABC-2 test was run. Appendix 7 presents the assessment form used for recording results.
3.4.INTERVENTION
26 In addition, each group completed a home exercise program over the course of eight weeks, with exercises varying from week to week (eight weekly sets in total). Each
intervention group had its own exercises, according to the type of the intervention program it has been assigned to.
3.4.1. Exercise sessions
An 8-week programme was chosen to optimize attendance and the subsequent effects of the intervention. Exercise intervention is a new approach to DCD treatment in New
Zealand, so it was difficult to project the compliance levels of children and parents to the new method. In previous studies it was shown that during 6-10-weeks intervention period
improvements in motor ability were successfully achieved, and frequency of sessions varied from once to twice per week (Peens, Pienaar, and Nienaber, 2008; Pless, Carlsson, Sundelin, and Persson, 2000; Kane & Bell, 2009; Hung & Pang, 2010; Bhayani & Singaravelan, 2012; Au et al., 2014). In addition, 8 weeks of the intervention is a reasonable period as school term lasts 10 weeks and 2 weeks are needed for assessment (pre- and post-testing) sessions.
The dates and time for sessions were discussed with parents during the assessment session and stayed the same over the course of intervention. An explicit attempt was made to make it clear to the parents that full attendance was crucial to ensuring the maximum benefit from participation in the program.
Exercise sessions were held either individually or in groups of two. It was originally planned to hold sessions exclusively in groups, but a number of children found it too
uncomfortable to exercise in groups, which was explained by their parents as stemming from their lack of confidence and communication skills. In contrast, some children did prefer exercising in groups. Given the results of previous research that found no statistically
significant differences among group and individual sessions in terms of their effect on motor skills (Hung & Pang, 2010), it was decided to conduct both individual and group sessions, leaving the choice to the children’s discretion. To account for the possible effect of the mode
of delivery (individual vs. group), the latter was statistically controlled for in subsequent data analysis reported further.
27
Balance
Agility
Proprioception
Ball catching and aiming
Coordination
Fine motor skills
The strength- training program included the exercises targeted at the following:
Core strength
Upper-body strength
Lower-body strength
Each exercise session consisted of warm-up (about 5 mins), workout (30-35 mins) and down (about 5 mins) parts. The warm-up (warm-up exercise for big joints) and cool-down (stretching) parts had the same exercises for both groups. The exercises included in the supervised portions of the intervention programs did not change from session to session, but their intensity, number of repetitions and sets steadily increased over time. The program descriptions are presented in Appendices 8 (task-oriented group) and 9 (strength training group).
Attendance of the supervised sessions was taken by the researcher.
3.4.2. Home program
Home programs had eight different sets of exercises, one for each week and did not have a limit with regards to the number of repetitions and sets, so all participants could choose their own exercise pace. Each week, at the end of the supervised exercise sessions, the Researcher demonstrated a home exercise set and had a child perform 2-3 repetitions to make sure that everything was clear to a child.
At the beginning of the programme, each child and his or her parents were provided with a home exercise logbook (see Appendix 10) and instructions for completing it
28 to help their children and recommendations about the ways to encourage the children, if needed.
3.5. RETESTING
One week after completing the 8-week intervention exercise program (during the week when the last home exercise was completed) all children from both the task-oriented and strength training program were retested. All tests were performed in the same sequence as during the baseline testing. The same assessment tools were used and the Researcher conducted all tests.
Parents were asked to fill out a post-intervention parent interview questionnaire and to leave their own comments if they were willing to share them.
3.6. ANALISYS
The data for statistical analysis of the motor proficiency changes were collected using the pre-test and post-test assessment of MABC-2 for both intervention groups. The statistical analysis was conducted using a series of one-way ANOVAs and paired t-tests.
29
Chapter 4: Results
4.1. RECRUITMENT
The recruitment and group allocation processes are outlined in Figure 4.1. Initially, twenty-four children were considered for participation in the study. After screening and testing, 20 children were recruited.
Fifteen children were referred by school teachers and an occupational therapist. The occupational therapist referred two children, both of whom were found eligible and were enrolled in the study. Out of the remaining thirteen children referred by the school teachers, three were found ineligible and were subsequently excluded; the parent of one child, after receiving an informational leaflet, chose not to participate in the study, without elaborating on the reason for her decision.
Nine children were referred by their parents who got interested in the study by either reading about it in a school newsletter (7 children) or learning about it by the word-of-mouth, from their acquaintances from among school employees (2 participants). All of those children were found eligible for participation and were subsequently enrolled in the study.
From the children who were deemed ineligible, one child had intellectual disability, and one was hearing-impaired, which made them unable to take part in exercise sessions. One child was found ineligible because, according to the MABC-2 test, he had a score and percentile rate that corresponded to the normal values.
4.2. RANDOMISATION
After the pre-screening and testing sessions, 20 children were randomly assigned into two groups, using an online random number generator available at https://www.random.org/, with the task-oriented group assigned number 1, and the strength training group – number 2.
30
Figure 4.1. Recruitment: number of participants at each point of the process Referred by
teachers (n=13)
Referred by parents (n=9)
Filled DCDQ-07 (n=21)
Assessment (MABC-2) (n=21)
Declined (n=1)
Deemed ineligible (n=2)
Parents contacted in 1 week (n=23)
Task-oriented group (n=9)
Randomised (n=20)
Intervention (n=9)
Intervention (n=10)
Strength trainings group (n=11)
Deemed eligible (n=20)
Excluded (n=1) Referred by OT
(n=2)
Screened referrals, parents given leaflets (n=24)
31 4.3. PRE-SCREENING: DEVELOPMENTAL COORDINATION DISORDER QESTIONNARIE – 2007 (DCDQ-07)
As previously mentioned in Chapter 3, DCDQ-07 was used as a pre-screening tool. Parents/whanau who were interested in enrolling their child in the research project, filled the questionnaire. If the total score was less or equal 57, children were invited for further
assessment with a MABC-2 scale.
Although the task-oriented group had a slightly higher total score (M = 38.0, SD = 12.1) than the strength training group (M = 33.1, SD = 8.1), a one-way ANOVA found the
differences between the group means to be non-significant (F (1,17) =1.011, p=.33), indicating that the randomization in terms of DCDQ-07 was successful.
4.4. BASELINE CHARACTERISTICS (CONTROLS)
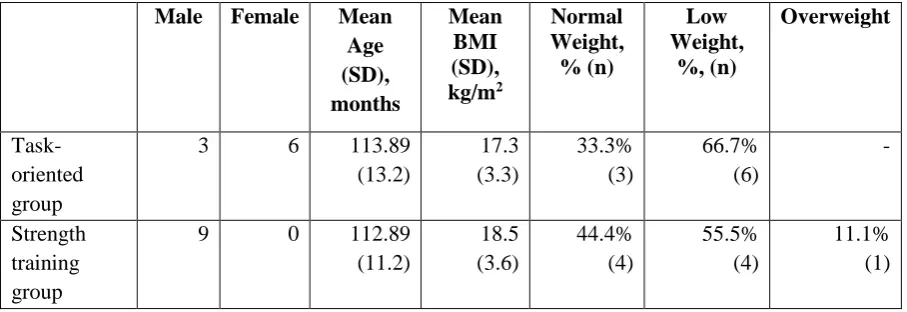
The baseline demographics of the participants who completed the treatment (n=18) are presented in the Table 4.1.
The age of the children ranged from 8 to 12 years old, which meets the inclusion criteria discussed in Chapter 2. The boys-to-girls ratio was 2:1, which corresponds to the global DCD statistics (Blank et al., 2012).
The task-oriented group consisted of both girls (66.7%; n=6) and boys (33.3%; n=3); the strength trainings group consisted of boys (100%; n=9).
Overall, the majority of the children had low weight (55.5%; n=10), 38.8% (n=7) had normal weight, and 5.5% (n=1) were overweight, using the NHS National Obesity
Observatory guidelines on BMI percentiles (2006).
Table 4.1.
Baseline characteristics of study participants (n=18) Male Female Mean
Age (SD), months Mean BMI (SD), kg/m2 Normal Weight, % (n) Low Weight, %, (n) Overweight Task-oriented group
3 6 113.89 (13.2) 17.3 (3.3) 33.3% (3) 66.7% (6) - Strength training group
32 Given that, according to the Examiner’s Manual (2007), “no significant gender
difference emerged for the Total Motor Score,” the gender differences between the two
groups was not viewed as potentially affecting MABC- 2 as the primary outcome measure.
4.5. PRIMARY OUTCOME MEASURE: MOVEMENT ASSESSMENT BATTERY FOR CHILDREN (MABC-2)
The inclusion criteria in terms of MABC-2 was the Total test score at or below the 15th percentile, which corresponded to the raw total test score equalling to or being lower than 67. In this section only baseline results of both intervention groups are presented.
MABC- 2 test was conducted by the Researcher in the Biokinetic Clinic or at schools, using the same equipment. Each child was tested during the same testing session. Testing time varied from 25 to 40 mins and occasionally included 1-3-minute breaks, if a child needed them.
Figure 4.2. Comparison of the baseline average raw total test score, manual dexterity, ball skills, and balance
The baseline values for total test score (Total1), manual dexterity (MD1), aiming and catching skills (Ball1), and balance (Balance1) have been recorded and analysed separately for each group. Figure 4.2 presents the mean scores for all the variables for both groups.
Mean scores and standard deviations of the total score, manual dexterity, ball skills, and balance for each exercise group are presented in Table 4.2.
53.8
17
12.9
23.9 48.4
17.2
13.7 17.6
0 10 20 30 40 50 60
Total1 Dext1 Ball1 Balance1
33 Table 4.2.
Mean and SD volumes of the score bands for task-oriented and strength training group
Task - oriented group Strength training group
Mean SD Mean SD
Total Score 53.78 10.414 48.44 10.370
Manual
Dexterity 17.00 5.123 17.22 5.911
Ball skills 12.89 3.100 13.67 2.500
Balance 23.89 5.754 17.56 5.681
4.6. STATISTICAL ANALYSIS OF THE BASELINE VARIABLES
In order to analyse the effectiveness of randomization, a series of one-way ANOVAs were run to determine whether there were any statistically significant differences between the intervention groups in terms of the means of their baseline variables: Age, BMI, MABC-2: Total test score (Total), Balance, Ball skills (Ball), Manual Dexterity (MD), and DCDQ- 07. The results are presented in Table 4.3. (a,b).
34 Table 4.3. Between-group analysis of the baseline data
a) Descriptives
N Mean Std. Deviation Std. Error
95% Confidence Interval for Mean
Minimum Maximum Lower Bound Upper Bound
Age Task group 9 113.89 13.233 4.411 103.72 124.06 96 137
Strength group 9 112.89 11.241 3.747 104.25 121.53 102 136
Total 18 113.39 11.922 2.810 107.46 119.32 96 137
BMI Task group 9 17.2778 3.30143 1.10048 14.7401 19.8155 14.10 22.10
Strength group 9 18.5444 3.75304 1.25101 15.6596 21.4293 14.20 25.00
Total 18 17.9111 3.49030 .82267 16.1754 19.6468 14.10 25.00
Total Task group 9 53.78 10.414 3.471 45.77 61.78 31 66
Strength group 9 48.44 10.370 3.457 40.47 56.42 27 61
Total 18 51.11 10.448 2.463 45.92 56.31 27 66
MD Task group 9 17.00 5.123 1.708 13.06 20.94 9 24
Strength group 9 17.22 5.911 1.970 12.68 21.77 5 22
Total 18 17.11 5.368 1.265 14.44 19.78 5 24
Ball Task group 9 12.89 3.100 1.033 10.51 15.27 10 17
Strength group 9 13.67 2.500 .833 11.74 15.59 9 18
Total 18 13.28 2.761 .651 11.90 14.65 9 18
Balance Task group 9 23.89 5.754 1.918 19.47 28.31 10 30
Strength group 9 17.56 5.681 1.894 13.19 21.92 8 27
Total 18 20.72 6.433 1.516 17.52 23.92 8 30
DCDQ-07 Task group 9 38.00 12.155 4.052 28.66 47.34 21 57
Strength group 9 33.11 8.069 2.690 26.91 39.31 26 49
35 b) ANOVA
Sum of Squares df Mean Square F Sig.
Age Between Groups 4.500 1 4.500 .030 .865
Within Groups 2411.778 16 150.736
Total 2416.278 17
BMI Between Groups 7.220 1 7.220 .578 .458
Within Groups 199.878 16 12.492
Total 207.098 17
Total Between Groups 128.000 1 128.000 1.185 .292
Within Groups 1727.778 16 107.986
Total 1855.778 17
MD Between Groups .222 1 .222 .007 .933
Within Groups 489.556 16 30.597
Total 489.778 17
Ball Between Groups 2.722 1 2.722 .343 .566
Within Groups 126.889 16 7.931
Total 129.611 17
Balance Between Groups 180.500 1 180.500 5.521 .032
Within Groups 523.111 16 32.694
Total 703.611 17
DCDQ-07 Between Groups 107.556 1 107.556 1.011 .330
Within Groups 1702.889 16 106.431
36 4.7. EXERCISE SESSIONS
Each group of children completed eight weeks of consecutive exercise classes conducted either in the Biokinetic Clinic at Wintec or at schools. Table 4.4. presents attendance rates for the two intervention groups.
The average attendance of the task-oriented group at the 8 classes was 7.8 classes. Out of nine participants, eight (88.9%) attended all exercise sessions, one child (11.1%) attended 6 sessions.
In strength training group, the mean number of completed sessions was 7.7. Of the nine children assigned to the strength intervention program, seven (77.8%) attended every class, one (11.1%) child missed two sessions, one (11.1%) child missed only one session.
Reasons for non-attendances were sickness (n=3) and parents’ scheduling conflict that prevented them from dropping children at the Clinic/school (n=2).
Table 4.4.
Attendance of the exercise sessions
Number of attended
sessions 8 7 6 5 4
Task-oriented group
(number of children) 8 --- 1 --- ---
Strength training group
(number of children) 7 1 1 --- ---
As discussed in Chapter 3, children from both intervention groups completed the researcher-led sessions either individually or in groups of two.
Individual sessions were held with three children (33.3%) from task-oriented group participated, and four children from the strength-oriented group (44.4%; see Table 4.5).
37 Table 4.5.
Intervention groups by the mode of delivery of supervised sessions
Individual session Group session
Task-oriented group,
number of children; (%) n=3 (33.3) n=6 (66.7)
Strength-oriented group,
number of children; (%) n=4 (44.4) n=5 (55.6)
Changes in task-oriented group included:
During sessions 1-2, the “Circuit” exercise was performed twice; during sessions 3-8 –
three times
During sessions 5-8, the “Rolling a stick” exercise was performed using 1 kg dumbbell During sessions 5-8, the “Agility ladder” exercise was appended with a second round of
running up and down the ladder
In the strength-training group, only one change was made starting week 5, namely, increasing the number of repetitions for each exercise in the second round from 7 to 10.
4.8. HOME EXERCISES AND LOGBOOKS
At the end of each exercise session participants were provided with a home exercise logbook with the description of exercises and smiley faces for children to indicate their level of enjoyment. The researcher demonstrated an exercise and had a child perform it under the researcher’s supervision, who explained the main purposed of the exercise and corrected the
technique of performing the exercise, if needed. It usually took the children 2-3 repetitions to get the exercise right.
At home, the children performed exercises during six consecutive days, excluding the day of the researcher-led exercise session. The guidelines for filling out the logbook were discussed first of all with the child with pointing out that making those records would be their responsibility, followed up by conversations with parents, who were instructed about how they could help, support and encourage their children.
38 the analysis of the logbook data is presented in Figures 4.3. and 4.4., for the task-oriented program and strength training program, respectively. For each exercise, the number of days indicated by children as completed was counted and calculated in percentage. If a child did not attend the supervised exercise session, he/she did not receive instructions regarding the home exercise session and their data were not taken into account in calculating the
compliance rate.
The means and standard deviations were counted for each group. The result of the task-oriented group is M=81.4%; SD =8.2; for the strength training group is M= 73%; SD = 18.3.
Figure 4.3.: Exercise compliance in percentages from week 1 to 8 in the task-oriented group
Figure 4.4.: Exercise compliance in percentages from week 1 to 8 in the strength training
group 76 94 83 72 78 89 72 87 0 20 40 60 80 100 Perc en ta ge Week number
Week 1 Week 2 Week 3 Week 4 Week 5 Week 6 Week 7