Community-Based Priorities for Improving Nutrition
and Physical Activity in Childhood
abstract
Overweight among America’s youth has prompted a large response from foundations, government, and private organizations to support programmatic interventions. The architecture for many of these pro-grams was derived from “experts,” whereas the perspective of fami-lies, and communities—those most affected and most instrumental in altering behavior—is rarely the driving force. Shaping America’s Youth (SAY) was established to assess programs that target nutrition and physical activity and to promote the necessary family and commu-nity input. In a 2004 report, SAY documented how commucommu-nity efforts are motivated, funded, structured, and evaluated. It identified discor-dance between that effort and the opinions of experts. To ensure that the voices of families and communities are integrated into such local and national policies and programs, SAY initiated a unique series of 5-day-long town meetings, input from which was independently statis-tically analyzed. Across a range of demographics, the results indicated that participants perceive the barriers and solutions similarly. There was broad agreement that the family has primary responsibility, start-ing with a need to focus on improved quality and duration of family time directed at nutrition and activity. Concurrently they identified needed actions from external sources, including clear and consistent nutrition information; ready access to healthy foods; and a built environment that promotes physical activity. Rather than one-dimensional or gov-ernmental solutions, they expressed a need for community-based part-nerships integrating health care, education, environment, govern-ment, and business. Although this citizen-engagement process did not identify specific actions, it defined basic steps that communities must integrate into future approaches.Pediatrics2010;126:S73–S89 AUTHORS:David A. McCarron, MD, FACP,a,bNinon
Richartz, MS,aSteve Brigham, MBA,cMolly K. White, MA,a
Stephen P. Klein, PhD,dand Samuel S. Kessel, MD, MPH,
FAAPa,e,f
aMcCarron Group LLC, Portland, Oregon;bDepartment of
Nutrition, University of California, Davis, California;
cAmericaSpeaks, Washington, DC;dGansk & Associates, Santa
Monica, California;eAssistant Surgeon General (Retired), US
Public Health Service, Rockville, Maryland; andfSchool of Public
Health, University of Maryland, College Park, Maryland
KEY WORDS
childhood obesity, child health, citizen priorities, consumer participation, child nutrition, physical activity
ABBREVIATION
SAY—Shaping America’s Youth
Ms Richartz’s current affiliation is Institute for Healthcare Improvement, Cambridge, MA.
www.pediatrics.org/cgi/doi/10.1542/peds.2010-0482C
doi:10.1542/peds.2010-0482C
Accepted for publication Aug 9, 2010
Address correspondence to David A. McCarron, MD, FACP, McCarron Group LLC, 120 NW Ninth Ave, Suite 206, Portland, OR 97209. E-mail: dmccarron@mccarrongroup.com
PEDIATRICS (ISSN Numbers: Print, 0031-4005; Online, 1098-4275).
Copyright © 2010 by the American Academy of Pediatrics
Overweight in childhood has become a major focus of public health efforts in the United States. Numerous studies and reports from experts have pro-vided extensive assessment of the scope of what is recognized as an epi-demic and have produced an array of recommendations on how to improve it. However, despite societal and health professional awareness and concern, there is little evidence of progress in reversing the trend of excess weight among youth.1 Although the most re-cent assessment by the Centers for Disease Control and Prevention re-ported that the prevalence of high BMI in children has remained stable for the past 10 years,2 it has not decreased. The fact remains that nearly one-third of children and adolescents in this country are atⱖ85th percentile of BMI for age. In addition to the long-term consequences that excess weight in childhood imposes on the physical and mental health of the affected individu-als, its impact on future health care costs, productivity, and longevity is profound and likely exceeds that of any health issue the United States has ever confronted.3
The marked increase in the prevalence of childhood obesity over the past 3 de-cades has occurred in parallel with the changing social structure of our nation.1,3 The increasing number of single-parent families and parents working outside the home; changes in dietary practices including what, when, and where we eat; the electronic revolution that has lessened children’s physical activities; the time and budget constraints on our teachers and schools; the wider marketing and avail-ability of foods in general and those of low nutritional value in particular; and changes in our communities, transpor-tation, and the built environment that limit outdoor and leisure-time pursuits have all contributed to the epidemic of childhood obesity.
As a result of concerns in both the pub-lic and private sectors regarding the increase in childhood obesity, the Shaping America’s Youth (SAY) initia-tive was created in 2003 with input from the Office of the US Surgeon Gen-eral, the American Academy of Pediat-rics, and several major corporations (Appendix). SAY was established to as-sess ongoing efforts to reduce excess weight in young people to identify the most effective means of prevention and intervention and of their imple-mentation. SAY’s objectives emerged from the belief that, at its roots, this health crisis is a problem of social norms and behavior that have led to the development of unhealthy nutri-tional and physical activity habits from the earliest years of life. Members of SAY postulated that to be success-ful, recommendations for lifestyle changes must incorporate the input of those who are most pivotal in institut-ing the changes: parents, families, and community members. SAY’s review of the strategies of various expert panels revealed that the voices, opinions, and perspectives of these individuals were seldom considered. We therefore charted 2 initial programmatic compo-nents: (1) a nationwide survey of community-based funding and service programs that target childhood and adolescent nutrition and/or physical activity; and (2) a national citizen-engagement process based on the his-torical precedent of early-American town meetings and updated for the 21st century to gather a cross-section of citizen voices.
The program survey was undertaken as the first step to define America’s ef-fort at the community level (ie, a snap-shot of how motivated organizations and individuals were targeting the problem of overweight youth).4 As a natural extension of the program sur-vey, the town-meeting process was im-plemented as a means to give a voice
to those at the grassroots level to de-termine how the individuals in families and in the community perceive the bar-riers to and solutions for improved nu-trition and physical activity for their children.
Data from the Centers for Disease Con-trol and Prevention strongly indicate that excessive weight is a health con-cern evident from infancy and well es-tablished by the time most children enter school.5 In contrast, evidence gathered in the SAY survey,4which as-certained comprehensive data from 1100 programs, revealed that few were targeting the preschool years or the parents and caregivers who influ-ence early childhood development. For example, lack of family involvement was identified as the largest barrier to success for most programs, yet only 50% of the programs surveyed directly involved the family of the affected child, and⬍10% specifically engaged families. Thus, the collective evidence available by 2005 suggested a critical disconnect between where the empha-sis could do the most good and where it was actually being directed.
The SAY survey also revealed that the majority of ongoing programs lacked the funding, duration, and/or mecha-nisms necessary to document measur-able outcomes, ensure sustainability, and promote collaborations. The limi-tations faced by most of the programs directed at the childhood obesity crisis are particularly concerning in light of the reported $3 to $5 billion that were expended on these programs in 2003– 2005, a figure that is likely to be sub-stantially higher in the future.
pop-ulation makeup. On the basis of the be-lief that families and communities have the greatest influence on and responsibility for children’s develop-ment of healthy behaviors, we sought to engage these individuals in deter-mining the barriers to better nutrition and physical activity and proposing and evaluating possible means of over-coming them. In this report we de-scribe the findings from these town meetings. These findings add an essen-tial element to America’s discussion surrounding how we can most effec-tively meet this public health challenge from the viewpoint of those who are most instrumental in doing so.
METHODS
Community-Perspective Data Collection Using a Town-Meeting Process
SAY issued a nationwide request for proposals to identify an organization with experience in citizen-engagement initiatives that generate usable data for setting public policy. After review-ing 7 proposals, the organization AmericaSpeaks was selected to part-ner with SAY to organize and conduct the town meetings. AmericaSpeaks is a nonpartisan, nonprofit organization founded in 1995 to involve citizens in the public decision-making process by creating an opportunity for them to give their civic leaders direct, substan-tive feedback on key issues.
The concept of involving the general public in health care–related decision-making is being increasingly pro-moted and practiced in various forms.6– 8Focus groups, town meetings, group interviews, and community-based participatory research are all formats for acquiring input from lay people on topics ranging from per-sonal, local health care issues to na-tional health care reform. Although the designs used in each of these formats vary widely, SAY opted to use the 21st
Century Town Meeting model devel-oped by the internationally recognized organization AmericaSpeaks based on its 15 years of experience and proven success in other public policy arenas.9,10
A primary goal of the town-meeting process was to ensure neutrality, fair-ness, and balance in all stages, includ-ing participant recruitment, meetinclud-ing content and presentation, and data analysis. To this end, SAY and Ameri-caSpeaks committed to the following set of core objectives for the develop-ment of an effective citizen dialogue.
Diverse Representation
To ensure that the meeting outcomes represented the views of the entire community, the participants had to re-flect the rich diversity of their region. In each city, a local coalition of orga-nizations hosted the meeting and worked with SAY and AmericaSpeaks to tailor a site-specific recruitment strategy to meet demographic targets (for age, gender, race, etc).
Informed Participation
Meeting participants were provided with (1) a comprehensive 30-page “participant guide” that included de-scriptions of the SAY initiative and town-meeting objectives and factual, objective information about the crisis of excess weight among American youth, and (2) a 4-page “issue over-view” that provided a simplified depic-tion of the primary issues related to childhood obesity. These documents included both national and site-specific data (available as PDF files at www.shapingamericasyouth.org).
Facilitated Deliberation
The town meetings were intended to ensure that every attendee played an active role in the deliberations and that every viewpoint was heard. The meeting agenda and presentation were designed to promote
participa-tion and allow all individuals to openly discuss their ideas and opinions.
Town-Meeting Sites
Five town meetings were held in 2006
and 2007 in Memphis, Tennessee; Dal-las, Texas; Philadelphia, Pennsylvania; Chicago, Illinois; and the state of Iowa. Their selection was based on the pres-ence of a regional coalition or organi-zation committed to the issue of
child-hood obesity, a commitment from regional leadership to support a town meeting, demographic diversity in the area, and the ability to meet an aggres-sive time line. After town meetings in 4 major metropolitan areas, the state of
Iowa was chosen as the fifth meeting site to gather rural input, with Des Moines serving as the host city. Re-quests from a substantial number of additional cities were considered; however, budget and scheduling limi-tations necessitated limiting the initial
round of town meetings to these 5 sites.
Participant Recruitment
At each site, SAY and AmericaSpeaks worked with a local host organization and a local communications firm to de-velop and implement a comprehensive
community-outreach campaign to pro-mote participation in the SAY town meeting. The primary objective of the outreach efforts was to attract an au-dience that was demographically rep-resentative of the entire community in terms of age (ⱖ16 years), gender,
in-come, education, occupation, religion, and racial and ethnic composition. US census data for each site were used to establish outreach targets for each relevant demographic characteristic. The target for desired scale was estab-lished relative to the size of the local
Outreach Strategy Development
The initial step in each city was to con-vene a local host committee. Each city had at least a core coalition of organi-zations working to address childhood obesity. These organizations were the Healthy Memphis Common Table, the Dallas Area Coalition for the Preven-tion of Childhood Obesity, the Child-hood Origins of Disease of AdultChild-hood (CODA) in Philadelphia, the Consortium to Lower Obesity in Chicago Children (CLOCC), and Iowans Fit for Life. The lo-cal coalitions served as the basis to form a more inclusive steering com-mittee and host organization for the town meetings.
The host committees were primarily responsible for providing feedback on outreach strategy and messaging, re-cruiting participants, and developing strategies for acquiring input on lo-cal issues. To recruit the slo-cale and diversity of participants we were seeking, a local communications firm was engaged to drive the partic-ipant recruitment.
The most effective strategy used by the local organizations was direct, face-to-face outreach at community events, conferences, health fairs, and similar gatherings. This strategy was comple-mented by telephone and e-mail out-reach using available lists from mem-bers of the steering committees and other organizations that represent youth, parents, educators, community leaders, and service providers (Appen-dix). Special efforts were also made to recruit local policy-makers to participate.
Demographic information was ac-quired from participants at the time they registered to attend the meetings to determine if demographic diversity targets were being met and to adjust outreach strategies as needed to ensure representative participation. Weekly registration reports (increased
to daily reports in the final 2 weeks before the event) and teleconferences were used to review current registra-tions and discuss recruitment and marketing tactics.
Local marketing of the event through both earned and paid media sup-ported our recruitment activity. Exam-ples of earned media include local tele-vision and radio interviews with SAY’s national leaders and local steering committee members, event announce-ments in regional parenting maga-zines and newsletters, and blog posts on local news and community Web sites. Paid media included drive-time radio advertisements, announce-ments on public radio, and newspaper advertisements.
Town-Meeting Format
SAY and AmericaSpeaks developed a detailed agenda and day-long script that served as the template for all 5 meetings. These were used to track the themes, suggested actions, and rec-ommendations derived from each meeting and to compare them be-tween and across meetings. The meet-ing agenda provided adequate time periods for information-sharing, dis-cussion, and feedback to achieve the desired outcomes and to ensure participants’ continued engagement throughout the day (eg, exercise breaks, quizzes, raffles). The meetings concluded with a site-specific compo-nent in which the local coalition pre-sented its own set of discussion and polling questions directly related to a local agenda, policy, or action plan. As part of the meeting process, the local coalition provided regional data for the participant guide as well as hand-outs and worksheets that focused on a local agenda.
For each meeting, the room was set in round tables that seated 10 partici-pants each. A keypad polling device was provided to each participant for
his or her anonymous and confidential input. A laptop computer was used at each table to instantly transmit the ideas generated at that table to a cen-tral computer. This format ensured that every idea entered into the com-puter became part of the permanent record for the meeting. Two modera-tors from AmericaSpeaks directed all 5 town meetings, which began with in-troductions of the guest speakers and visiting dignitaries, who varied accord-ing to meetaccord-ing but collectively included state governors, city mayors, city and county council members, state and city health commissioners, and the US Sur-geon General and state senators via videotape. The moderators introduced the key data and context surrounding each topic area, explained how the dis-cussion would proceed, and reviewed recommendations after each round of questions.
A trained facilitator worked at each ta-ble to ensure that all individuals were engaged, had a meaningful opportu-nity to participate, and that the group remained on task. Facilitators were re-cruited both from local networks and from the AmericaSpeaks national net-work. In general, we selected people who had table-facilitation experience of at least 2 years in either his or her own professions or outside activities. All facilitators received 2 hours of training before the town meetings dur-ing which the meetdur-ing design was ex-plained and their roles were reviewed. Facilitators were trained to stay neu-tral, to be inclusive, and to help the group look for synergy and common ground. Postmeeting feedback indi-cated that the vast majority of facilita-tors did either a good or excellent and well-balanced job at the tables.
ta-ble’s computer by the group’s desig-nated secretary and submitted to the central servers. Collected comments from each table were categorized into common themes by the “theme team,” a group of local individuals who were selected for their backgrounds related to childhood weight, nutrition, physical activity, communications, and genera-tion of public policy. The team re-viewed the individual comments from the each of the tables, categorized each comment, and then reported the common ideas, or themes, back to the participants via jumbo video screens. After considering the cate-gorical themes that had been identi-fied, participants voted on their key-pads for the theme they thought was most important. Polling results were reported instantly to the entire group on the video screens.
The participants’ vote tally generated a prioritized list of barriers to and steps for improving childhood nutrition and physical activity within each of the family and community elements con-sidered. Each keypad carried a unique identifier so that a participant’s vote could be combined with the demo-graphic information that he or she had entered at the beginning of the meet-ing. Thus, as discussed below, the de-mographic information identified with each keypad was combined with poll-ing data from that keypad for statisti-cal analysis of the data. That analysis permitted the within- and across-sites comparisons necessary to assess the broad applicability of the data.
Town-Meeting Content
At each town meeting, participants dis-cussed the following topics sequentially.
Family Actions
What actions can families take to im-prove nutrition and increase activity among their children? One-third of the room focused on children prenatally and 0- to 5-year-olds, one-third focused
on 6- to 11-year-olds, and one-third fo-cused on 12- to 19-year-olds.
Barriers to Family Actions
What barriers impede actions that families might take? These barriers were discussed according to the 3 age groups listed above.
Supporting Families
In what ways can stakeholder groups support families to positively affect children’s behaviors? Stakeholders were defined as (1) educators and schools, (2) community programs and leaders, (3) members of the health care community, (4) legislators and policy-makers, and (5) corporations and the private sector. The room was divided into 5 equal sections for this discussion, with each section assigned 1 stakeholder group.
Creating Partnerships
How can local stakeholder groups col-laborate on issues of youth overweight to achieve a greater impact than they can achieve individually?
National Actions
What actions can national leaders and organizations take to improve nutri-tion and increase activity among chil-dren? The room was divided again into the same 5 stakeholder groups as for the “supporting families” discussion.
Next Steps/Local Action
In the final stage of the meeting, partic-ipants discussed topics linked to ei-ther developing or providing feedback on a local agenda, policy framework, or action plan.
At the end of the meeting, interested participants were asked to make per-sonal commitments as to what they would do to combat youth obesity. All participants were asked to respond to a series of questions evaluating the meeting. As they exited, each partici-pant received a 4-page summary
re-port that was prepared throughout the day that detailed the meeting content, participant demographics, and the predominant themes and results.
Data Analysis
From the outset, we realized that a statistical analysis of a database of the magnitude we envisioned would present an unprecedented challenge. Specifically, the analysis team was confronted with developing an appro-priate statistical strategy for organiz-ing, summarizorganiz-ing, and examining the data to identify relationships among the tens of thousands of bits of data this scientific process collected. The analysis had to be done in a way that distinguished between potentially im-portant and unimim-portant factors and trends while preserving the unique-ness of the sites and the points of view of different groups of participants.
To meet this challenge, we relied on statistical techniques that allowed us to (1) simultaneously examine and control multiple factors, (2) distin-guish between factors that were found to be empirically important or extrane-ous, and (3) determine if an observed relationship was stronger than what was likely to arise by chance. We also relied on commonly used statistical methods such as multiple linear re-gression, logistic rere-gression, and anal-ysis of variance to reliably identify sim-ilarities and differences among sites and groups. In addition, we recognized that results had to be presented in a way that acknowledged that each site was its own descriptive study rather than an experiment with a control group and therefore observed that relationships were not necessarily causal.
880 Memphis, and 333 Philadelphia participants. These data included age, gender, family income, and racial/eth-nic group. The database also indicated which strategies the participants felt would be most effective for improving nutrition and physical activity to re-duce obesity in children. In addition, the data captured the language fami-lies and community entities used in their discussion or consideration of the issues surrounding childhood obe-sity. Two concurrent data analyses were conducted for reliability, and a deeper look at both suggested activi-ties and ranked prioriactivi-ties: a quantita-tive data analysis of priority polling data based on categorized themes and a qualitative content analysis of raw data gathered from each tables’ col-lective responses.
Polling-Data Analysis
An initial summary multivariate analy-sis of the polling data was performed for the first 4 sites. Each participant provided substantial demographic in-formation through his or her individ-ual handheld keypads used for voting on topic priorities. Thus, it was possi-ble to first determine if, within each city, the priorities varied on the basis of a given population characteristic. That analysis revealed that individual demographic characteristics did not predict the results of the polling within any city.
The relevant questions, similar across sites, covered 3 areas: participant de-mographics; perceptions of the nature of the childhood obesity problem and motivation to improve it; and evalua-tions of the perceived effectiveness of a selected set of stakeholder actions for combating childhood obesity. The evaluation questions addressed the following societal groups whose po-tential action was targeted:
● families with children aged 0 to 5 years;
● families with children aged 6 to 11 years;
● families with children aged 12 to 19 years;
● educators;
● community leaders; ● health care professionals; ● business leaders; and ● legislators and policy-makers. In addition to these societal elements, the evaluation questions incorporated national initiatives.
To examine whether men and women within a site tended to have the same or different preferences for the strat-egies on which they voted, the analysis team constructed a table with 1 row for each of the suggested activities and 1 column for each group. The cells in this table showed the percentage of the group that voted for the activity. Thus, each column summed to 100%. There was a separate table for each of the 4 sites and the targeted societal groups, because the suggested ac-tions at 1 site were not necessarily the same as those suggested at other sites or not expressed in exactly the same way.
For the first 4 cities, the analysis re-quired the construction of 36 tables for gender and another 36 for race, for a total of 72 data matrices. The corre-lation coefficient between men and women was used as a measure of the degree to which they agreed with each other regarding the likely relative ef-fectiveness of the different strategies. Coefficient␣was used to obtain a com-parable measure of agreement among racial groups. For both of these indi-ces, the higher the value, the greater the consistency in the preferences of the groups being compared. Values over 0.85 indicate a high degree of agreement.
The correlation analyses were run sep-arately according to site, because the
categorized themes of suggested activ-ities varied somewhat across sites. To address this feature of the data and allow for more in-depth analyses, SAY staff unified the suggestions from the different sites into a common set appli-cable to all sites. The resulting cross-walk between this staff-developed common set of suggestions and the site-specific set was used to create a database that contained each partici-pant’s first choice of the possible ac-tions listed in the common set for a given societal group. This database also contained the participant’s demo-graphic characteristics. This exercise resulted in identifying 51 actions com-mon to at least 2 sites, 23 of which were common to all 4 sites.
Separate multivariate logistic regres-sion models were computed for each of the 51 actions. The outcome variable in each model was whether the action was the participant’s first choice (coded 1 or 0, respectively). The inde-pendent variables were race, site, gen-der, age, and income level. For race, “dummy” variables were used to clas-sify a respondent as black, white, or Hispanic. The reference group was “all others” (most of whom did not indicate their race). Chicago was the reference-group site for all the models except when the action was not an option identified in the Chicago data set.
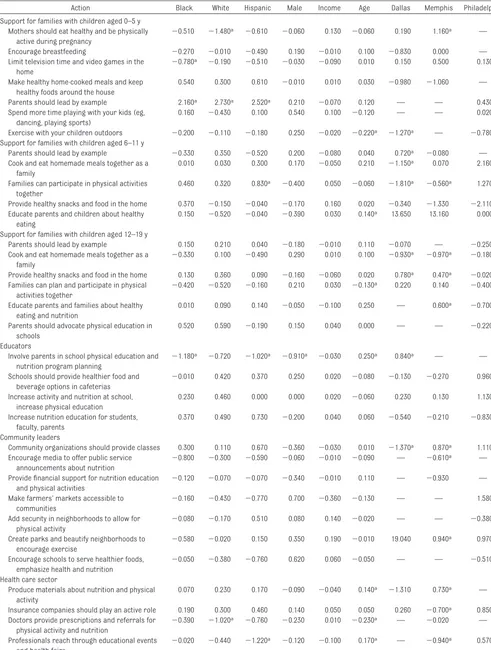
The size and algebraic sign of the coef-ficients in these models indicate the degree to which a participant’s race, gender, age, income level, or site were related to whether participants did or did not prefer a given action. A statis-tically significant coefficient indicates that the groups differed more in their preferences than was likely to arise by chance alone. Because of missing-data problems, noted below, only 45 of the 51 models could be estimated.
that of the first 4 sites. Rather than re-peating the polling analysis, which had already statistically established the relative uniformity across numerous demographic variables in the first 4 sites, the analysis used the content analysis of all 5 sites to determine if the state of Iowa differed in its priori-ties from Memphis, Dallas, Philadel-phia, and Chicago.
Content Analysis
The multivariate analysis revealed that the barriers identified and the solu-tions proposed from 4 distinct venues were generalizable to the US popula-tion, a finding that supported the pool-ing of theⱖ14 000 inputs entered from table discussions at the 5 sites in re-sponse to the comparable questions posed at each venue. The pooling of re-sponses allowed for a formal content analysis of all the comments that were provided.
In analyzing and summarizing partici-pants’ responses, the analytical team first reviewed the responses and the summary themes for each question to develop an initial framework for cod-ing the individual responses included in each of the meeting transcripts. Us-ing this initial codUs-ing scheme, the team reviewed each response recorded in the meeting transcripts to assign it to the appropriate category. This process generally identified other common cat-egories of responses, which then were incorporated into the scheme to con-tinue the coding process. In the course of coding the responses to individual questions, a minority of responses were either not decipherable or did not seem to be related to the question that had been posed. In some in-stances a single response incorpo-rated more than 1 idea and, therefore, could be coded into more than 1 cate-gory. In these cases, multiple codes were assigned to the same response. In summarizing the data, the analytical
team calculated the total number of re-sponses in each category divided by the total number of responses re-corded to that question to define the percentage of responses in each cate-gory. This process allowed us to calcu-late the rank order of the responses fitting a defined category for a re-sponse to each question posed at each site.
RESULTS
The magnitude of this data set is such that only selected tables are included in this publication. The analysis of the full data set, tables generated, and all 14 000⫹primary responses from each meeting table are available online at www.shapingamericasyouth.org.
Participants
Demographic characteristics and com-munity roles of the participants at each site are shown in Tables 1 and 2. Although there was substantial vari-ability for selected characteristics be-tween sites, we were able to account for them by using an analytical ap-proach. The demographics of the par-ticipants adequately reflected several of the known variables associated with excess weight in children. In general, the participants in each city were
rea-sonably representative of the metro-politan area; for each case in which there was overrepresentation of a de-mographic group, it tended to favor factors associated with an increased risk for excess weight. Thus, the partic-ipants represented a good cross-section of that portion of the US popu-lation for whom solving this health crisis is particularly important. As noted in Table 2, there was significant representation from adolescents and young adults, aged 15 to 21, for whom the challenge of weight control has even greater immediacy. Their input was particularly valuable in consider-ing the effectiveness of current school-based initiatives. Many of the partici-pants identified with more than 1 role in the community; thus, the total per-centages exceed 100.
Polling Data
Table 3 depicts the gender and race coefficients that were generated by the multivariate analysis of the polling data. Notable are the unusually high coefficients among the different gen-der and racial groups in all 9 targeted societal groups at each site. The major exception to this trend was at Philadel-phia, where there were noticeable
TABLE 1 Demographic Characteristics According to Meeting Site
Memphis, % Dallas, % Philadelphia, % Chicago, % Iowa, %
⬍35 y old 46 38 53 55 35
Less than $50 000/y income 25 47 43 42 29
Male 28 22 35 28 27
White 31 48 25 13 86
Black 57 27 60 54 7
Hispanic 4 37 7 29 2
TABLE 2 Participants’ Community Roles
Memphis, % Dallas, % Philadelphia, % Chicago, % Iowa, %
Youth (15–21 y) 33 21 26 35 4
Parent/guardian 43 53 21 19 29
Educator 30 26 15 15 21
Community leader/service provider 29 22 20 15 20
Business leader/private sector 16 18 7 5 9
Health care provider 22 25 11 11 14
disagreements (much lower coeffi-cients), especially among gender groups in several polls that targeted specific societal groups.
Table 4 shows the coefficients in the 45 models that could be estimated. For ex-ample, the first row of this table indi-cates that after holding the other vari-ables in the model constant, Memphis participants were more likely than Chi-cago participants to select “Mothers should eat healthy and be physically active during pregnancy” as their top choice for families with 0- to 5-year-old children, whereas white participants (regardless of site) were statistically significantly less likely to select this option relative to the reference group of participants (ie, those who did not identify themselves as white, black, or Hispanic).
Slightly fewer than 50 of the nearly 400 coefficients in Table 3 were statisti-cally significant, but⬃20 would be sig-nificant by chance alone. Thus, taken as a whole, the participants’
back-ground characteristics were generally not systematically related to their pre-ferred actions. However, a dispropor-tionately large number of the signifi-cant coefficients were related to site differences, whereas there was only 1 significant coefficient in the gender column and none in the income col-umn. Viewed collectively, these find-ings indicate that location was gener-ally more closely related to the participants’ preferred actions than was their race, gender, or income.
The Iowa site was added to the project in 2007. Some of the scripted queries at this site differed slightly from those used at the other sites. Although iden-tical scripts were used at all sites re-garding barriers and solutions for family action, Iowa participants ad-dressed a new series of questions, “stakeholder actions in support of families,” that were identified in the analysis of the initial 4 sites. Under each general stakeholder action, par-ticipants were provided 3 to 4 specific,
theoretical examples of an action that a stakeholder might take. Participants evaluated the examples or proposed alternative actions they deemed more likely to be effective in supporting the family unit. This modification in the day-long script for Iowa was substi-tuted for the open-ended discussion of stakeholder actions used in the earlier town meetings. The discussion regard-ing “creatregard-ing partnerships” was elimi-nated from the Iowa meeting to pro-vide additional time for discussion of specific actions by stakeholder groups.
This adjustment in the second half of the Iowa town-meeting format and script was made to assess whether it was feasible to engage the partici-pants over a more specific or detailed list of theoretical actions by stakehold-ers. This was done in anticipation of such a line of engagement being used in a new round of town meetings. Spe-cifically, the putative second round of national town meetings would target the identification of specific action steps for the families and their com-munities to take that would be deemed responsive to the general action con-cepts identified in SAY’s initial round of national town meetings. When the Des Moines script was identical to that of the other 4 sites, the data generated were incorporated in the overall anal-ysis of “family actions and national actions.”
Content Analysis
Table 5 summarizes the data regard-ing the number of suggestions per site about “barriers to family action” as they relate to nutrition and physical ac-tivity. In this table and Tables 6 through 9, “n” indicates the number of sugges-tions that were made at each site in response to each of the open-ended questions posed to the participants. In each cell of Table 5 the percentage of those suggestions that relate to the 4
TABLE 3 Race and Gender␣Correlation Coefficients
Memphis Dallas Philadelphia Chicago Average
Race
Family actions
0–5 y 0.80 0.64 0.87 0.94 0.81
6–11 y 0.85 0.95 0.99 0.79 0.89
12–19 y 0.94 0.94 0.66 0.92 0.86
Stakeholder actions
Educators/schools 0.96 0.96 0.59 0.92 0.86
Community leaders/service providers 0.93 0.96 0.68 0.83
Health care community 0.72 0.95 0.86 0.96 0.87
Business/private sector 0.88 0.98 0.70 0.86 0.86 Legislators/policy-makers 0.93 0.99 0.59 0.91 0.86
National actions 0.95 0.97 0.50 0.98 0.85
Average 0.88 0.93 0.72 0.89 0.86
Gender Family actions
0–5 y 0.85 0.86 0.81 0.88 0.85
6–11 y 0.89 0.91 0.81 0.57 0.80
12–19 y 0.89 0.43 ⫺0.22 0.82 0.48
Stakeholder actions
Educators/schools 0.93 0.78 0.32 0.57 0.65
Community leaders/service providers 0.73 0.92 0.13 0.64 0.60
Health care community 0.97 0.85 0.89 0.97 0.92
Business/private sector 0.88 0.98 0.83 0.76 0.86 Legislators/policy-makers 0.98 0.97 0.68 0.98 0.90
National actions 0.94 0.97 0.31 0.96 0.79
TABLE 4 Correlation Coefficients for the 45 Barriers to Improvement Based on Participant Responses
Action Black White Hispanic Male Income Age Dallas Memphis Philadelphia
Support for families with children aged 0–5 y Mothers should eat healthy and be physically
active during pregnancy
⫺0.510 ⫺1.480a ⫺0.610 ⫺0.060 0.130 ⫺0.060 0.190 1.160a —
Encourage breastfeeding ⫺0.270 ⫺0.010 ⫺0.490 0.190 ⫺0.010 0.100 ⫺0.830 0.000 — Limit television time and video games in the
home
⫺0.780a ⫺0.190 ⫺0.510 ⫺0.030 ⫺0.090 0.010 0.150 0.500 0.130
Make healthy home-cooked meals and keep healthy foods around the house
0.540 0.300 0.610 ⫺0.010 0.010 0.030 ⫺0.980 ⫺1.060 —
Parents should lead by example 2.160a 2.730a 2.520a 0.210 ⫺0.070 0.120 — — 0.430
Spend more time playing with your kids (eg, dancing, playing sports)
0.160 ⫺0.430 0.100 0.540 0.100 ⫺0.120 — — 0.020
Exercise with your children outdoors ⫺0.200 ⫺0.110 ⫺0.180 0.250 ⫺0.020 ⫺0.220a ⫺1.270a — ⫺0.780a
Support for families with children aged 6–11 y
Parents should lead by example ⫺0.330 0.350 ⫺0.520 0.200 ⫺0.080 0.040 0.720a ⫺0.080 —
Cook and eat homemade meals together as a family
0.010 0.030 0.300 0.170 ⫺0.050 0.210 ⫺1.150a 0.070 2.160
Families can participate in physical activities together
0.460 0.320 0.830a ⫺0.400 0.050 ⫺0.060 ⫺1.810a ⫺0.560a 1.270
Provide healthy snacks and food in the home 0.370 ⫺0.150 ⫺0.040 ⫺0.170 0.160 0.020 ⫺0.340 ⫺1.330 ⫺2.110a
Educate parents and children about healthy eating
0.150 ⫺0.520 ⫺0.040 ⫺0.390 0.030 0.140a 13.650 13.160 0.000
Support for families with children aged 12–19 y
Parents should lead by example 0.150 0.210 0.040 ⫺0.180 ⫺0.010 0.110 ⫺0.070 — ⫺0.250 Cook and eat homemade meals together as a
family
⫺0.330 0.100 ⫺0.490 0.290 0.010 0.100 ⫺0.930a ⫺0.970a ⫺0.180
Provide healthy snacks and food in the home 0.130 0.360 0.090 ⫺0.160 ⫺0.060 0.020 0.780a 0.470a ⫺0.020
Families can plan and participate in physical activities together
⫺0.420 ⫺0.520 ⫺0.160 0.210 0.030 ⫺0.130a 0.220 0.140 ⫺0.400
Educate parents and families about healthy eating and nutrition
0.010 0.090 0.140 ⫺0.050 ⫺0.100 0.250 — 0.600a ⫺0.700
Parents should advocate physical education in schools
0.520 0.590 ⫺0.190 0.150 0.040 0.000 — — ⫺0.220
Educators
Involve parents in school physical education and nutrition program planning
⫺1.180a ⫺0.720 ⫺1.020a ⫺0.910a ⫺0.030 0.250a 0.840a — —
Schools should provide healthier food and beverage options in cafeterias
⫺0.010 0.420 0.370 0.250 0.020 ⫺0.080 ⫺0.130 ⫺0.270 0.960a
Increase activity and nutrition at school, increase physical education
0.230 0.460 0.000 0.000 0.020 ⫺0.060 0.230 0.130 1.130
Increase nutrition education for students, faculty, parents
0.370 0.490 0.730 ⫺0.200 0.040 0.060 ⫺0.540 ⫺0.210 ⫺0.830a
Community leaders
Community organizations should provide classes 0.300 0.110 0.670 ⫺0.360 ⫺0.030 0.010 ⫺1.370a 0.870a 1.110a
Encourage media to offer public service announcements about nutrition
⫺0.800 ⫺0.300 ⫺0.590 ⫺0.060 ⫺0.010 ⫺0.090 — ⫺0.610a —
Provide financial support for nutrition education and physical activities
⫺0.120 ⫺0.070 ⫺0.070 ⫺0.340 ⫺0.010 0.110 — ⫺0.930 —
Make farmers’ markets accessible to communities
⫺0.160 ⫺0.430 ⫺0.770 0.700 ⫺0.360 ⫺0.130 — — 1.580a
Add security in neighborhoods to allow for physical activity
⫺0.080 ⫺0.170 0.510 0.080 0.140 ⫺0.020 — — ⫺0.380
Create parks and beautify neighborhoods to encourage exercise
⫺0.580 ⫺0.020 0.150 0.350 0.190 ⫺0.010 19.040 0.940a 0.970a
Encourage schools to serve healthier foods, emphasize health and nutrition
⫺0.050 ⫺0.380 ⫺0.760 0.620 0.060 ⫺0.050 — — ⫺0.510
Health care sector
Produce materials about nutrition and physical activity
0.070 0.230 0.170 ⫺0.090 ⫺0.040 0.140a ⫺1.310 0.730a —
Insurance companies should play an active role 0.190 0.300 0.460 0.140 0.050 0.050 0.260 ⫺0.700a 0.850a
Doctors provide prescriptions and referrals for physical activity and nutrition
⫺0.390 ⫺1.020a ⫺0.760 ⫺0.230 0.010 ⫺0.230a — ⫺0.020 —
Professionals reach through educational events and health fairs
most prevalent suggestions is re-corded. What is evident in Table 5 and follows through in Tables 6 through 9 is the consistency of the rank order across the top 4 suggestions of the critical barriers that were identified at the 5 sites despite the diversity of par-ticipants that each town meeting included.
Table 6 provides similar data about the number of suggestions per site about “family actions” that can be made to improve nutrition and physical activity for each of the 4 target age groups. Once again this table shows the num-ber of suggestions that were made, and the cells show the percentage of those suggestions that relate to the 4 most common types of suggestions. For example, Table 6 shows that, as a group, the Memphis participants made 238 suggestions regarding how families can improve nutrition for 0- to 5-year-old children, and 28% of those involved families providing healthy
snacks and meals. Table 7 provides a comparable presentation of the data regarding “stakeholder support of family actions” as was presented in Ta-bles 5 and 6. The top 4 actions for stakeholders to take are again pro-vided. As in Tables 5 and 6, the consis-tency of the rank order of the percent-age that a given suggestion was noted across the 5 sites is evident. This set of questions was not presented at the Iowa meeting.
Table 8 summarizes the national ac-tions that stakeholders might take to improve nutrition and physical activity. The format is identical to that of Tables 5 through 7 except that in Memphis and Dallas the question was posed separately for nutrition and for physi-cal activity but combined as 1 question for the other sites. Once again the rank order and percentages are remark-ably consistent across the different regional sites and their respective participants.
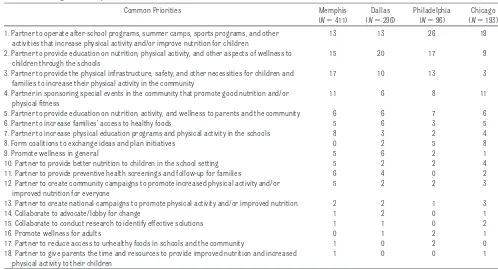
Table 9 summarizes the “creating part-nerships” recommendations from the first 4 sites. The Iowa state-wide town meeting was not queried on this point. More than the top 4 categories are pre-sented, in part, to document that a number of national partnership con-cepts that have been frequently touted in the past had little or no support from these participants. Once again, however, there was good agreement on the top 4 partnerships and some support for the next 6, although mini-mal in most instances.
The data in Tables 5, 6, and 8 suggest that the Iowa participants demon-strated good agreement with the par-ticipants at the other sites regarding which strategies would work best. Specifically, the rank ordering of their 4 most common suggestions in each set tended to coincide with the rank ordering of the most popular sugges-tions in that set at the other sites. This finding was consistent with the
find-TABLE 4 Continued
Action Black White Hispanic Male Income Age Dallas Memphis Philadelphia
Businesses
Provide preventive benefits for employees through policies, incentives
0.300 0.510 0.050 0.020 ⫺0.010 0.050 ⫺0.930 1.050 ⫺0.710
Sponsor, support, or donate to community health programs and events
⫺0.360 ⫺0.400 ⫺0.240 ⫺0.100 ⫺0.090 ⫺0.010 1.160 ⫺0.770 0.610
Offer and promote healthy food options on television and at restaurants
0.440 0.480 0.570 0.430 0.030 0.010 ⫺1.460 — —
Be responsible when advertising to children (limited yet truthful advertisements)
0.910 0.740 0.410 ⫺0.390 0.080 0.120 — ⫺1.110 —
Legislators
Mandate and increase funding to improve nutrition and physical education in schools
⫺0.040 0.390 ⫺0.260 ⫺0.180 0.060 0.070 0.760 0.980 0.050
Make healthy food more affordable and accessible through subsidy
0.220 ⫺0.220 0.140 0.040 0.020 ⫺0.110 ⫺0.160 — ⫺0.460
Plan and build safer communities that support physical activity
0.280 0.170 0.500 0.310 ⫺0.030 ⫺0.040 — ⫺0.520 0.340
Provide and fund facilities for outdoor activities 0.170 0.810 0.660 0.540 ⫺0.200 0.040 ⫺2.100 — — Increase funding for physical activity and
nutrition education programs
0.170 0.650 0.890 ⫺0.410 0.070 0.030 — — ⫺1.130
National agenda
Develop, fund, and require national standards for school nutrition and physical education
⫺0.500 ⫺0.060 ⫺0.640 0.140 0.010 ⫺0.040 0.720 — —
Encourage collaboration between legislators, businesses, and educators to promote and fund nutrition and fitness initiatives
⫺0.200 0.240 0.040 ⫺0.150 ⫺0.030 0.000 ⫺1.380 ⫺0.400 ⫺1.080
Create a national marketing and education campaign for nutrition and physical activity
⫺0.040 ⫺0.400 0.080 0.190 ⫺0.070 ⫺0.050 — ⫺1.510 16.390
ings of the initial data analysis that across various demographic and re-gional factors, the town meetings identified a common set of barriers to and actions for improving nutri-tion and physical activity among chil-dren and adolescents in America.
Limitations
The data presented here are descrip-tive of the views expressed by town-meeting participants during their de-liberations with their tablemates and through the votes they cast via their polling devices. These participants are best characterized as a convenience sample of teenagers and adults who are sufficiently interested in the prob-lem of childhood obesity to devote a full day to discussing its resolution.
There may be subtle factors at work that could affect and homogenize the participants’ suggestions, such as
what the session leaders said about the problem before the participants discussed and voted or how the theme team’s list of suggestions may have been influenced by the views of the ta-ble recorders and team members through whom all the suggestions were filtered, translated, and ex-pressed. Moreover, there were no in-dependent checks on the consistency of how table recorders or theme team members worded the participants’ suggestions or how their personal views may have seeped into the items on which the participants ultimately voted.
Missing data must also be considered. For example,⬃3% of the participants did not report their gender, race, age, or income. In addition, the number of participants who cast a vote varied across the different polls, with more attrition as the day wore on.
Neverthe-less, the generally high degree of agreement among participants re-gardless of site and background char-acteristics indicates that the views they expressed are applicable to the US population in general. Finally, the relative popularity of a suggestion may not be related to its effectiveness in reducing the childhood obesity prob-lem. That could only be determined by outcome measures of any intervention that a community or element of a com-munity might elect to institute.
Participants’ Assessment of the Town-Meeting Process
At the conclusion of the meeting, par-ticipants were asked several ques-tions to assess the quality of the meet-ing (Table 10) and whether they thought it would lead to change in the community. Their response to the lat-ter was compared with a similar query
TABLE 5 Barriers to Family Actions
Common Priorities (Top 4 per Category) Memphis Dallas Philadelphia Chicago Iowa
What barriers prevent families from improving nutrition in children aged 0–5 y?n 219 153 76 152 78 1. Parents lack information or knowledge about healthy foods and eating habits, % 32 29 32 22 28
2. Time constraints and other stresses that affect parents, % 20 29 24 20 26
3. Higher costs of healthy food, % 20 16 21 20 23
4. Healthy food is not readily available in many neighborhoods, % 8 12 21 13 6 What barriers prevent families from increasing physical activity in children aged 0–5 y?n 225 122 63 131 80 1. Lack of access to safe and/or appropriate places to be active, % 19 36 30 33 33
2. Time constraints and other stresses that affect parents, % 24 26 17 19 26
3. Parents lack motivation or parenting skills, % 15 11 22 27 13
4. Parents lack awareness and/or knowledge about physical activity, % 12 8 10 18 19 What barriers prevent families from improving nutrition in children aged 6–11 y?n 266 211 43 134 78
1. Stresses and time constraints that affect parents, % 21 21 30 19 17
2. Parents lack knowledge or awareness, % 19 25 19 20 17
3. Lack of parenting skills or motivation on part of parents, % 20 19 16 24 18
4. Higher costs of healthy food, % 16 21 21 19 19
What barriers prevent families from increasing physical activity in children aged 6–11 y?n 157 152 37 130 68 1. Lack of access to safe and appropriate places to be physically active, % 22 27 41 25 40
2. Stresses and time constraints of parents, % 30 26 35 20 18
3. Lack of parenting skills or parental motivation, % 15 20 11 27 10
4. Cost of programs and activities, % 12 11 11 18 10
What barriers prevent families from increasing nutrition in children aged 12–19 y?n 213 111 73 98 68 1. Stresses and time constraints that affect parents and older children, % 19 20 22 23 40
2. Lack of knowledge or awareness of proper nutrition, % 15 18 21 20 18
3. Higher costs of healthy food, % 16 8 23 24 15
4. Peer pressure and developmental tendencies, % 7 11 27 19 13
What barriers prevent families from increasing physical activity in children aged 12–19 y?n 158 98 59 100 69 1. Stresses and time constraints that affect families and teenagers, % 22 16 41 22 25 2. Lack of accessible resources or options for physical activity, % 13 9 17 27 19
3. Safety concerns, % 4 7 19 29 10
4. Competition from television, video games, and other technology, % 4 17 22 12 7
to the audience at the beginning of the meeting. At the end, there was a con-sistent and substantial increase in the number of respondents who stated that they were more optimistic that there would be positive change in their community as a result of the meeting. When asked to rate the overall quality of the meetings, ⬎92% at all sites graded the meeting as either “good” or “excellent.”
DISCUSSION
Citizens’ Perception of the Childhood Obesity Crisis
Several important general insights emerged from this effort that should not be lost in the mass of data that were accumulated. First, through their responses participants indicated that they clearly understand that America’s
youth are at serious risk from poor nu-trition and insufficient physical activ-ity. Second, their responses main-tained a positive tone, avoiding a simplistic focus on outside sources as the cause of the childhood weight cri-sis. Third, their recommendations indi-cated that they understood that solu-tions need to focus on the family and elements of the community in which they reside (ie, solutions rest largely with the family with support from the community to act successfully). Fourth, consistent with the previous point, they did not perceive that a uni-versal approach conceived and imple-mented by government or some other larger element(s) of society was criti-cal to reversal of this crisis. They rec-ognized, however, that there were steps that could be taken at national
or regional levels to facilitate the success of family and community ef-forts. Fifth, by their responses to the queries regarding families with chil-dren 0 to 5 years old, they acknowl-edged the long-term importance of the earliest years in the life of a child, including pregnancy and in-fancy, in developing habits that pro-mote healthy weight.
Family and Community Priorities
The summary tables (Tables 5–9) of the content analysis demonstrate where the priorities for families and communities lie. Perhaps obvious, but nevertheless important to note, the participants view the family’s role as primary and see the school setting, where their children spend the major-ity of their out-of-home time, as the
TABLE 6 Family Actions/Solutions
Common Priorities (Top 4 per Category) Memphis Dallas Philadelphia Chicago Iowa
How can families improve nutrition in children aged 0–5 y ?n 238 226 85 135 42
1. Families need to provide healthy snacks and meals, % 28 31 42 38 10
2. Families need to create and reinforce good eating behaviors, % 15 16 25 26 29 3. Pregnant women need to learn about and practice good nutrition, % 14 10 13 10 14 4. Parents need to serve as positive role models in their own eating behaviors and choices, % 11 10 10 7 17 How can families improve physical activity in children aged 0–5 y?n 174 156 51 91 35 1. Families need to provide children with opportunities for physical activity, % 37 56 75 65 57 2. Families need to engage in fun physical activities together, % 44 35 43 29 34
3. Parents need to limit television and computer time, % 20 10 12 9 20
4. Parents need to serve as positive role models by being physically active themselves, % 9 7 12 5 14 How can families improve nutrition in children aged 6–11 y ?n 269 254 51 127 50
1. Families need to provide healthy snacks and meals, % 42 35 32 29 36
2. Meal planning, shopping, and eating should be family activities, % 18 13 22 11 30
3. Parents need to prohibit or restrict unhealthy foods, % 17 13 16 24 16
4. Families need to enforce good eating behavior patterns, % 18 14 12 16 22
How can families improve physical activity in children aged 6–11 y?n 200 210 47 94 49 1. Families need to promote and engage in physical activities as a family, % 33 35 61 50 49 2. Families need to involve and support children in organized physical activity (eg, sports, dance,
swimming, and after-school programs), %
15 15 15 26 10
3. Families need to encourage children to be physically active on their own, % 11 9 6 16 12 4. Parents need to create and/or provide children with opportunities for physical activity, % 13 10 13 12 16 How can families improve nutrition in children aged 12–19 y?n 169 145 62 113 55 1. Parents need to plan for and provide healthy snacks and meals, % 49 53 27 50 38 2. Meal planning, shopping, preparation, and eating should be shared family activities that reinforce
good nutritional choices, %
26 23 21 20 49
3. Parents need to educate their children about nutrition and how to prepare nutritious food, % 12 18 15 22 13 4. Families need to create and reinforce healthy eating habits, % 17 18 9 9 20 How can families improve physical activity in children aged 12–19 y?n 153 127 54 64 55 1. Promote and engage in physical activities as a family, including active games, exercise, and chores, % 48 28 74 55 44 2. Encourage children to engage in physical activities on their own, % 14 17 15 28 13 3. Encourage and support children’s participation in organized programs that involve physical activity, % 22 12 17 19 9 4. Limit the time that children spend watching television, at the computer, playing video games, etc, % 12 9 11 17 15
secondary area for improvement. Two core issues run through the character-ization of the barriers and solutions for the family to improve both the nu-trition and physical activity of their
children. One issue is time. Time pres-sures dominated the participants’ characterization of the family’s inabil-ity to ensure healthy eating and physi-cal activity. The second issue is access,
specifically access to effective nutri-tion information/education, afford-able, nutritious food, and a built envi-ronment that promotes families’ efforts to be physically active.
TABLE 7 Stakeholder Support of Family Actions
Common Priorities (Top 4 per Category) Memphis Dallas Philadelphia Chicago
How can educators/schools support family actions to improve childhood nutrition?n 200 97 56 119 1. Provide healthier choices in the meals and snacks available at school, % 38 38 52 29
2. Provide nutrition education to students, % 30 37 38 36
3. Promote good nutrition as a part of the school’s culture, % 29 33 29 33
4. Partner with and involve parents, % 15 12 18 12
How can educators/schools support family actions to improve childhood physical activity?n 154 89 36 69 1. Incorporate and support physical activity during the school day, % 23 40 42 38 2. Promote physical activity and wellness as a school priority, % 23 33 42 41
3. Strengthen physical education programs in schools, % 40 38 19 22
4. Provide increased access to extracurricular programs that involve physical activity, including sports and recreational programs, %
14 28 33 16
How can community leaders/service providers support family actions to improve childhood nutrition?n 90 149 55 62 1. Educate and support efforts to educate the community about good nutrition, % 36 59 47 47
2. Increase the local community’s access to good nutrition, % 32 17 32 29
3. Provide leadership and positive role models, % 4 13 13 32
4. Lobby/advocate with other stakeholders, % 14 15 9 15
How can community leaders/service providers support family actions to improve childhood physical activity?n
93 105 53 47
1. Expand and enhance community spaces and opportunities for physical activity, % 30 29 40 28 2. Provide free or low-cost sports and recreational programs for children and youth, % 28 33 26 26 3. Promote awareness of options and opportunities for physical activity, % 15 20 15 28 4. Provide leadership and organize the community to address the issue, % 20 6 17 30 How can businesses/the private sector support family actions to improve childhood nutrition?n 164 110 37 86 1. Businesses directly involved with the production and/or distribution of food should focus on providing
healthy foods, %
32 24 35 32
2. Businesses should support programs/initiatives that address children’s nutrition, % 15 30 28 33 3. Businesses should promote good nutrition among their employees, % 24 21 11 11
4. The advertising industry should promote good nutrition, % 14 18 20 13
How can businesses/the private sector support family actions to improve childhood physical activity?n 125 90 26 53 1. Support programs, initiatives, organizations, and facilities that support physical activity among children, % 29 44 54 51
2. Promote physical activity and wellness among employees, % 40 30 27 28
3. Promote physical activity through their products, services, and facilities, % 3 14 15 13 4. Businesses should promote physical activity and healthy living through the media, % 9 11 12 4 How can the health care community support family actions to improve childhood nutrition?n 161 149 26 73
1. Integrate nutrition into health care delivery and services, % 42 38 62 38
2. Provide nutritional education that is accessible to families, % 40 34 54 27
3. Promote good nutrition in the community, % 13 15 35 15
4. Insurers need to support good nutrition, % 8 5 27 6
How can the health care community support family actions to improve childhood physical activity?n 83 94 21 41 1. Integrate emphasis on wellness and physical activity into the delivery of health care, % 30 26 31 33 2. Provide accessible education on the importance of physical activity, % 23 34 24 36 3. Create, provide, and/or financially support more wellness programs, % 13 31 34 20 4. Promote availability and awareness of programs and facilities that support physical activity, % 12 13 14 16 How can legislators/policy-makers support family actions to improve childhood nutrition?n 110 53 28 79 1. Implement good nutrition and nutrition education in the schools, % 40 32 39 28 2. Pass legislation to provide families greater access to affordable healthy foods, % 33 26 21 42
3. Provide leadership on improving nutrition for children, % 20 25 43 32
4. Regulate unhealthy foods, % 9 8 4 15
How can legislators/policy-makers support family actions to improve childhood physical activity?n 91 34 22 57 1. Increase and improve access to community centers, parks, and other infrastructure supporting physical
activity in the community, %
34 38 64 47
2. Support physical activity in the schools, % 46 32 36 30
3. Provide incentives for and otherwise support family physical activity, % 15 18 23 14
4. Provide leadership on the issue, % 5 6 0 14
TABLE 8 National Actions
Common Priorities (Top 4 per Category) Memphis Dallas Philadelphia Chicago Iowa
How can educators/schools improve childhood nutrition and increase physical activity at the national level?n — — 67 108 46 1. Create policies, mandates, or guidelines to improve nutrition and increase physical activity through the
schools, %
— — 22 32 43
2. Provide financial and other resources to support wellness programs in the schools, % — — 18 18 30
3. Deliver programs in the schools that support wellness, % — — 27 12 11
4. Create and implement a national campaign, % — — 12 6 7
How can educators/schools improve childhood nutrition at the national level?n 65 26 — — —
1. Ensure good nutrition in the schools, % 35 46 — — —
2. Ensure that nutrition education is provided through the schools, % 17 5 — — —
3. Provide leadership on the issue, % 13 18 — — —
4. Create national campaigns focused on good nutrition, % 9 5 — — —
How can educators/schools increase childhood physical activity at the national level?n 52 25 — — — 1. Support and enhance physical education and physical activity in schools, % 48 48 — — —
2. Mandate physical education in the schools, % 21 56 — — —
3. Provide leadership on the issue, % 10 12 — — —
4. Create national campaigns to promote physical activity, % 10 0 — — —
How can community leaders/service providers improve childhood nutrition and increase physical activity at the national level?n
— — 54 58 35
1. Provide financial and other resources to support wellness in the community, % — — 26 31 40
2. Create and implement educational campaigns, % — — 28 34 9
3. Adopt policies, regulations, and/or mandates to improve nutrition and increase physical activity in the community, %
— — 7 12 26
4. Sponsor and/or deliver programs that support wellness, % — — 19 9 14
How can community leaders/service providers improve childhood nutrition at the national level?n 55 75 — — — 1. Sponsor/create campaigns to inform the public about nutrition, % 25 33 — — —
2. Create and implement policies and regulations, % 25 11 — — —
3. Provide nutrition education to families, % 25 5 — — —
4. Provide money and resources to local communities to address the issue, % 7 16 — — — How can community leaders/service providers increase childhood physical activity at the national level?n 31 47 — — —
1. Sponsor/create campaigns to promote physical activity, % 39 17 — — —
2. Provide money, resources, and infrastructure to local communities to promote physical activity, % 16 15 — — — 3. Implement policies and regulations that promote physical activity, % 19 13 — — —
4. Educate the public about physical activity, % 16 4 — — —
How can businesses/the private sector improve childhood nutrition and increase physical activity at the national level?n
— — 76 76 19
1. Promote wellness through the products and services produced, delivered, and marketed to the public, % — — 45 44 32 2. Businesses should advocate and lobby for wellness with the government, % — — 7 7 16 3. Support programs, initiatives, organizations, and community facilities that promote wellness, % — — 18 17 21 4. Expand health insurance coverage and use it to promote wellness, % — — 5 4 5 How can the business/private sector improve childhood nutrition at the national level?n 87 71 — — — 1. Businesses that produce and/or distribute food should focus on providing quality healthy foods at
affordable prices to all communities, %
25 18 — — —
2. Businesses should inform and educate consumers about nutrition, % 10 21 — — — 3. Businesses should support programs and initiatives that address the nutrition of children, % 18 13 — — — 4. Businesses should promote good nutrition among their employees, % 17 10 — — — How can businesses/the private sector increase childhood physical activity at the national level?n 67 34 — — — 1. Support programs, initiatives, organizations, and community facilities that support physical activity among
children, %
36 35 — — —
2. Promote physical activity and healthy living through the media, % 22 9 — — —
3. Promote physical activity and wellness among employees, % 25 15 — — —
4. Promote physical activity for children and families through their products, services, and business facilities, % 6 15 — — — How can the health care community improve childhood nutrition and increase physical activity at the national
level?n
— — 32 56 50
1. Inform and educate the public about wellness, % — — 31 32 24
2. Provide leadership and advocacy, % — — 44 21 12
3. Emphasize wellness and prevention in delivery of health services, % — — 22 13 16 4. Provide money and other resources to support wellness efforts in the community, % — — 14 7 4 How can the health care community improve childhood nutrition at the national level?n 94 58 — — — 1. Give information on nutrition and/or healthy lifestyles to the public, % 38 55 — — —
2. Provide leadership and advocacy, % 14 9 — — —
Much of what families expect from stakeholders appropriately reflects their recognition that they need to be more vigilant of what they eat and in
what setting. The repeated concern about access to nutritional education throughout all years of a family’s life connected with the recognition that
they need to shop together and pre-pare together for their meals is a logi-cal flow of priorities. Likewise, there is the common recognition that families
TABLE 8 Continued
Common Priorities (Top 4 per Category) Memphis Dallas Philadelphia Chicago Iowa
How can the health care community increase physical activity at the national level?n 51 34 — — — 1. Provide accessible education on the importance of physical activity, % 29 32 — — — 2. Create, offer, and/or financially support programs that involve physical activity and wellness, % 18 29 — — —
3. Lobby and advocate to promote physical activity and wellness, % 16 3 — — —
4. Provide research and expertise, % 0 3 — — —
How can legislators/policy-makers improve childhood nutrition and increase physical activity at the national level?n
— — 35 67 33
1. Increase public’s access to good nutrition and physical fitness through funding, tax incentives, and legislative action, %
— — 23 27 24
2. Ensure that schools provide students with good nutrition, adequate physical activity, and wellness education, %
— — 23 33 6
3. Take action to inform and educate the public, % — — 20 19 9
4. Reform the health care system to increase access and support wellness, % — — 20 6 12 How can legislators/policy-makers improve childhood nutrition at the national level?n 69 41 — — —
1. Ensure that the public receives education about nutrition, % 29 46 — — —
2. Make healthy, nutritious food accessible to the public, % 30 27 — — —
3. Provide leadership on the issue, % 9 12 — — —
4. Create partnerships with other stakeholders to improve nutrition, % 13 7 — — — How can legislators/policy-makers increase physical activity at the national level?n 43 13 — — —
1. Mandate or support physical activity in the schools, % 26 46 — — —
2. Inform and educate the public about physical activity through the media and national campaigns, % 26 15 — — — 3. Increase and improve access to community centers, parks, and other infrastructure supporting physical
activity in the community, %
12 31 — — —
4. Promote physical activity for all of the public through fiscal incentives, tax breaks, and other policy means, %
14 15 — — —
Shown are the percentages of participants who selected the action.
TABLE 9 Creating Partnerships
Common Priorities Memphis
(N⫽411)
Dallas (N⫽296)
Philadelphia (N⫽96)
Chicago (N⫽193) 1. Partner to operate after-school programs, summer camps, sports programs, and other
activities that increase physical activity and/or improve nutrition for children
13 13 26 19
2. Partner to provide education on nutrition, physical activity, and other aspects of wellness to children through the schools
15 20 17 9
3. Partner to provide the physical infrastructure, safety, and other necessities for children and families to increase their physical activity in the community
17 10 13 3
4. Partner in sponsoring special events in the community that promote good nutrition and/or physical fitness
11 6 8 11
5. Partner to provide education on nutrition, activity, and wellness to parents and the community 6 6 7 6
6. Partner to increase families’ access to healthy foods 5 6 3 5
7. Partner to increase physical education programs and physical activity in the schools 8 3 2 4
8. Form coalitions to exchange ideas and plan initiatives 0 2 5 8
9. Promote wellness in general 5 6 2 1
10. Partner to provide better nutrition to children in the school setting 5 2 2 4 11. Partner to provide preventive health screenings and follow-up for families 6 4 0 2 12. Partner to create community campaigns to promote increased physical activity and/or
improved nutrition for everyone
5 2 2 3
13. Partner to create national campaigns to promote physical activity and/or improved nutrition 2 2 1 3
14. Collaborate to advocate/lobby for change 1 2 0 1
15. Collaborate to conduct research to identify effective solutions 1 1 0 2
16. Promote wellness for adults 0 1 2 1
17. Partner to reduce access to unhealthy foods in schools and the community 1 0 2 0 18. Partner to give parents the time and resources to provide improved nutrition and increased
physical activity to their children