R E S E A R C H A R T I C L E
Open Access
Factors associated with attention deficit/
hyperactivity disorder among US children:
Results from a national survey
Ravi K Lingineni
1, Swati Biswas
1,2,5*, Naveed Ahmad
3, Bradford E Jackson
1,4, Sejong Bae
1,4and Karan P Singh
1,4Abstract
Background:The purpose of this study was to investigate the association between Attention Deficit/Hyperactivity Disorder (ADHD) and various factors using a representative sample of US children in a comprehensive manner. This includes variables that have not been previously studied such as watching TV/playing video games, computer usage, family member’s smoking, and participation in sports.
Methods:This was a cross-sectional study of 68,634 children, 5–17 years old, from the National Survey of Children’s Health (NSCH, 2007–2008). We performed bivariate and multivariate logistic regression analyses with ADHD
classification as the response variable and the following explanatory variables: sex, race, depression, anxiety, body mass index, healthcare coverage, family structure, socio-economic status, family members’smoking status,
education, computer usage, watching television (TV)/playing video games, participation in sports, and participation in clubs/organizations.
Results:Approximately 10% of the sample was classified as having ADHD. We found depression, anxiety, healthcare coverage, and male sex of child to have increased odds of being diagnosed with ADHD. One of the salient features of this study was observing a significant association between ADHD and variables such as TV usage, participation in sports, two-parent family structure, and family members’smoking status. Obesity was not found to be significantly associated with ADHD, contrary to some previous studies.
Conclusions:The current study uncovered several factors associated with ADHD at the national level, including some that have not been studied earlier in such a setting. However, we caution that due to the cross-sectional and observational nature of the data, a cause and effect relationship between ADHD and the associated factors can not be deduced from this study. Future research on ADHD should take into consideration these factors, preferably through a longitudinal study design.
Keywords:National Survey of Children’s Health, Neurobehavioral disorder, Obesity, Depression, Medication, TV usage, Participation in sports, Smoking status
* Correspondence:swati.biswas@unthsc.edu 1
Department of Biostatistics, School of Public Health, University of North Texas Health Science Center, Fort Worth, TX, USA
2
Department of Mathematics, University of Texas at Dallas, Richardson TX, USA
Full list of author information is available at the end of the article
Background
The diagnosis of psychiatric, behavioral, and learning disorders has increased over the past decade. Attention Deficit/Hyperactivity Disorder (ADHD) is one of the most common childhood neurobehavioral disorders in the U.S [1,2]. According to the Diagnostic and Statistical Manual of Mental Disorders (DSM-IV), ADHD is char-acterized by pervasive and developmentally inappropri-ate symptoms such as severe lack of attention, impulsive behavior, and hyperactivity that affects children and
per-sists through adulthood in 30–50% of ADHD affected
children [3-6]. It is a multi-factorial and clinically het-erogeneous disorder that affects about 9% to 15% of school going children in the US [7-10]. Previous studies, as of 2007, have found that the percentage of parent reported (ever) ADHD diagnosed children below 17 years of age was 9.5% or about 5.4 million, which represents a 22% increase in four years from 2003 to 2007 [11-14].
In the past 15 years, studies on uncovering the etiology of ADHD focused mainly on the association between ADHD and genetic factors, specifically DRD2 and DRD4 genes [15,16]. Some other studies have shown an associ-ation of ADHD with factors such as obesity, depression, anxiety, sex, age, race, asthma, cigarette smoking, family structure, and socio economic status (SES) [17-27]. Many of these studies showed a significant association between ADHD and body mass index (BMI), however, these studies did not consider factors that may be com-mon for both ADHD and BMI such as participation in sports, clubs, computer usage, and watching television/ playing video games [27-30]. Some studies have shown that having ADHD increases the chance of early initi-ation of smoking habit in children [26,27]. Also, the
ef-fect of mother’s smoking during pregnancy on ADHD
has been previously studied [31,32]. However, the effect
of family members’ smoking on children’s ADHD has
not been considered. Thus, there is a need for a more comprehensive study of factors. Our study considers the potential factors from previous studies as well as the fac-tors not considered earlier together. The purpose of this study was to explore the association between ADHD diagnosis and many factors together using a nationally representative sample, in particular, the National Survey of Child Health (NCSH) of the US. Even though our study cannot establish any of these factors as risk/pro-tective factors due to the cross-sectional and observa-tional nature of the data, we believe this type of comprehensive study on association is lacking in the ADHD literature and this article aims to fill this gap.
Methods
NSCH data
NSCH is a population-based, cross-sectional, random-digital-dialing survey using a complex, multi-cluster,
probability sampling design [33]. This survey was spon-sored by the Department of Health and Human Services (DHHS), Maternal and Child Health Bureau in partner-ship with the National Center for Health Statistics, which is a part of the Center for Disease Control and Prevention [34]. The data were collected by random-digital-dialing households with children under 18 years of age from each of the 50 states and the District of Columbia during the period of April 2007 to July 2008. A child was randomly selected from each of the sampled households to be the subject of the survey. The parent or guardian who knew the most about the selected
child’s health and health care was interviewed with
ques-tions over the telephone. The interview was conducted in both English and Spanish, and consisted of questions
regarding demographics, child’s health and functional
status, health insurance coverage, health care access and utilization, medical home, family functioning, parental health, and neighborhood/community characteristics. A total of 91,642 children of age 17 years or under, with an overall weighted response rate of 55.3% were included in NSCH 2007 study. Population based estimates were obtained by assigning sampling weights to each sampled child for whom an interview was completed. Detailed in-formation about the design of the NSCH is available at www.nschdata.org.
Study sample
According to the DSM-IV, the diagnosis of ADHD requires the child to experience ADHD characteristics such as lack of attention, impulsive behavior, and hyper-activity in at least two different settings, namely home and school; while previous studies also show that the earliest onset age for a child to be diagnosed and treated for ADHD can be below 7 years [35]. As one of the two settings required for the diagnosis of ADHD is school, we considered children between 5 to 17 years old to be our study sample. There were a total of 68,634 responses given by the parents or guardians of children aged 5 to 17 years. Since the NSCH is a population based survey, the selected sample is a representative sample of chil-dren aged 5 to 17 years in the US.
Variables
The primary dependent variable used in our study was ascertained through the following question to the parent
or guardian: “Has a doctor or health professional ever
told you that selected child (S.C.) has attention deficit disorder or attention deficit hyperactive disorder, that is,
ADD or ADHD?”. We categorized the variable into:
‘ADHD’ if the response was‘Yes’, and‘No ADHD’if the
response was‘No’. The psychological factors included in
the study were depression (DEP;“Has a doctor or other
depression?”) and anxiety (ANX;“Has a doctor or other health care provider ever told you that S.C. had anxiety
problems?’). The NSCH has a sex- and age-specific
derived BMI variable that is categorized into
under-weight (<5thpercentile), normal weight (≥5thand <85th
percentile), at risk of overweight (≥85thand <95th
per-centile) and overweight (≥95th percentile). To explicate,
we refer to the last two categories as overweight and
obese, respectively. Other independent variables
included in the analysis were sex, race/ethnicity (Non-Hispanic White vs. Non- (Non-Hispanic Black, (Non-Hispanic, Other), highest level of education (EDUC) attained by anyone in the household (More than high school vs. High school graduate or less), family structure (FAMILY; Two parent including biological, step, or adopted vs. Other including single mother), dichotomized poverty level based on DHHS Federal Poverty guidelines
(POV-ERTY; ≤ 200% vs. > 200%), healthcare coverage (INS;
Having any health insurance such as Health Mainten-ance Organizations (HMOs) or Medicaid vs. Not having healthcare coverage), participation in sports (SPORTS; S. C. on a sports team or taking sports lessons after the school or on weekends vs. Not participating in sports), participation in clubs (CLUBS; S.C. on any clubs or organizations after school or on weekend vs. Not partici-pating in clubs), daily average computer usage (COMP)
for purposes other than school work (≥ 1 hour vs. < 1
hour), daily average television watching/playing video
games (TV; ≥ 1 hour vs. < 1 hour), family member’s
smoking status (SMOKE; Cigarettes, cigars, or pipe tobacco used by anyone in the household vs. No one in the household smokes) [17-32].
We also considered the effect of medication on the as-sociation between ADHD and BMI, as most of the medi-cations prescribed for ADHD may have anorectic effects
[36]. To do this we utilized the question: “Is S.C.
cur-rently taking medication for ADD or ADHD?”. We
com-bined responses to this question with the ones to the ADHD question mentioned earlier to create a variable
with three categories: ‘ADHD and currently taking
Table 1 Characteristics of subjects 5–17 years old, NSCH 2007
Variable N
(Unweighted)
Weighted % ± SE
ADHD classification
Yes 7137 10.08 ± 0.28
No 61378 89.91 ± 0.28
BMI
Underweight 2186 5.16 ± 0.27
Normal 29121 63.19 ± 0.60
Overweight 6754 15.26 ± 0.44
Obese 6040 16.37 ± 0.48
Sex
Male 35677 51.13 ± 0.48
Female 32863 48.86 ± 0.48
Age: Median(IQR) 10.63 (6.51)
Depression
Yes 3088 4.50 ± 0.21
No 65481 95.49 ± 0.21
Anxiety
Yes 4125 5.31 ± 0.21
No 64428 94.68 ± 0.21
Race/Ethnicity
Non- Hispanic White 46739 56.75 ± 0.51
Non-Hispanic Black 6908 14.93 ± 0.33
Hispanic 8006 19.77 ± 0.50
Other 5894 8.53 ± 0.29
Poverty
≤200% 17008 37.68 ± 0.50
>200% 45873 62.31 ± 0.50
Family member’s Smoking status
By any one in household 17221 26.37 ± 0.42
No one Smoke 50901 73.62 ± 0.42
Highest level of Education in the household
Less than/High School Education 15624 33.16 ± 0.49
More than High School Education 52204 66.83 ± 0.49
Family structure
Two parent -biological/step/adopted 51682 73.19 ± 0.43
Other - single mother/father/other 16532 26.80 ± 0.43
Healthcare coverage
Yes 63154 90.43 ± 0.31
No 5343 9.56 ± 0.31
Participation in Sports
Yes 40673 58.30 ± 0.50
No 23354 41.69 ± 0.50
Participation in Clubs
Yes 40352 56.89 ± 0.51
No 23649 43.10 ± 0.51
Average computer usage during a weekday
Table 1 Characteristics of subjects 5–17 years old, NSCH
2007(Continued)
≥1 hour 30744 61.36 ± 0.54
<1 hour 19811 38.64 ± 0.54
Average TV usage during weekday
≥1 hour 50080 83.99 ± 0.39
<1 hour 9898 16.01 ± 0.39
Current Medication Use (in ADHD group)
Yes 3735 66.72 ± 1.65
No 1690 33.28 ± 1.65
Unweighted N = 68634.
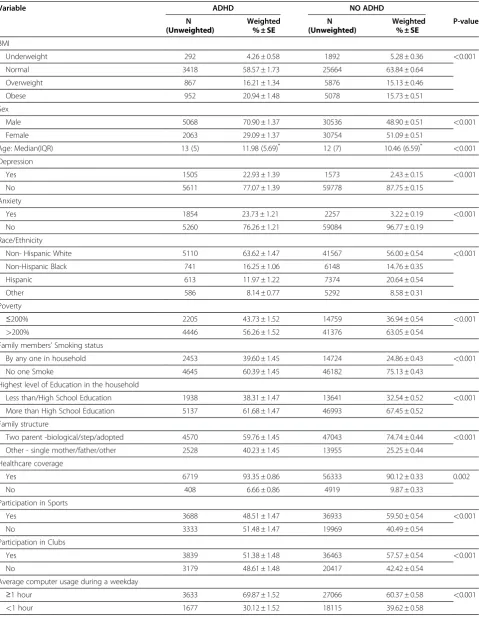
Table 2 Factors stratified by ADHD classification for subjects 5–17 years old, NSCH 2007
Variable ADHD NO ADHD
N Weighted N Weighted P-value
(Unweighted) % ± SE (Unweighted) % ± SE
BMI
Underweight 292 4.26 ± 0.58 1892 5.28 ± 0.36 <0.001
Normal 3418 58.57 ± 1.73 25664 63.84 ± 0.64
Overweight 867 16.21 ± 1.34 5876 15.13 ± 0.46
Obese 952 20.94 ± 1.48 5078 15.73 ± 0.51
Sex
Male 5068 70.90 ± 1.37 30536 48.90 ± 0.51 <0.001
Female 2063 29.09 ± 1.37 30754 51.09 ± 0.51
Age: Median(IQR) 13 (5) 11.98 (5.69)* 12 (7) 10.46 (6.59)* <0.001
Depression
Yes 1505 22.93 ± 1.39 1573 2.43 ± 0.15 <0.001
No 5611 77.07 ± 1.39 59778 87.75 ± 0.15
Anxiety
Yes 1854 23.73 ± 1.21 2257 3.22 ± 0.19 <0.001
No 5260 76.26 ± 1.21 59084 96.77 ± 0.19
Race/Ethnicity
Non- Hispanic White 5110 63.62 ± 1.47 41567 56.00 ± 0.54 <0.001
Non-Hispanic Black 741 16.25 ± 1.06 6148 14.76 ± 0.35
Hispanic 613 11.97 ± 1.22 7374 20.64 ± 0.54
Other 586 8.14 ± 0.77 5292 8.58 ± 0.31
Poverty
≤200% 2205 43.73 ± 1.52 14759 36.94 ± 0.54 <0.001
>200% 4446 56.26 ± 1.52 41376 63.05 ± 0.54
Family members’Smoking status
By any one in household 2453 39.60 ± 1.45 14724 24.86 ± 0.43 <0.001
No one Smoke 4645 60.39 ± 1.45 46182 75.13 ± 0.43
Highest level of Education in the household
Less than/High School Education 1938 38.31 ± 1.47 13641 32.54 ± 0.52 <0.001
More than High School Education 5137 61.68 ± 1.47 46993 67.45 ± 0.52
Family structure
Two parent -biological/step/adopted 4570 59.76 ± 1.45 47043 74.74 ± 0.44 <0.001
Other - single mother/father/other 2528 40.23 ± 1.45 13955 25.25 ± 0.44
Healthcare coverage
Yes 6719 93.35 ± 0.86 56333 90.12 ± 0.33 0.002
No 408 6.66 ± 0.86 4919 9.87 ± 0.33
Participation in Sports
Yes 3688 48.51 ± 1.47 36933 59.50 ± 0.54 <0.001
No 3333 51.48 ± 1.47 19969 40.49 ± 0.54
Participation in Clubs
Yes 3839 51.38 ± 1.48 36463 57.57 ± 0.54 <0.001
No 3179 48.61 ± 1.48 20417 42.42 ± 0.54
Average computer usage during a weekday
≥1 hour 3633 69.87 ± 1.52 27066 60.37 ± 0.58 <0.001
medication’(ADHD-CM),‘ADHD and not currently
tak-ing medication’ (ADHD-NCM), and ‘No ADHD’; ‘No
ADHD’was considered as the reference group. This
tri-chotomized variable is used as a dependent variable in one of the models. We chose not to use this variable as our primary dependent variable due to several limita-tions with the medication use question and its
discrep-ancy in sample size with the ADHD question
(elaborated later in the Discussion section).
Statistical analysis
We computed descriptive statistics based on unweighted sample sizes and weighted percentages for children aged 5 to 17 years. Next, we used chi-square tests for testing the association of each variable with ADHD. Then we performed logistic regression analysis with ADHD as the response variable and the independent variables speci-fied above, first with each of the variables individually (bivariate analysis) and then with all of them in the model (multivariate analysis) to obtain unadjusted and adjusted odds ratios (OR), respectively. For the trichoto-mized dependent variable that incorporates the medica-tion effect, we used the multinomial logistic regression with independent variables same as in our previous model. All analyses were carried out in SAS version 9.2 to account for the complex survey design of the study [37,38]. In particular, we performed domain analysis for
the 5–17 years age group [39].
Results
The descriptive statistics (Table 1) show that the preva-lence of ADHD is about 10% (n = 7,137). In this study, 51.13% were male; 56.75% were non-Hispanic White, 14.93% were non- Hispanic Black and 19.77% were His-panic. About 16.37% of the study subjects were obese while 63.19% were normal weight, and only 5.16% were underweight. DEP and ANX were reported in 4.50% and 5.31% of the children, respectively. Further, 62.31% were above the 200% POVERTY level specified by DHHS and around two thirds (66.35%) of the households had more than high school EDUC. Most of the children (90.43%) had INS, were (73.19%) living in two-parent FAMILY, had (73.62%) no one SMOKE in the household. Add-itionally, 58.30% and 56.89% were in SPORTS and CLUBS, respectively; and 61.36% and 83.99% had used
Table 2 Factors stratified by ADHD classification for subjects 5–17 years old, NSCH 2007(Continued)
Average TV usage during weekday
≥1 hour 5788 90.02 ± 0.68 44204 83.24 ± 0.43 <0.001
<1 hour 847 9.97 ± 0.68 9041 16.75 ± 0.43
Unweighted N = 68634.
SE: Standard Error; IQR: Inter-Quartile Range. * Weighted Mean (Weighted SE).
Table 3 Unadjusted odds ratios for factors associated with ADHD classification, NSCH 2007
Variable ADHD
OR LCL UCL
BMI
Underweight 0.88 0.65 1.20
Normal Ref Ref Ref
Overweight 1.17 0.95 1.44
Obese 1.45* 1.19 1.77
Sex
Male 2.55* 2.22 2.92
Female Ref Ref Ref
Age 1.10* 1.08 1.11
Depression
Yes 11.94* 9.75 14.61
No Ref Ref Ref
Anxiety
Yes 9.35* 7.82 11.18
No Ref Ref Ref
Race/Ethnicity
Non- Hispanic White Ref Ref Ref
Non-Hispanic Black 0.97 0.82 1.14
Hispanic 0.51* 0.40 0.65
Other 0.83 0.67 1.04
Poverty
≤200% 1.33* 1.17 1.51
>200% Ref Ref Ref
Family members’smoking status
At least one member smokes 1.98* 1.75 2.25
No one smokes Ref Ref Ref
Highest level of Education in the household
Less than/High School Education Ref Ref Ref
More than High School Education 0.78* 0.68 0.89
Family structure
Two parent -biological/step/adopted 0.50* 0.44 0.57
Other - single mother/father/other Ref Ref Ref
Healthcare coverage
Yes 1.54* 1.16 2.04
No Ref Ref Ref
COMP for other than schoolwork and watched TV on
an average for ≥1 hour during a weekday, respectively.
Finally, of the children classified as with ADHD, 66.72% take medication.
We summarize various factors by ADHD classification and report the corresponding p- values in Table 2. All the factors were statistically significant at the 0.05 level. In particular, children in the ADHD and No ADHD groups differ strikingly in many characteristics including: 70.90% vs. 48.90% males, 22.93% vs. 2.43% DEP, 23.73% vs. 3.22% having ANX, 39.60% vs. 24.86% having some-one SMOKE, 59.76% vs. 74.74% living in a two-parent FAMILY, and 48.51% vs. 59.50% in SPORTS, respect-ively. The ORs and their confidence intervals (CI) from the bivariate analysis are shown in Table 3. The follow-ing variables showed significantly increased odds of being classified as having ADHD: when a child was male
(OR 2.55, 95% CI 2.22–2.92); obese (OR 1.45, 95% CI
1.19–1.77); had DEP (OR 11.94, 95% CI 9.75–14.61);
had ANX (OR 9.35, 95% CI 7.82–11.18); belonged to
≤200% POVERTY level (OR 1.33, 95% CI 1.17–1.51);
had INS (OR 1.54, 95% CI 1.16–2.04); had someone
SMOKE (OR 1.98, 95% CI 1.75–2.25); used COMP for
≥1 hour for the purpose other than school work in a
weekday (OR 1.52, 95% CI 1.31–1.77); or watched TV for
≥1 hour (OR 1.82, 95% CI 1.55–2.13); than the respective
reference group. Additionally, the odds of a child being diagnosed with ADHD increased 10% (OR 1.10, 95% CI
1.08–1.11) with every one year increase in age. A child
was significantly less likely to be classified as having ADHD if he/she was living in a two-parent FAMILY (OR
0.50, 95% CI 0.44–0.57); was Hispanic (OR 0.51, 95% CI
0.40–0.65); had at least one of the parent/guardian with
more than high school EDUC (OR 0.78, 95% 0.68–0.89);
was in SPORTS (OR 0.64, 95% CI 0.57–0.73); or was in
CLUBS (OR 0.78, 95% CI 0.69–0.88).
Table 3 Unadjusted odds ratios for factors associated with ADHD classification, NSCH 2007(Continued)
Yes 0.64* 0.57 0.73
No Ref Ref Ref
Participation in Clubs
Yes 0.78* 0.69 0.88
No Ref Ref Ref
Average computer usage during a weekday
≥1 hour 1.52* 1.31 1.77
<1 hour Ref Ref Ref
Average TV usage during weekday
≥1 hour 1.82* 1.55 2.13
<1 hour Ref Ref Ref
* Significant association at 0.05 level.
OR: Odds Ratio; LCL: 95% Lower Confidence Limit; UCL: 95%Upper Confidence Limit; Ref: Reference Category.
Table 4 Adjusted odds ratios for factors associated with ADHD classification, NSCH 2007
Variable ADHD
OR LCL UCL
BMI
Underweight 0.64* 0.43 0.95
Normal Ref Ref Ref
Overweight 1.05 0.81 1.36
Obese 1.06 0.81 1.39
Sex
Male 2.82* 2.26 3.52
Female Ref Ref Ref
Age 1.00 0.95 1.04
Depression
Yes 5.28* 3.65 7.64
No Ref Ref Ref
Anxiety
Yes 3.04* 2.20 4.19
No Ref Ref Ref
Race/Ethnicity
Non- Hispanic White Ref Ref Ref
Non-Hispanic Black 0.72* 0.53 0.98
Hispanic 0.65* 0.43 0.95
Other 0.78 0.54 1.14
Poverty
≤200% 1.07 0.84 1.37
>200% Ref Ref Ref
Family members’smoking status
At least one member smokes 1.33* 1.08 1.64
No one smokes Ref Ref Ref
Highest level of Education in the household
Less than/High School Education Ref Ref Ref
More than High School Education 1.11 0.89 1.38
Family structure
Two parent -biological/step/adopted 0.70* 0.56 0.87
Other - single mother/father/other Ref Ref Ref
Healthcare coverage
Yes 1.45* 1.00 2.08
No Ref Ref Ref
Participation in Sports
Yes 0.80* 0.65 0.98
No Ref Ref Ref
Participation in Clubs
Yes 0.86 0.71 1.04
No Ref Ref Ref
Average computer usage during a weekday
≥1 hour 1.06 0.85 1.33
The adjusted odds ratios from the multivariate analysis (Table 4) showed that when adjusted for other variables a child had significantly increased odds of being classi-fied as having ADHD if the sex was male (OR 2.82, 95%
CI 2.26–3.52); had DEP (OR 5.28, 95% CI 3.65–7.64);
had ANX (OR 3.04, 95% CI 2.20–4.19); had INS (OR 1.45,
95% CI 1.00–2.08); watched TV for≥1 hour (OR 1.32, 95%
CI 1.03–1.70); or had someone SMOKE (OR 1.33, 95% CI
1.08–1.64). On the other hand, there were significantly
decreased odds of being diagnosed with ADHD if a child
was underweight (OR 0.64, 95% CI 0.43–0.95); was either
Non-Hispanic Black (OR 0.72, 95% CI 0.53–0.98) or
His-panic (OR 0.65, 95% CI 0.43–0.95); was living in a
two-parent FAMILY (OR 0.70, 95% CI 0.56–0.87); or was in
SPORTS (OR 0.80, 95% CI 0.65–0.98).
The multinomial logistic regression model using the tri-chotomized ADHD classification with medication as the
dependent variable showed similar results (Table 5) with
some variables such as sex (OR 3.53, 95% CI 2.79–4.46),
DEP (OR 6.97, 95% CI 4.66–10.44), ANX (OR 3.38, 95% CI
2.36–4.85), age (OR 0.92, 95% CI 0.86–0.97), INS (OR 2.24,
95% CI 1.24–4.07), and TV (OR 1.56, 95% CI 1.17–2.09)
showing significance for the group ADHD-CM, and some
variables such as BMI underweight (OR 0.41, 95% CI 0.23–
0.75), sex (OR 2.52, 95% CI 1.54–4.14), DEP (OR 4.66, 95%
CI 2.57–8.43), ANX (OR 2.77, 95% CI 1.63–4.69), and
FAMILY (OR 0.56, 95% CI 0.37–0.85) showing significance
for the group ADHD-NCM. In particular, with respect to the variable BMI, obesity was not significant as before while the decreased odds for underweight (OR 0.41, 95% CI
0.23–0.75) was only significant for the ADHD-NCM group.
Furthermore, the variables SMOKE and SPORTS lost their significance in this model. Nevertheless, the results from this particular model need to be interpreted with caution due to some limitations to be discussed in the next section. Table 4 Adjusted odds ratios for factors associated with
ADHD classification, NSCH 2007(Continued)
Average TV usage during weekday
≥1 hour 1.32* 1.03 1.70
<1 hour Ref Ref Ref
* Significant association at 0.05 level.
OR: Odds Ratio; LCL: 95% Lower Confidence Limit; UCL: 95%Upper Confidence Limit; Ref: Reference Category.
Table 5 Adjusted odds ratios for factors associated with ADHD and Medication use classification, NSCH 2007
Variable ADHD
Not taking Medication
ADHD taking Medication
OR LCL UCL OR LCL UCL
BMI
Underweight 0.41* 0.23 0.75 0.82 0.49 1.40
Normal Ref Ref Ref Ref Ref Ref
Overweight 0.84 0.56 1.25 1.00 0.69 1.44
Obese 1.43 0.83 2.47 0.80 0.60 1.06
Sex
Male 2.52* 1.54 4.14 3.53* 2.79 4.46
Female Ref Ref Ref Ref Ref Ref
Age 1.05 0.96 1.15 0.92* 0.86 0.97
Depression
Yes 4.66* 2.57 8.43 6.97* 4.66 10.44
No Ref Ref Ref Ref Ref Ref
Anxiety
Yes 2.77* 1.63 4.69 3.38* 2.36 4.85
No Ref Ref Ref Ref Ref Ref
Race/Ethnicity
Non- Hispanic White Ref Ref Ref Ref Ref Ref
Non-Hispanic Black 0.78 0.42 1.44 0.74 0.48 1.15
Hispanic 0.90 0.41 1.98 0.61 0.35 1.08
Other 1.00 0.57 1.74 0.70 0.40 1.23
Table 5 Adjusted odds ratios for factors associated with ADHD and Medication use classification, NSCH 2007
(Continued)
Poverty
≤200% 1.01 0.66 1.54 1.26 0.91 1.75
>200% Ref Ref Ref Ref Ref Ref
Family Member’s smoking status
At least one member smokes 1.38 0.99 1.93 1.32 0.98 1.79
No one smokes Ref Ref Ref Ref Ref Ref
Highest level of Education in the household
Less than/High School Education Ref Ref Ref Ref Ref Ref
More than High School Education 1.03 0.69 1.54 1.13 0.87 1.47
Family structure
Two parent -biological/step/adopted 0.56* 0.37 0.85 0.89 0.67 1.17
Other - single mother/father/other Ref Ref Ref Ref Ref Ref
Healthcare coverage
Yes 1.34 0.73 2.44 2.24* 1.24 4.07
No Ref Ref Ref Ref Ref Ref
Participation in Sports
Yes 0.69 0.47 1.01 0.84 0.65 1.08
No Ref Ref Ref Ref Ref Ref
Participation in Clubs
Yes 0.83 0.57 1.19 0.93 0.73 1.19
No Ref Ref Ref Ref Ref Ref
Average Computer usage during weekday
≥1 hour 1.25 0.83 1.87 0.89 0.65 1.22 <1 hour Ref Ref Ref Ref Ref Ref Average TV usage during weekday
≥1 hour 1.25 0.76 2.06 1.56* 1.17 2.09 <1 hour Ref Ref Ref Ref Ref Ref
* Significant association at 0.05 level.
Discussion
Our comprehensive study found several factors asso-ciated with ADHD including some that have not been examined together in conjunction with other variables, especially at the national level. The significant associ-ation found between ADHD and DEP, ANX, sex, race, FAMILY, POVERTY, and EDUC is consistent with previ-ous studies on ADHD [22-25]. However, after account-ing for the ADHD related factors, obesity was not found to be significant, contrary to some previous studies [25]. The variables SMOKE, INS, SPORTS, and TV were found to be associated with ADHD at the national level for the first time in our study. A child with DEP, ANX,
TV≥1 hour, or with someone SMOKE in household had
an increased odds of being diagnosed with ADHD. On the other hand, if a child was underweight, non-Hispanic White, living in a two-parent FAMILY, or in SPORTS, he/she had decreased odds of being diagnosed with ADHD.
This study is not without limitations. The NSCH is a random digital dialing telephone survey based on the responses of parent/guardians. So the responses could be affected by recall bias or the given information could be fallacious (such as misreporting of height/weight). In particular, the diagnosis of ADHD was solely dependent on the response given by a parent to a single question
[“Has a doctor or health professional ever told you that
S.C. has attention deficit disorder or attention deficit
hyperactive disorder, that is, ADD or ADHD?”]; this may
have resulted in diagnostic misclassification. In other words, as this is not a clinical study, it is unclear how many children who met the ADHD criteria were undiag-nosed and/or untreated. Further, the survey question on SMOKE [Does anyone living in the household use cigar-ettes, cigar, and pipe tobacco?] does not specify whether the child or someone else in the household including parent/guardian was a smoker; results may alter if the smoker in the household was the child him/herself. Also, some bias is expected due to the cross-sectional nature of the study. For example, the survey fails to capture whether the ADHD, DEP, and ANX diagnosis were con-current or at different time points in the lifetime of the child. Due to these and the observational nature of the study design, the association found in our study cannot be interpreted as causation for ADHD. For example, the association observed between ADHD and the factors SPORTS and CLUBS could be due to the fact that ADHD diagnosed children are just not welcomed on a sport/club teams because of their behavioral problems rather than lack of sporting/physical activity being a risk factor for ADHD. That is, some of the associated factors could be consequences of having ADHD.
The results show that the ADHD diagnosed children were most likely from a household having insurance. It
is not known how many of the children from the unin-sured households may have met the ADHD criteria but were undiagnosed. We performed a sensitivity analysis
by analyzing only the insured 5–17 years old. The results
were similar as before (Table 4) except for minor changes in significance of few variables: TV and race lost their significance marginally while CLUBS gained signifi-cance marginally.
With the inclusion of the medication effect, the signifi-cance of the association of ADHD with TV and SPORTS was lost. This suggests that these associations could be due to a behavior related factor that could be monitored. However, the results from the model utilizing medica-tion effect may not be totally reliable due to limitamedica-tions in the medication variable as collected in the NCSH. First, the survey question does not collect information about past medication use for ADHD because of which a child who was diagnosed with ADHD in the past and hence took medication in the past would be categorized into the ADHD-NCM group. While this group is sup-posed to include only those children who satisfy the conditions of having ADHD and not taking medication for ADHD concurrently. This limitation is similar in es-sence to the one elucidated earlier due to the cross-sectional nature of the survey. Secondly, the unweighted sample sizes for ADHD-NCM (1,690) and ADHD-CM (3,735) groups do not add up to the total number of ADHD-diagnosed children (7,137 from Table 1) due to missing values for the medication use question. Al-though our bivariate analysis showed obesity to be sig-nificantly associated with ADHD, this was not the case in the multivariate analysis irrespective of whether medi-cation use was considered, contrary to some previous studies [18,21,22,24]. Following Waring and Lapane [24], who had analyzed the NCSH 2003 data, we fitted a model using the same data and with the following subset of variables: sex, race, DEP, ANX, POVERTY, age, and BMI, and the dependent variable as the trichotomized ADHD with medication classification, and indeed found obesity to be significantly associated in this model. However, with the addition of even one or two of the remaining variables, the significance of this association was lost. Thus, our study shows that obesity per se may not have a direct association with ADHD and hence sheds a new light on this research topic.
Conclusions
known factors. This may help pediatricians diagnose and manage ADHD. Further, after accounting for the ADHD related factors, obesity was not found to be significant, contrary to some previous studies. Future research should be directed towards a longitudinal study designed to examine the association between pharmacological fac-tors, ADHD, and related factors in a concurrent manner.
Abbreviations
ADD: Attention Deficit Disorder; ADHD: Attention Deficit/Hyperactivity Disorder; ADHD-CM: Attention Deficit/Hyperactivity Disorder and currently taking medication; ADHD-NCM: Attention Deficit/Hyperactivity Disorder and not currently taking medication; ANX: Anxiety; BMI: Body Mass Index; CI: Confidence Interval; CLUBS: Participation in Clubs; COMP: Computer usage; DEP: Depression; DHHS: Department of Health and Human Services; DSM: Diagnostic and Statistical Manual of Mental Disorders; EDUC: Education; FAMILY: Family structure; HMOs: Health Maintenance Organizations; INS: Healthcare coverage; POVERTY: Poverty Level; IQR: Inter-Quartile Range; NSCH: National Survey of Children’s Health; OR: Odds Ratio;
POVERTY: Department of Health and Human Services Poverty guideline; S.C: Selected Child; SE: Standard Error; SES: Socio-Economic Status; SMOKE: Family member’s smoking status; SPORTS: Participation in Sports; TV: Watching TV/playing Video games.
Competing interests
None of the authors have any conflict of interest.
Authors’contributions
Ravi K. Lingineni reviewed literature, carried out all data analyses, and drafted the manuscript. Swati Biswas supervised Ravi Lingineni in data analysis, interpretation, and critical re-drafting of the manuscript. Naveed Ahmad helped in the conception and design of the study and revision of the manuscript. Bradford E. Jackson helped in data analysis and drafting of the manuscript. Sejong Bae supervised Ravi Lingineni in analysis using complex survey procedures in SAS and revision of the manuscript. Karan P. Singh supervised the whole group, helped in the conception and design of the study, and revision of the manuscript. All authors have approved the final version of the manuscript.
Financial disclosure
The authors do not have any financial interests related to this study.
Acknowledgements
We are thankful to the two reviewers for constructive comments and suggestions, which led to improvement and clearer presentation of the manuscript.
Author details
1Department of Biostatistics, School of Public Health, University of North
Texas Health Science Center, Fort Worth, TX, USA.2Department of
Mathematics, University of Texas at Dallas, Richardson, TX, USA.3Department
of Pediatrics, University of Mississippi Medical Center, Jackson, MS, USA.
4Division of Preventive Medicine, Department of Medicine, University of
Alabama at Birmingham, Birmingham, AL, USA.5Department of Biostatistics,
School of Public Health, University of North Texas Health Science, Center, 3500 Camp Bowie Blvd, Fort Worth, TX 76107, USA.
Received: 29 November 2011 Accepted: 17 April 2012 Published: 14 May 2012
References
1. Pliszka S:Practice parameter for the assessment and treatment of children and adolescents with attention-deficit/hyperactivity disorder.
J Am Acad Child Adolesc Psychiatry2007 July,46(7):894–921.
2. Prince JB, Spencer TJ, Wilens TE, Biederman J:In: Stern TA, Rosenbaum JF, Fava M, Biederman J, Rauch SL eds. Massachusetts General Hospital Comprehensive Clinical Psychiatry. InPharmacotherapy of attention-deficit/ hyperactivity disorder across the life span, Volume 1st ed. Philadelphia, PA: Mosby Elsevier; 2008:chap 49.
3. American Psychiatric Association (Ed):Diagnostic and Statistical Manual of Mental disorders. 4th edition. Washington, DC: American Psychiatric Association; 2000.
4. Curtin C, Bandini LG, Perrin EC, Tybor DJ, Must A:Prevalence of overweight in children and adolescents with attention deficit hyperactivity disorder and autism spectrum disorders: a chart review.BMC Pediatr2005,5:48. 5. Faraone SV, Biederman J, Spencer T,et al:Attention-deficit/hyperactivity
disorder in adults: an overview.Biol Psychiatry2000,48:9–20.
6. Searight HR, Burke JM, Rottnek F:Adult ADHD: evaluation and treatment in family medicine.Am Fam Physician2000,62:2077–2086.
7. Biederman J, Faraone SV:Attention-deficit hyperactivity disorder.
Lancet2005,366(9481):237–248.
8. Biederman J:Attention-deficit/hyperactivity disorder: a selective overview.Biol Psychiaty2005,57(11):1215–1220.
9. Nolan EE, Gadow KD, Sprafkin J:Teacher reports of DSM-IV ADHD, ODD and CD symptoms in schoolchildren.J Am Acad Child Adolesc Psychiatry
2001,40:241–249.
10. Szatmari P:The epidemiology of attention-deficit hyperactivity disorders.
Child Adolesc Psychiatr Clin N Am1992,1(2):361–371.
11. CDC:Mental Health in the United States: Increasing prevalence of parent- reported attention deficit/hyperactivity disorder-United States, 2003–2007.MMWR2010,59(44):1439–1443.
12. CDC:Mental Health in the United States: Prevalence of Diagnosis and medication treatment for attention deficit/hyperactivity disorder-United States, 2003.MMWR2005,54:842–847.
13. Skounti M, Philalithis A, Galanakis E:Variations in prevalence of attention deficit/hyperactivity disorder worldwide.Eur J Pediatr2007,
166(2):117–123. 1211–1221.
14. Boyle CA,et al:Trends in the Prevalence of Developmental Disabilities in US Children, 1997–2008.Pediatrics2011,127:1034–1042.
15. Noble EP:The DRD2 gene in psychiatric and neurological disorders and its phenotypes.Pharmacogenomics2000,1:309–333.
16. Poston WS 2nd:Ericsson M, Linder J, et al: D4 dopamine receptor gene exon III polymorphism and obesity risk.Eat Weight Disord1998,3:71–77. 17. Freeman-Fobbs P:Feeding our children to death: The tragedy of
childhood overweight in America.J Natl Med Assoc2003,95(2):119. 18. Bazar KA, Yun AJ, Lee PY,et al:Obesity and ADHD may represent different
manifestations of a common environmental oversampling syndrome: a model for revealing mechanistic overlap among cognitive, metabolic, and inflammatory disorders.Med Hypotheses2006,66(2):263–269. 19. Stevens J, Harman JS, Kelleher KJ:Race/Ethnicity and insurance status as
factors associated with ADHD treatment patterns.J Child Adolesc Psychopharmacol2005,15(1):88–96.
20. Must A, Strauss RS:Risks and consequences of childhood and adolescent obesity.Int J Obes Relat Metab Disord1999,23(Suppl 2):S2–S11.
21. Agranat-Meged AN, Deitcher C, Goldzweig G,et al:Childhood obesity and attention deficit/hyperactivity disorder: A newly described co-morbidity in obese hospitalized children.Int J Eat Disord2005,37(4):357–359. 22. Cortese S, Angriman M, Maffeis C,et al:Attention-deficit/hyperactivity
disorder (ADHD) and obesity: a systematic review of the literature.
Crit Rev Food Sci Nutr2008,48:524–553.
23. Visser SN, Lesesne CA, Perou R:National estimates and factors associated with medication treatment for childhood Attention-deficit/hyperactivity disorder.Pediatrics2007,119:S99–S106.
24. Waring ME, Lapane KL:Overweight in children and adolescents in relation to attention-deficit/hyperactivity disorder: Results from a national sample.Pediatrics2008,122:e1–e6.
25. Bramlett MD, Blumber SJ:Family structure and children’s physical and mental health.Heal Aff2007,26(2):549–555.
26. Kollins SH, McClernon FJ, Fuemmeler BF:Association between smoking and attention-deficit/hyperactivity disorder symptoms in a population-based sample of young adults.Arch Gen Psychiatry2005,62:1142–1147. 27. Milberger S,et al:ADHD is associated with early initiation of cigarette
smoking in children and adolescents.J Am Acad Child Adolesc Psychiatry
1997,36:1:37–44.
28. Tseng MH, Henderson A, Chow SMK, Yao G:Relationship between motor proficiency, attention, impulse, and activity in children with ADHD.
Dev Med Child Neurol2004,46(6):381–388.
29. Chan PA, Rabinowitz T:A cross-sectional analysis of video games and attention deficit hyperactivity disorder symptoms in adolescents.
30. Kiluk B:Sport participation and anxiety in children with ADHD.
J Atten Disord2009,12:6:499–506.
31. Galéra C, Côté SM, Bouvard MP, Pingault JB, Melchior M, Michel G, Boivin M, Tremblay RE:Early factors for hyperactivity-impulsivity and inattention trajectories from age 17 months to 8 years.Arch Gen Psychiatry2011, 68(12):1267–1275.
32. Langley K, Rice F:van den Bree MB.Thapar A. Maternal smoking duringpregnancy as an environmental factor for attention deficit hyperactivity disorder behaviour. A review. Minerva Pediatr2005,57(6):359–371. 33. Blumberg SJ, Foster EB, Frasier AM,et al:Design and Operation of the
National Survey of Children’s Health, National Center for Health Statistics, Volume Forthcoming. Vital Health Stat 1st edition; 2007.
34. National Survey of Children’s Health. [http://www.cdc.gov/nchs/slaits/nsch. htm].
35. Applegate B,et al:Validity of the age-of-onset criterion for ADHD: A report from the DSM-IV field trials.J Am Acad Child Adolesc Psychiatry
1997,36:9.
36. Cortese S, Penalver CM:Comorbidty between ADHD and Obesity: Exploring shared mechanisms and clinical implications.Postgrad Med
2010,122(5):88–96.
37. An AB,et al:Performing logistic regression on survey data with the new Survey logistic procedure.SUGI2002,258:27.
38. SAS/STAT 9.2 user’s guide:The Surveylogistic procedure. [http://support.sas. com/documentation/cdl/en/statugsurveylogistic/61836/PDF/default/ statugsurveylogistic.pdf].
39. Berglund PA:Getting the most out of the SAS Survey procedures: Repeated replication methods, subpopulation analysis and missing data options in SAS v9.2.SAS Global Forum2009,246.
doi:10.1186/1471-2431-12-50
Cite this article as:Lingineniet al.:Factors associated with attention
deficit/hyperactivity disorder among US children: Results from a national survey.BMC Pediatrics201212:50.
Submit your next manuscript to BioMed Central and take full advantage of:
• Convenient online submission
• Thorough peer review
• No space constraints or color figure charges
• Immediate publication on acceptance
• Inclusion in PubMed, CAS, Scopus and Google Scholar
• Research which is freely available for redistribution