ARTICLE
Cumulative Social Disadvantage and Child Health
Laurie J. Bauman, PhD, Ellen J. Silver, PhD, Ruth E.K. Stein, MD
Department of Pediatrics, Albert Einstein College of Medicine/Children’s Hospital at Montefiore, Bronx, New York
The authors have indicated they have no financial relationships relevant to this article to disclose.
ABSTRACT
CONTEXT.Disparities in child health are a major public health concern. However, it is unclear whether these are predominantly the result of low income, race, or other social risk factors that may contribute to their health disadvantage. Although others have examined the effects of the accumulation of risk factors, this meth-odology has not been applied to child health.
OBJECTIVE.We tested 4 social risk factors (poverty, minority race/ethnicity, low parental education, and not living with both biological parents) to assess whether they have cumulative effects on child health and examined whether access to health care reduced health disparities.
DESIGN.We analyzed data on 57 553 children⬍18 years from the 1994 and 1995 National Health Interview Survey Disability Supplement. Of the 4 risk factors, 3 (poverty, low parental education, and single-parent household) were consistently associated with child health. These were summed, generating the Social Disad-vantage Index (range: 0 –3).
RESULTS.A total of 43.6% of children had no social disadvantages, 30.8% had 1, 15.6% had 2, and 10.0% had all 3. Compared with those with no social disad-vantages, the odds ratios (ORs) of being in “good, fair, or poor health” (versus “excellent or very good”) were 1.95 for 1 risk, 3.22 for 2 risks, and 4.06 for 3 risks. ORs of having a chronic condition increased from 1.25 (1 risk) to 1.60 (2 risks) to 2.11 (3 risks). ORs for activity limitation were 1.51 (1 risk) to 2.14 (2 risks) and 2.88 (3 risks). Controlling for health insurance did not affect these findings.
CONCLUSIONS.The accumulation of social disadvantage among children was strongly associated with poorer child health and having insurance did not reduce the observed health disparities.
www.pediatrics.org/cgi/doi/10.1542/ peds.2005-1647
doi:10.1542/peds.2005-1647
This work was presented in part at the annual meeting of the Ambulatory Pediatric Association; May 1– 4, 1999; Boston, MA.
All analyses, interpretations, or conclusions derived from these data are the responsibility of the authors and not the National Center for Health Statistics, which is responsible only for the quality of the data set.
Key Words
child health status, ethnic disparity, racial disparity, poverty
Abbreviations
NHIS—National Health Interview Survey NHIS-D—NHIS Disability Supplement NCHS—National Center for Health Statistics
QuICCC—Questionnaire for Identifying Children With Chronic Conditions
Accepted for publication Sep 30, 2005
Address correspondence to Laurie J. Bauman, PhD, Department of Pediatrics, Albert Einstein College of Medicine, 1300 Morris Park Ave, NR 7S21, Bronx, NY 10461. E-mail: bauman@ aecom.yu.edu
E
VIDENCE IS INCONTROVERTIBLEthat poverty is related to poor health,1–5and the vast majority of the liter-ature indicates that the association is causal.6Poverty is associated with poor health over time, across demo-graphic groups, and regardless of the way social class is measured.7,8 In adults, poverty is associated with lower life expectancy and higher mortality rates.9–12Although not perfectly linear, there seems to be a graded relation-ship between socioeconomic status and health, such that the more economically advantaged someone is, the bet-ter his or her health is likely to be.13Poverty affects children’s health as well. Some re-search has suggested that the gradient of socioeconomic status on health found in adults also occurs among chil-dren.14,15Poor children are almost twice as likely to be in fair or poor health, are 1.7 times more likely to be born low birth weight, are 3.5 times more likely to suffer from lead poisoning, are twice as likely to experience stunting, and are more likely to be diagnosed with severe chronic health conditions.16,17Poor children are 1.7 times more likely to die in infancy and 1.5 times more likely in childhood.16
There are several possible pathways through which poverty may affect child health such as poor nutrition, dangerous physical/environmental home or neighbor-hood conditions, or poor parental mental health.16,18 Health policy analysts have identified inadequate access to health care as another possible reason for social class discrepancies in child health.19 For example, poor and near-poor children are more likely to have an unmet health need and more likely to be uninsured; many lack a usual source of health care.17,20
Several social factors associated with poverty are also related to poor child health, specifically low parental education, minority race/ethnic status, and single-par-ent household. For example, death rates are higher for black than white children throughout most of childhood and particularly in adolescence.21 Life expectancy is higher among white than black infants and children.22 Specific health conditions that demonstrate race/ethnic differences include asthma23,24and low birth weight.25–27 Black children are 2.4 times more likely to be born low birth weight than white children,28 even when social class is controlled.29–31However, recent analyses suggest that race differences in rates of disability among children are explained completely by poverty.32
Education is associated with health as well. Better-educated adults are healthier than those with less edu-cation.33–37 Despite declining overall mortality, over a 26-year period, the disparity in adult mortality by edu-cational level has increased in both whites and blacks.12 Children of parents who did not graduate from high school were less likely to have any physician visit38,39and more likely to have unmet health needs.19At all income
levels, children of more highly educated mothers are more likely to be in excellent or very good health.14,40 Similar to income, there seems to be somewhat of a gradient in the relationship of parent education to child health. Children whose mothers have a high school degree are reported to be in better health than those whose mothers have not finished high school, whereas children whose mothers have more than a high school degree are reported to be in even better health.14,41,42It has also been shown that school-aged children of more educated parents were less likely to have limitations in mobility and in activities of daily living such as eating, dressing, and bathing.41
Children in families headed by single mothers are less likely to be immunized,43more likely to be in fair or poor health,44,45 less likely to use preventive and illness-re-lated health services regardless of insurance coverage, less likely to be insured,44,46and are more likely to have a disability.47
Poverty, minority race/ethnicity, low parental educa-tion, and single-parent household all seem to be associ-ated with increased risk of childhood chronic illness and disability, but it is unclear if these all reflect the same underlying social disadvantage. A good deal of the eth-nic-specific disparity identified in morbidity and mortal-ity seems to be the result of low income.48–51 However, social epidemiology52and a long sociologic tradition53,54 suggest that social disadvantage may be cumulative. Evans55 has argued recently that poverty results in cu-mulative psychosocial and environmental exposures that explain the physical, psychologic, and developmen-tal disadvantages that poor children experience. If inter-related risk factors are merely different indicators of the same underlying construct such as poverty, they would not result in incrementally poorer health. However, if these are independent risks for poor child health, then together they will increase risk additively or exponen-tially. In this article, we tested whether social risk factors had cumulative effects on 3 health status measures in children: overall health, rates of chronic conditions, and presence of an activity limitation. In addition, we exam-ined whether disparities in health related to these social disadvantages were reduced or eliminated when chil-dren were insured. This analysis addressed the hypoth-esis that providing access to medical care would reduce disparities rooted in social inequality.
DESIGN/METHODS
Sample
We analyzed data from the 1994 and 1995 National Health Interview Survey (NHIS). We selected this data set because in addition to the NHIS Core Interview, the NHIS Disability Supplement (NHIS-D) was added to col-lect data on health-related characteristics and prob-lems.45,56,57 The National Center for Health Statistics (NCHS) used a complex multistage probability sampling design to select respondents from the civilian noninsti-tutionalized population of the United States, and statis-tical weighting procedures are used to generate popula-tion-based estimates of their health.58 The overall response rate for the NHIS Core and the NHIS-D to-gether was 87%. There are data on 57 553 children⬍18 years of age in the database.
Measure of Social Disadvantage
The measure was created by identifying which indicators of social disadvantage were consistently related to child health and summing these into a measure of cumulative disadvantage. There is a precedent for using cumulative indices in research examining risk factors for child out-comes such as mental health, behavior problems, and cognitive development.59–63 Perhaps the most well-known example is Rutter’s 1979 Isle of Wight study, which showed that an increasing number of risk factors for childhood psychiatric disorder was directly associated with greater odds of having a clinical problem.64These studies taken together suggest that it is not the particular risk factor, but the number of factors in one’s back-ground that potentially influences development. How-ever, as far as we can determine, this risk-index ap-proach has not been applied to child health as an outcome.
Four kinds of social disadvantage were examined in our study: poverty, low parental education, does not live in a 2-parent family, and minority status (black or His-panic). Bivariate analyses of each risk factor with health indicators showed that 3 were consistently associated with poorer health status in this population, but minor-ity status was not (see Table 2 and “Results”).
To address the hypothesis that more markers of social disadvantage would be associated with worse health, we formed an index that is a count of the number of risk factors each child has. The 3 factors that were consis-tently related to health were recoded into dichotomies, with “not at risk” coded zero and “at risk” coded 1 for each. The cutoff points for these variables were identi-fied by iterative testing, and we chose the cut point for each that resulted in the strongest relationship to the outcome. For family structure, the category considered at risk was all those not living with 2 biological parents, including single-, step-, and no-parent families; this was coded “1” and 2 biological parent families were coded
“0.” (We refer to this category as “single parent” for simplicity; 92% of families coded “1” are single-parent households.) For respondent education, the risk cate-gory coded “1” was high school graduate or below; whereas having a parent who was a college graduate was coded “0.” Family income was coded “1” if below the federal poverty line and “0” if at or above poverty. The scores on these 3 variables were summed, generating the Social Disadvantage Index, with its possible values rang-ing from zero to 3. Percentages within categories are reported in Table 1.
Measures of Health Status
We examined the effects of the social risk factors on the 3 health parameters. The first, overall health status, was measured using a single item from the NHIS core, “Would you say that (child’s) health in general is excel-lent, very good, good, fair or poor?” The second was whether the child had a chronic condition, defined by Stein et al65as a physiological, behavioral, or cognitive disorder lasting 1 year with a consequence in function-ing, reliance on compensatory mechanism or assistance, or increased service use/need. This definition of chronic
TABLE 1 Sample Background and Health Characteristics (nⴝ57 553)
%
Social characteristics Poverty status
Below poverty line 21.9
At or above poverty 78.1
Ethnicity
Non-Hispanic white 64.6
Non-Hispanic black 15.7
Hispanic (any race) 14.7
Other 5.3
Respondent education
Less than high school 12.5
High school graduate 33.9
Some college 24.8
College degree or higher 25.8
Family structure
2-parent family 75.6
Other 24.4
Health parameters Health rating
Excellent 52.1
Very good 27.9
Good 17.4
Fair 2.3
Poor health 0.4
Presence of a chronic condition
Yes 14.6
No 85.4
Presence of activity limitation
Yes 6.4
No 93.6
conditions is noncategorical (it does not use diagnostic labels), inclusive (it identifies children with diverse med-ical, behavioral, and cognitive disorders), theoretically derived, and consequence-based. We operationalized this definition in the NHIS data set using Stein and Silver’s65algorithm, which reflects the Questionnaire for
Identifying Children With Chronic Conditions
(QuICCC),66a 39-item measure based on the Stein et al definition.67The algorithm generates a “yes/no” categor-ical determination of whether the child meets the defi-nitional criteria for a chronic condition.
The third health status measure was the presence of activity limitations, measured using a summary variable from the NHIS core interview that indicates whether the child is unable to perform usual activities or is limited in the amount or kind of activities he or she can do. Be-cause of the way having a chronic condition was defined by the algorithm, all children with activity limitations also had a chronic condition, but the converse is not the case, with 56% of children with a chronic condition in this data set having no activity restriction.
Statistical Analyses
Analyses were conducted by using both SPSS 10.0 for Windows68and SUDAAN 7.0.69SUDAAN is used to ad-just for design effects inherent in the complex cluster samples used by NHIS. All analyses were conducted on weighted data, which were adjusted to reflect the age/ gender/race distribution of the total U.S. population. We examined bivariate relationships between variables us-ing cross tabulations with 2 tests used to determine statistical significance and with logistic regression. Logis-tic regression also was used to generate odds ratios (ORs) for levels of accumulated social disadvantage with each of the 3 health status variables used as an outcome. To assess whether health disparities were smaller or disap-peared when children were insured, we classified chil-dren as having health insurance or not by adapting Newacheck et al’s70definition that includes private in-surance, Medicaid, other public-assistance programs, or other programs such as Medicare, the Indian Health Service, and the Civilian Health and Medical Program of the Uniformed Services. We then examined the relation-ship of social disadvantage to the 3 health status out-comes through logistic regression controlling for insur-ance status.
RESULTS
Sample Description
The average age of children in the sample was 8.3 years (SD: 5.3) and 51.2% were male. The background char-acteristics of parents and the health status of children are reported in Table 1. More than one fifth (21.9%) lived in families who had household incomes under the poverty line, one third (35%) of children were of minority
sta-tus, 46% of their parents had a high school education or less, and 24.4% lived in families that did not include both parents. On the overall health status measure, 20% of children were rated as being in “good,” “fair,” or “poor” health; 14.6% of children met the criteria for having a chronic condition; and 6.4% were reported to have an activity limitation, with 0.7% unable to perform a major activity, 4.0% limited in a major activity, and 1.8% limited in an “other” activity.
Relationship of Individual Social Disadvantage Indicators to Overall Health Status
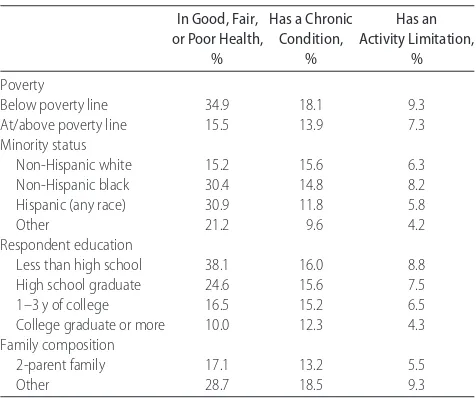
Each of the 4 social disadvantage factors was related to ratings of child’s overall child health (Table 2, column 1). Children living in poverty had poorer health than those at or above the poverty line. Black children, Hispanic children, and children of other race/ethnicities were more likely than white children to be rated as being in good, fair, or poor health. The lower the parental edu-cation level, the poorer the rating of child health, and those not living in 2-parent families were in poorer health than those in 2-parent families.
However, only 3 social disadvantage factors were re-lated as hypothesized to having a chronic condition (Ta-ble 2, column 2) and to having an activity restriction (Table 2, column 3). As expected, children living in households below the poverty line compared with those above the poverty line were more likely to have a chronic condition and more likely to have an activity restriction. Lower respondent education was related to increased rates of chronic conditions and activity restric-tions, and children not living with both parents were more likely than those living with 2 parents to have a
TABLE 2 Social Disadvantage According to Health Status (nⴝ57 553)
In Good, Fair, or Poor Health,
%
Has a Chronic Condition,
%
Has an Activity Limitation,
%
Poverty
Below poverty line 34.9 18.1 9.3
At/above poverty line 15.5 13.9 7.3
Minority status
Non-Hispanic white 15.2 15.6 6.3
Non-Hispanic black 30.4 14.8 8.2
Hispanic (any race) 30.9 11.8 5.8
Other 21.2 9.6 4.2
Respondent education
Less than high school 38.1 16.0 8.8
High school graduate 24.6 15.6 7.5
1–3 y of college 16.5 15.2 6.5
College graduate or more 10.0 12.3 4.3 Family composition
2-parent family 17.1 13.2 5.5
Other 28.7 18.5 9.3
chronic condition or an activity restriction. However, contrary to the social disadvantage hypothesis, black and Hispanic children were not at increased risk. Because minority status was not consistently documented to be a social disadvantage for child health, we created a 3-fac-tor index of cumulative social disadvantage that summed poverty, low education, and single parent to-gether.
We performed a logistic regression controlling for minority status to assess whether the 3 risk factors had independent relationships to the 3 health status mea-sures. Table 3 demonstrates that each risk factor had a significant independent relationship with each outcome controlling for the others.
Social Disadvantage Index
On the Social Disadvantage Index, 43.6% of children had no social disadvantages (26.8 million U.S. children), 30.8% had 1 (18.9 million children), 15.6% had 2 (9.6 million), and 10.0% had all 3 (6.2 million). Table 4 column 1 shows the results of logistic regressions on the relationship of the Social Disadvantage Index to the 3 indicators of child health controlling for age and minor-ity status.
There was a strong and significant gradient in the percentage of children with poorer health as a function of the number of social risks, from 10.8% (no risks) to 38.4% (all 3 risks). With age and race/ethnicity con-trolled, the odds of being in good, fair, or poor health, compared with those with no social disadvantages, were 1.95 for 1 risk, 3.22 for 2 risks, and 4.06 for 3 risks. The increase in odds for each additional social disadvantage was statistically significant.
Prevalence of chronic conditions also increased with number of risk factors (Table 4, column 2). Among chil-dren with no risk factors, 12.8% had a chronic condition versus 19.6% of children with all 3. Compared with children with no risk factors, the ORs of having a chronic condition increased from 1.25 (1 risk) to 1.60 (2 risks) to 2.11 (3 risks) (P⬍.0001). The stepwise increase of each additional social disadvantage was statistically signifi-cant.
The Social Disadvantage Index was also related to the presence of activity limitations (Table 4, column 3), with 4.6% of children with no social risk factors having an activity limitation compared with 10.7% of children with all 3 risks. ORs of having an activity restriction (compared with those with no risks) increased from 1.51 (1 risk) to 2.14 (2 risks) to 2.88 (3 risks) (P⬍ .0001). Again, the stepwise increase in odds as the number of social disadvantaged increased was statistically signifi-cant.
Does Access to Care Attenuate Disparities on the Social Disadvantage Index?
We examined whether health disparities among chil-dren might be smaller if chilchil-dren had access to health care measured by having health insurance. Overall, 13.8% of children had no health insurance. For all 3 health outcomes, controlling for insurance status did not change the relationship of social disadvantage to health (Table 5).
Are Some Combinations of Risk Factors Particularly Problematic?
We performed logistic regressions to assess how every combination of social disadvantage was related to the 3
TABLE 3 Logistic Regression, Social Risk Factors, and Child Health In Good,
Fair, or Poor Health,
OR
Has a Chronic Condition,
OR
Has an Activity Limitation,
OR
Poverty 1.83 1.33 1.50
Not 2-parent family 1.20 1.50 1.55
Less than college education 1.93 1.08 1.27
Original sources of data are the combined 1994 and 1995 NHIS. Estimates are based on weighted data adjusted by age/gender/race categories to reflect the US civilian noninstitution-alized population. Logistic regression controlled for age and race/ethnicity. Significance of ORs was calculated by comparing each OR to the residual category (“none”). All ORs were signifi-cantly different atPⱕ.001.
TABLE 4 Relationship of Cumulative Social Disadvantage to Child Health
Social Disadvantage
Index
In Good, Fair, or Poor Health
Has a Chronic Condition
Has an Activity Limitation
% OR % OR % OR
0 10.8 1.0 12.8 1.0 4.6 1.0
1 20.1 1.94 15.4 1.25 6.8 1.51
2 31.4 3.22 17.2 1.60 8.8 2.13
3 38.4 4.07 19.6 2.11 10.7 2.88
Original sources of data are the combined 1994 and 1995 NHIS. Estimates are based on weighted data adjusted by age/gender/race categories to reflect the US civilian noninstitution-alized population. Logistic regressions controlled for age and race/ethnicity. Significance of ORs was calculated 2 ways: when compared with the residual category (“0”), all ORs were signifi-cantly different atPⱕ.001. Separate analysis also confirmed that each OR was significantly different from the preceding category atPⱕ.001.
TABLE 5 Social Disparities and Child Health Controlling for Insurance Status (ORs)
Social Disadvantage
Index
In Good, Fair, or Poor Health
Has a Chronic Condition
Has an Activity Limitation
0 1.0 1.0 1.0
1 1.93 1.29 1.55
2 3.21 1.68 2.25
3 4.08 2.20 2.99
health outcomes. These analyses were intended to iden-tify combinations of risk factors were particularly likely to increase risk. Several observations could be made from these analyses. First, every social disadvantage, alone or in combination, significantly increased risk over having none of these social disadvantages. Second, most of the time, adding the social disadvantages together increased risk for poor health on all 3 outcomes. Third, in general, all the 1-risk only combinations were less risky than all 2-risk combinations, which were less risky than combining all 3 risks with 1 exception: low educa-tion was an inconsistent risk factor. Sometimes, it added significantly to risk and sometimes it did not. Poverty was a particularly potent risk factor for overall health; most combinations that included poverty status had much higher ORs than those not including it. In con-trast, for both chronic condition and activity limitation, single parent proved a particularly potent disadvantage; combinations of social disadvantage that included this factor tended to be higher than those not including it. It should be noted that some combinations of social disad-vantage are statistically rare (eg, poor college-educated 2-parent families; nonpoor single parent low education) and that estimates for these combinations may be un-stable. Overall, however, it was clear that no specific combination of social disadvantage was especially re-lated to child health indicators.
CONCLUSIONS
The accumulation of social disadvantage among children was strongly associated with the odds of being in poorer overall health, having a chronic condition, and having a limitation of activity. Of the 4 kinds of social disadvan-tage examined, minority race/ethnicity was not consis-tently related to poor child health outcomes, a finding reported by others as well.17,31,66,71It seems that ethnic-specific disparities in child morbidity and mortality are associated with low income.32 Furthermore, inspection of combinations of risk factors showed that low educa-tion was a risk factor alone and in some combinaeduca-tions but not others.
There are several limitations that should be noted. First, the measures of health were all parental report; therefore, replicating this study with data from another source would be warranted. Second, the analysis is cross-sectional and we cannot be sure of the causal connection. Others have clearly demonstrated that there is a causal relationship between poverty and ill health, and we accept this interpretation as a legitimate one for these data. However, it is possible that there is a 2-way causal relationship between poor health in children and single-parent status such that when children are chron-ically ill, marriages dissolve at a higher rate. Also, it is possible that having a sick child might interfere with mothers’ educational opportunities. We reviewed the literature but found no empiric data to support these
possibilities. Similarly, there may be a 2-way causal re-lationship between child health and a control variable, insurance. Children in worse health are more likely to be insured, particularly by public programs, after they are diagnosed. We recommend that our analyses be re-peated on a longitudinal data set. Third, we have taken a macro look at the issue of the accumulation of social disadvantage and did not focus on fine-grained inquiry. That is, we did not ask whether findings would vary depending, for example, on whether those living in a single-parent family also lived with another adult or whether father’s rather than mother’s education was examined. It is tempting to pull apart the categories of disadvantage into smaller and smaller subgroups in the hopes of better understanding the phenomenon, and this could be a fruitful analysis. However, House72warns against this approach, which he termed “the indiscrim-inate expanding smorgasbord of psychosocial risk fac-tors,” each with small to moderate effects. This is espe-cially so when the degree that they are distinct from one another is questionable. In our view, the larger point should be made and emphasized—that social disadvan-tage, however measured, has a cumulative effect on child health.
These data support the position that social structural factors have a cumulative effect on child health status. Poverty, low parental education, and single-parent fam-ily structure are not simply proxies for a single underly-ing disadvantage, but have additive effects on the life chances of children. It is important for clinicians to ap-preciate that children with more than 1 risk factor may in fact have more likelihood of experiencing poor out-comes so that they can assess more thoroughly and provide more aggressive preventive measures when available. Our society is structured in ways that facilitate accumulation of advantage for some and accumulation of disadvantage for others.54,73–76The effects of cumula-tive disadvantage percolate throughout the age spectrum and are as true of children as they are of adults. More research is needed to address whether the timing of the accumulation of disadvantage (the age at which children experience multiple risks) and the length of time chil-dren experience accumulated risk are related to health status.
cumulative social disadvantage on child health.81 Our data support this conclusion.
ACKNOWLEDGMENT
A Robert Wood Johnson Investigator Award in Health Policy Research, awarded to Drs Bauman and Stein, funded this research.
REFERENCES
1. Lynch J, Kaplan G, Cohen R, Tuomilehto J, Salonen J. Do cardiovascular risk factors explain the relationship between socioeconomic status, risk of all-cause mortality, cardiovascular mortality and acute myocardial infarction? Am J Epidemiol.
1996;144:934 –942
2. Davey-Smith G, Neaton J, Wentworth D, Stamler R, Stamler J. Socioeconomic differentials in mortality risk among men screened for the Multiple Risk Factor Intervention Trial: 1. White men.Am J Public Health.1996;86:486 – 496
3. Sorlie P, Backlund E, Keller J. US mortality by economic, demographic, and social characteristics: the National Longitu-dinal Mortality Study.Am J Public Health.1995;85:949 –956 4. Link B, Phelan J. Social conditions as fundamental causes of
disease.J Health Soc Behav.1995;(spec No.):80 –94
5. Marmot M, Kogevinas M, Elston M. Social/economic status and disease.Annu Rev Public Health.1987;8:111–137
6. West P. Rethinking the health selection explanation for health inequalities.Soc Sci Med.1991;32:373–384
7. Feinstein J. The relationship between socioeconomic status and health: a review of the literature.Milbank Q.1993;71:279 –322 8. Lynch J, Kaplan G. Socioeconomic position. In: Berkman L, Kawachi I, eds. Social Epidemiology. New York, NY: Oxford University Press; 2000:13–35
9. Adler N, Boyce T, Chesney M, et al. Socioeconomic status and health: the challenge of the gradient. Am Psychol. 1994;49: 15–24
10. Dutton D. Social class, health and illness. In: Aiken D, Me-chanic D, eds.Applications of Social Science to Clinical Medicine and Health Policy. New Brunswick, NJ: Rutgers University Press; 1986:31– 62
11. Illsley R, Mullen K. The health needs of disadvantaged client groups. In: Holland W, Detels R, Knox G, eds.Oxford Textbook of Public Health. Oxford, United Kingdom: Oxford University Press; 1985:389 – 402
12. Pappas G, Queen S, Hadden W, Fisher G. The increasing dis-parity in mortality between socioeconomic groups in the United States.N Engl J Med.1993;329;2:103–109
13. Adler NE, Ostrove JM. Socioeconomic status and health: what we know and what we don’t.Ann N Y Acad Sci.1999;896:3–15 14. Case A, Lubotsky D, Paxson C. Economic status and health in childhood: the origins of the gradient.Am Econ Rev.2002;92: 1308 –1334
15. Starfield B, Robertson J, Riley AW. Social class gradients and health in childhood.Ambul Pediatr.2002;2:238 –246
16. Brooks-Gunn J, Duncan G. The effects of poverty on children.
Children and Poverty.1997;7:55–71
17. Newacheck P. Poverty and childhood chronic illness.Arch Pe-diatr Adolesc Med.1994;148:1143–1149
18. Newacheck P, Jameson W, Halfon N. Health status and income: the impact of poverty on child health.J Sch Health.
1994;64:229 –233
19. Newacheck P, McManus M, Fox H, Hung Y, Halfon N. Access to health care for children with special health care needs.
Pediatrics.2000;105:760 –766
20. Silver E, Stein R. Access to care, unmet health needs, and
poverty status among children with and without chronic con-ditions.Ambul Pediatr.2001;1:314 –320
21. Singh G, Yu S. US childhood mortality, 1950 through 1993: trends and socioeconomic differentials. Am J Public Health.
1996;86:505–512
22. Hoyert D, Freedman M, Strobino D, Guyer B. Annual vital statistics: 2000.Pediatrics.2001;108:1241–1255
23. Halfon N, Newacheck P. Childhood asthma and poverty: dif-ferential impacts and utilization of health services.Pediatrics.
1993;91:56 – 61
24. Carr W, Zeitel L, Weiss K. Variations in asthma hospitalizations and deaths in New York City. Am J Public Health.1992;82: 59 – 65
25. Guyer B, Hoyert D, Martin J, Ventura S, MacDornan M, Strobino D. Annual summary of vital statistics—1998. Pediat-rics.1999;104:1739 –1745
26. Guyer B, Freedman M, Strobino D, Sondik E. Annual sum-mary of vital statistics: trends in the health of Americans during the 20th century.Pediatrics.2000;106:1307–1317
27. Achievements in Public Health, 1900 –1999: healthier mothers and babies [published correction appears inMMWR Morb Mortal Wkly Rep. 1999;48:892].MMWR Morb Mortal Wkly Rep.1999; 48:849 – 858
28. Health, United States, 1996 –1997, and Injury Chartbook. Hyatts-ville, MD: National Center for Health Statistics; 1997 29. Institute of Medicine.Committee to Study the Prevention of Low
Birthweight. Washington, DC: National Academy Press; 1985 30. Rowley D, Hogue C, Blackmore C, et al. Preterm delivery
among African-American women, a research strategy. Am J Prev Med.1993;9(suppl):1– 6
31. Schoendorf K, Hogue C, Kleinman J, Rowley D. Mortality among infants of black as compared with white college-educated parents.N Engl J Med.1992;326:1522–1526 32. Newacheck P, Stein R, Bauman L, Hung Y. Are there disparities
in the prevalence of disability between white and black chil-dren?Arch Pediatr Adolesc Med.2002;157:244 –248
33. Feldman J, Makuc D, Kleinman J, Cornoni-Huntley J. National trends in educational differentials in mortality.Am J Epidemiol.
1989;129:919 –933
34. Fox A, Goldblatt P, Jones D. Social class mortality differentials: artefact, selection, or life circumstances?J Epidemiol Community Health.1985;39:1– 8
35. Ross C, Wu C. The links between educational attainment and health.Am Sociol Rev.1995;60:719 –745
36. Ross C, VanWilligen M. Education and the subjective quality of life.J Health Soc Behav.1997;38:275–297
37. Wilkenson R.Research and Longitudinal Data. London, United Kingdom: Tavistock; 1986
38. Hanson K. Is insurance for children enough? The link between parents’ and children’s health care use revisited.Inquiry.1998; 35:294 –302
39. Newacheck P, Halfon N. Access to ambulatory care services for economically disadvantaged children. Pediatrics. 1986;78: 813– 819
40. Case A, Paxson C. Parental behavior and child health.Health Aff (Millwood).2002;21:164 –178
41. Mizell Palermo T, Childs G, Burgess ES, Kaugura AS, Comer D, Kelleher K. Functional limitations of school-aged children seen in primary care.Child Care Health Dev.2002;28:379 –389 42. Zill N. Parental schooling & children’s health.Public Health Rep.
1996;111:34 – 43
45. Montgomery L, Kiely J, Pappas G. The effects of poverty, race, and family structure on US children’s health: data from the NHIS, 1978 through 1980 and 1989 through 1991.Am J Public Health.1996;86:1401–1405
46. Angel R, Angel J.Painful Inheritance. Madison, WI: University of Wisconsin Press; 1993
47. Newacheck P, Halfon N. Prevalence and impact of disabling chronic conditions in childhood.Am J Public Health.1998;88: 610 – 617
48. Simpson G, Bloom B, Cohen R, Parsons P. Access to health care. Part 1: Children.Vital Health Stat 10.1997;(196):1– 46 49. Coiro M, Zill N, Bloom B. Health of our nation’s children.Vital
Health Stat 10.1994;(191):1– 61
50. Wood P, Hidalgo H, Prihoda T, Kromer M. Hispanic children with asthma: morbidity.Pediatrics.1993;91:62– 69
51. Chabra A, Chavez G, Harris E. Mental illness in elementary-school-aged children.West J Med.1999;170:28 –34
52. Berkman L, Kawachi I. Social Epidemiology. New York, NY: Oxford University Press; 2000
53. Weber M. Class status & party. In: Girth H, Mills C, eds.From Max Weber: Essays in Sociology. New York, NY: Oxford University Press; 1946:180 –195
54. Merton R. Structural analysis in sociology. In: Blau P, ed.
Approaches to the Study of Social Structure. New York, NY: Free Press; 1975:21–52
55. Evans GW. The environment of childhood poverty.Am Psychol.
2004;59:77–92
56. Datafile Documentation, National Health Interview Survey on Dis-ability, Phase 1 and Phase 2, 1994 (Machine Readable Data File and Documentation). Hyattsville, MD: National Center for Health Statistics; 1998a
57. National Center for Health Statistics.Data File Documentation, National Health Interview Survey on Disability, Phase 1 and Phase 2, 1995 (Machine Readable Data File and Documentation, CD-ROM Series 10, No. 10A). Hyattsville, MD: National Center for Health Statistics; 1998
58. Adams P, Marano M. Current estimates from the National Health Interview Survey, 1994.Vital Health Stat 10.1995;(193 pt 1):1–260
59. Appleyard K, Egelund B, Manfred van Dulman MHM, Sroufe LA. When more is not better: the role of cumulative risk in child behavior outcomes.J Child Psychol Psychiatry. 2005;46: 235–245
60. Atzaba-Poria N, Pike A, Deater-Deckard K. Do risk factors for problem behavior act in a cumulative manner? An examina-tion of ethnic minority and majority children through an eco-logical perspective.J Child Psychol Psychiatry.2004;45:707–718 61. Burchinal MR, Roberts JE, Hooper S, Zeisel SA. Cumulative risk and early cognitive development: A comparison of statis-tical risk models.Dev Psychol.2000;36:793– 807
62. Sameroff AJ, Seifer R, Baldwin A, Baldwin C. Stability of intelligence from preschool to adolescence: the influence of social and family risk factors.Child Dev.1993;64:80 –97 63. Sameroff AJ. Dialectical processes in developmental
psychol-ogy. In: Sameroff A, Lewis M, Miller S, eds.Handbook of Devel-opmental Psychopathology. 2nd ed. New York, NY: Kluwer Academic/Plenum Publishers; 2000:23– 40
64. Rutter M. Protective factors in children’s responses to stress and disadvantage. In: Kent MW, Rolf JE, eds.Primary Preven-tion of Psychopathology.Vol 3: Social Competence in Children. Hanover, NH: University of New England Press; 1979:49 –74 65. Stein R, Bauman L, Westbrook L, Coupey S, Ireys H.
Frame-work for identifying children who have chronic conditions: the case for a new definition.J Pediatr.1993;122:342–347 66. Stein R, Westbrook L, Bauman L. The Questionnaire for
Iden-tifying Children With Chronic Conditions.Pediatrics.1997;99: 513–521
67. Stein R, Silver E. Operationalizing a conceptually-based non-categorical definition: a first look at US children with chronic conditions.Arch Pediatr Adolesc Med.1999;153:68 –74 68. SPSS 10.0 for Windows[computer program]. Chicago, IL: SPSS,
Inc; 1999
69. Shah B, Barnwell B, Bieler G.SUDAAN User’s Manual. Release 7.0. Research Triangle Park, NC: Research Triangle Institute; 1996
70. Newacheck P, Stoddard J, Hughes D, Pearl M. Health insurance and access to primary care for children.N Engl J Med.1998; 338:513–519
71. Stein R, Silver E. Comparing different definitions of chronic conditions in a national data set.Ambul Pediatr.2002;2:63–70 72. House JS. Understanding social factors and inequalities in health: 20th century progress and 21st century prospects.
J Health Soc Behav.2001;43:125–142
73. Lantz PM, House JS, Lepkowski JM, Williams DR, Mero RP, Chen J. Socioeconomic factors, health behaviors and mortality.
JAMA.1998;279:1703–1708
74. Lantz PM, Lynch J, House JS, et al. Socioeconomic disparities in health change in a longitudinal study of US adults: the role of health-risk behaviors.Soc Sci Med.2001;53:28 – 40
75. Link BG, Phelan JC. Social conditions as fundamental causes of disease.J Health Soc Behav.1995;35:80 –94
76. House JS, Kessler R, Herzog H, Mero RP, Kinney AM, Breslow M. Age, socioeconomic status and health.Milbank Q.1990;68: 383– 411
77. Adler N. A consideration of multiple pathways from socioeco-nomic status to health. In: Auerbach J, Krimgold B, eds.Income, Socioeconomic Status, and Health: Exploring the Relationships. Washington, DC: National Policy Association Academy for Health Services Research and Health Policy; 2001:56 – 66 78. Margolis PA, Carey T, Lannon CM, Earp Leininger L. The rest
of the access-to-care puzzle: addressing structural and personal barriers to health care for socially disadvantaged children.Arch Pediatr Adolesc Med.1995;149:541–545
79. Newacheck PW, Stoddard JJ, Hughes DC, Pearl M. Children’s access to health care: the role of social and economic factors. In: Stein REK, ed.Health Care for Children: What’s Right, What’s Wrong, What’s Next. New York, NY: United Hospital Fund; 1997:53–76
80. Weinick RM, Weigers ME, Cohen JW. Children’s health insur-ance, access to care, and health status: new findings.Health Aff (Millwood).1999;17:127–136
DOI: 10.1542/peds.2005-1647
2006;117;1321
Pediatrics
Laurie J. Bauman, Ellen J. Silver and Ruth E.K. Stein
Cumulative Social Disadvantage and Child Health
Services
Updated Information &
http://pediatrics.aappublications.org/content/117/4/1321 including high resolution figures, can be found at:
References
http://pediatrics.aappublications.org/content/117/4/1321#BIBL This article cites 63 articles, 10 of which you can access for free at:
Subspecialty Collections
http://www.aappublications.org/cgi/collection/advocacy_sub
Advocacy
following collection(s):
This article, along with others on similar topics, appears in the
Permissions & Licensing
http://www.aappublications.org/site/misc/Permissions.xhtml in its entirety can be found online at:
Information about reproducing this article in parts (figures, tables) or
Reprints
DOI: 10.1542/peds.2005-1647
2006;117;1321
Pediatrics
Laurie J. Bauman, Ellen J. Silver and Ruth E.K. Stein
Cumulative Social Disadvantage and Child Health
http://pediatrics.aappublications.org/content/117/4/1321
located on the World Wide Web at:
The online version of this article, along with updated information and services, is
by the American Academy of Pediatrics. All rights reserved. Print ISSN: 1073-0397.