High Prevalence of Overweight Among Pediatric Users of
Community Health Centers
Nicolas Stettler, MD, MSCE*‡; Michael R. Elliott, PhD‡; Michael J. Kallan, MS‡;
Steven B. Auerbach, MD, MPH§; and Shiriki K. Kumanyika, PhD, MPH‡
ABSTRACT. Objective. With the increasing preva-lence of pediatric obesity, it is important to identify high-risk populations of children to direct limited re-sources for prevention and treatment to those who are most vulnerable. The objectives of this study were to determine the prevalence of overweight in children who are clients of community health centers in medically underserved areas of the Health Resources and Service Administration regions II and III (Mid-Atlantic and Puerto Rico), compare this prevalence to nationally rep-resentative data, and contrast prevalence data between geographic areas and racial/ethnic groups.
Methods. The charts from a representative sample of 2474 children using 30 community health centers in 2001 were abstracted to collect clinically measured weight and height. Overweight was defined as a body mass index of >95th percentile of a reference population. To generate an unbiased estimate of overweight, multiple imputa-tions were used for missing data. These data were com-pared with the 1999 –2002 National Health and Nutrition Examination Survey.
Results. The prevalence of overweight was elevated in this sample of children aged 2 to 5 years (21.8%; 95% confidence interval [CI]: 19.1–24.8) and 6 to 11 years (23.8%; 95% CI: 16.9 –27.7) compared with the 1999 –2002 National Health and Nutrition Examination Survey (10.3% and 15.8%, respectively). No significant differ-ences in prevalence were observed between Asian Amer-ican (18.2%; 95% CI: 11.2–28.3), Hispanic (24.6%; 95% CI: 21.3–28.2), non-Hispanic black (25.6%; 95% CI: 20.8 –30.9), and non-Hispanic white (22.8%; 95% CI: 19.0 –27.0) chil-dren. Furthermore, no differences in prevalence were observed between children using community health cen-ters in continental urban (23.7%; 95% CI: 20.6 –27.2), sub-urban (24.0%; 95% CI: 20.0 –28.5), or rural (22.9%; 95% CI: 19.3–26.9) areas.
Conclusions. The present study identified a popula-tion of children at particularly high risk for obesity based on the type of health care delivery system they use re-gardless of race/ethnicity or geographic characteristics. Because community health centers are experienced in
prevention and serve>4.7 million children in the United States, they may be a particularly promising point of access and setting for pediatric obesity prevention. Pedi-atrics 2005;116:e381–e388. URL: www.pediatrics.org/cgi/ doi/10.1542/peds.2005-0104; African Americans, Asian Americans, child, community health centers, delivery of health care, European Continental Ancestry Group, His-panic Americans, medically underserved area, obesity, pri-mary health care, Puerto Rico, rural health, suburban health, urban health.
ABBREVIATIONS. HRSA, Health Resources and Service Admin-istration; NHANES, National Health and Nutrition Examination Survey; CDC, Centers for Disease Control and Prevention; CI, confidence interval.
P
ediatric obesity has increased two- to threefold
in the past thirty years in the United States and
continues to rise.
1,2As one of the most frequent
pediatric chronic conditions, it is important to define
populations of children at higher risk for obesity to
direct limited resources for treatment, prevention,
and research. Individual risk factors such as parental
overweight or television viewing
3,4have been well
described but are not particularly useful to direct
resources to the most vulnerable children. Nationally
representative surveys show that Mexican American
and non-Hispanic black children are at higher risk
for obesity than are non-Hispanic white children.
1,2Data on the prevalence of overweight in Asian
American and non-Mexican American Latino
chil-dren, particularly children from Puerto Rico, are
scarce.
5–9Among non-Hispanic white adolescents,
overweight is more frequent with lower
socioeco-nomic status, whereas in non-Hispanic black and
Mexican American adolescents this association is less
clear or may be in the opposite direction.
10Although
the associations of ethnicity, race, and socioeconomic
factors with pediatric overweight are relatively well
defined, other important social health determinants
are less well understood. For example, it is unclear if
children living in medically underserved areas and
using community health centers are at increasing
risk for overweight or if urban, suburban, or rural US
areas have the highest prevalence of pediatric
over-weight. These are important questions to answer to
adequately plan public health and research efforts
and train health professionals.
Community health centers are community-based
organizations partially funded by the federal
govern-ment (through the Health Resources and Service
Ad-From the *Division of Gastroenterology and Nutrition, The Children’sHospital of Philadelphia, Philadelphia, Pennsylvania; ‡Center for Clinical Epidemiology and Biostatistics, University of Pennsylvania School of Med-icine, Philadelphia, Pennsylvania; and §Health Resources and Services Ad-ministration, New York, New York.
Accepted for publication Apr 8, 2005. doi:10.1542/peds.2005-0104 No conflict of interest declared.
Reprint requests to (N.S.) Division of Gastroenterology and Nutrition, North 1559, The Children’s Hospital of Philadelphia, 34th Street and Civic Center Boulevard, Philadelphia, PA 19104-4399. E-mail: nstettle@cceb. med.upenn.edu
ministration [HRSA] under Title III) to deliver health
care in medically underserved areas. More than 4.7
million children are clients of these centers,
11mainly
located in inner-city and rural areas, and they may be
at increased risk for obesity, because medically
un-derserved communities are also often areas in which
access to healthy foods and physical activity
oppor-tunities are limited,
12,13creating a particularly
“obe-sogenic” environment. Because community health
centers respond directly to the communities that they
serve, depend less on funding from private insurers,
and are successful in reducing health care–access
disparities,
14–17they may constitute a particularly
promising setting for pediatric obesity prevention
and treatment if it is confirmed that they serve a
high-risk population.
The aims of this study were to describe the
prev-alence of overweight in children who are clients of
community health centers in medically underserved
areas of HRSA regions II and III, compare this
prev-alence to nationally representative data, and contrast
prevalence data between geographic areas and
ra-cial/ethnic groups.
METHODS Design and Sampling
This is a cross-sectional survey of a representative sample of all children using the 141 HRSA-supported community health cen-ters in regions II (New Jersey, New York, Puerto Rico, and US Virgin Islands) and III (Delaware, Washington, DC, Maryland, Pennsylvania, Virginia, and West Virginia) during 2001. To obtain prevalence estimates among 2- to 11-year-old clients of these community health centers, a 2-stage stratified sampling scheme was designed to provide stable prevalence estimates by age group (2–5 and 6 –11 years) and, within each age group, according to gender, race/ethnicity (Asian American, Hispanic, non-Hispanic black, and non-Hispanic white), and geographic areas (continental urban, continental suburban, continental rural, urban Puerto Rico, nonurban Puerto Rico, and Chinatown, NY). Community health centers were classified as urban if they were located in a county in a large (population ofⱖ1 million) metropolitan area that included all or part of the largest central city of the metropolitan area, as defined by the National Center for Health Statistics.18They were
classified as suburban if they were located in a county in a large metropolitan area but did not include part of the largest central city of the metropolitan area or if they were located in a county located in a small (population of⬍1 million) metropolitan area. Community health centers were classified as rural if they were located in a county not included in a metropolitan area. Stable prevalence estimates according to age within the sampled centers were also required so that each center could use the collected data for their own planning purpose. This information feedback was seen as one of the incentives for the centers to participate to the study. Thus, at the first stage, 30 centers were sampled (Table 1): 10 from continental urban areas (except Chinatown, NY), 7 conti-nental suburban, 7 conticonti-nental rural, 1 Puerto Rico urban, 4 Puerto Rico nonurban, and the Chinatown, NY, center. To reduce in-equalities in the probability of selection, these geographic strata were stratified further by size (number of pediatric users), with 1 to 3 centers sampled from each geographic-by-size stratum. Thir-ty-nine centers were solicited to participate to obtain 30 partici-pating centers, yielding a first-stage response rate of 77%. The 9 centers that did not participate were replaced by centers randomly selected in the same geographic-by-size stratum. At the second stage of sampling, simple random samples of children aged 1 to 4 and 5 to 12 years (HRSA data age grouping) who had consulted the center in the year of 2001 were drawn at each of the sampled centers by using centralized chart numbers grouped within these age categories. Children⬍2 and⬎11 years old were then removed from the study sample to allow comparisons with nationally rep-resentative samples of children from the National Health and Nutrition Examination Survey (NHANES). Sample sizes were
de-signed to yield⬃100 children aged 2 to 11 years for each sampled center.
Because the populations of children within the 1- to 4- and 5- to 12-year age categories who sought care at each community health center in 2001 were known, the selection probability for each sampled child could be determined as ⌸sa ⫽ 1/Cs ⫻ nsa/Nsa,
whereCsis the number of centers in geographic-by-size
substra-tums,nsais the number of children drawn in theath age group
from the sampled center, andNsais the number of children in the
ath age group at the center. Case weights equal to the inverse of the probability of selection wsa ⫽ 1/⌸sa were then computed.
Finally, poststrata consisting ofR⫽6 age⫻geographic cells were formed, and poststratification adjustments fra⫽¥s⑀rNsa/¥s⑀rwsa
were computed so that the sum of the weighted sample matched known age-geographic totals. The final weights used in the anal-ysis were then given byfwsa ⫽frawsa; these final weights were
appended to each child’s data record, where the child is a member of theath age group in thesth center.
Data Collection
All data were collected by using chart abstraction at the com-munity health center by the centers’ staff using a standardized procedure. A standardized extraction form was provided to the centers for each data record together with detailed instructions for data abstraction. Because of the wide geographic distribution of the centers, quality checks could not be performed at each center, but careful quality control was performed after data entry, and no significant patterns of mistakes were discovered. When several visits were available for a randomly selected child, the last visit in 2001 during which height was measured was selected. Clinically measured weight and height were extracted form the charts, as well as age, gender, and race/ethnicity. The extraction forms, without patient identifiers, were sent to The Children’s Hospital of Philadelphia for data entry and transferred to the University of Pennsylvania for analyses. The institutional review boards of both institutions exempted the study from approval, because no iden-tifiers were available to the investigators.
Data Analysis
Data for a total of 3579 children were obtained from the 30 participating centers; of these, 377 were dropped from the sample because they were missing age, gender, or weight information, yielding a second-stage response rate of 89%. By design, as ex-plained above, an additional 720 respondents were dropped from the analysis as ineligible based on age (⬍2 or⬎11 years of age). Finally, data from 8 subjects were removed from the analysis because they seemed to be extreme outliers with respect to height or weight for their age, biologically implausible, and probably a result of transcription errors: a height or weightz score⬎10 in absolute value or ad hoc agreement with the principal investigator that values were unrealistic. This process yielded a total of 2474 cases available for analysis. For each child, body mass index (BMI) was calculated as weight in kilograms divided by height in meters squared. A Box-Cox transformation19to normality was then
cal-culated as in the Cole LMS method,20yielding a BMIzscore and
percentile, compared with the reference population.21Height- and
weight-for-agezscores were calculated in a similar way. Children were classified as overweight if their BMI for age was ⱖ95th percentile of the Centers for Disease Control and Prevention (CDC) growth charts.21The prevalence of underweight was not
assessed, because the limited chart abstraction performed would not have allowed for differentiation of a nutritional origin from an underlying medical condition.
Of the 2474 cases used in the analysis, 606 cases were missing height data. Because the main reason for the missing data was children having had height data collected at a recent visit preced-ing the last visit of 2001, the conditions for a “misspreced-ing at random” missingness mechanism22were satisfied, that is, conditional on
the observed data elements of center, age, and weight, whether or not height was recorded was unrelated to the child’s actual height. Because of concerns about both efficiency and bias (missingness was distributed unequally across the centers, with rates ranging from 2% to 72%), a multiple imputation procedure23,24was
TABLE 1. Characteristics of the 30 Participating Community Health Centers in 2001 Location State Study Stratum Pediatric Users, n Asian Americans, % Hispanic, % Non-Hispanic Black, % Non-Hispanic White, % Migrant and Seasonal, % Below Poverty Level, %
Uninsured Pediatric Users,
each imputation, height was obtained by backtransforming the imputedzscore; imputed BMI and BMIzscores were then com-puted, and an imputed obesity indicator was obtained. A total of 20 imputed data sets were used in the analysis.
For each imputed data set, a case-weighted logistic-regression analysis estimating the logit of the probability of overweight as a function of age, gender, race/ethnicity, and/or geographic area was conducted. To account for the unequal probability of selection and clustering by center, robust Taylor-series linearization esti-mates of the logistic-regression parameter variances were calcu-lated by using SAS-callable SUDAAN Software for the Statistical Analysis of Correlated Data (Version 7.5; Research Triangle Insti-tute, Research Triangle Park, NC). The results of the analysis for each imputed data set were then combined as described by Scha-fer.24To compare community health center prevalence estimates
with nationally representative estimates according to age, gender, and ethnicity from NHANES,1zstatistics were constructed andP
values assessed under the null hypothesis of no difference be-tween the community health center estimates and the NHANES estimates. Because 18 comparisons were made between commu-nity health center and NHANES prevalence estimates, it is possi-ble that some comparisons may yield statistically significant dif-ferences by chance. A Bonferroni correction to account for multiple comparisons is given by a nominal significance level of 1
⫺␣/q, where␣is the overall test level desired andqis the number of comparisons. Hence, a Bonferroni correction would denote any comparison with aPvalue of⬍.0028 as significant at␣⫽.05.
RESULTS
Charts from 2474 children in 30 community health
centers were abstracted and used for analysis. In this
sample, 47.6% of the children were female, 4.2% were
Asian American, 33.7% were Hispanic (any race),
15.6% were non-Hispanic black, and 35.3% were
non-Hispanic white; 33.5% lived in the continental
urban area stratum (except Chinatown, NY), 21.0%
lived in suburban areas, 25.1% lived in rural areas,
3.6% lived in Chinatown, NY, 3.7% lived in urban
Puerto Rico, and 13.2% lived in nonurban Puerto
Rico. In the 2- to 5-year-old age group, 58 children
were Asian American, 439 were Hispanic, 200 were
non-Hispanic black, and 465 were non-Hispanic
white. In the 6- to 11-year-old age group, 51 children
were Asian American, 437 were Hispanic, 200 were
non-Hispanic black, and 422 were non-Hispanic
white. The prevalence of overweight was high in the
overall sample (23.0%) and in each category, with no
significant differences between genders (
P
⫽
.8),
race/ethnicity (
P
⫽
.5) (Table 2), or geographic strata
(
P
⫽
.8) (Table 3). It should be noted, however, that
TABLE 2. Prevalence of Overweight, as Defined by CDC Reference Definitions, in a Representative Sample of 2474 Children Living in a Medically Underserved Area and Seeking Care at Community Health Centers Supported by HRSA Regions II and III According to Gender, Age, and Racial/Ethnic GroupGender Age, y
All, % (95% CI)
Asian American, % (95% CI)
Hispanic, % (95% CI)
Non-Hispanic Black, % (95% CI)
Non-Hispanic White, % (95% CI)
Both genders 2–5 21.8 (19.1–24.8) 12.1 (5.6–24.0) 25.0 (20.4–30.2) 21.8 (15.8–29.3) 22.8 (17.5–29.0) 6–11 23.8 (19.6–27.7) 23.0 (12.4–39.0) 24.3 (19.9–29.3) 28.2 (21.6–36.0) 22.8 (17.9–28.7) All 23.0 (20.9–25.1) 18.2 (11.2–28.3) 24.6 (21.3–28.2) 25.6 (20.8–30.9) 22.8 (19.0–27.0) Male 2–5 22.9 (19.1–27.2) 13.8 (5.6–30.4) 28.0 (21.4–35.6) 22.4 (14.2–33.5) 22.1 (16.1–31.7) 6–11 23.3 (19.6–27.7) 33.6 (16.2–56.9) 24.8 (18.8–31.9) 24.4 (16.2–31.7) 22.1 (15.4–30.7) All 22.7 (20.0–25.7) 23.7 (13.3–38.6) 26.0 (21.5–31.2) 23.5 (17.5–30.9) 22.5 (17.4–28.5) Female 2–5 20.4 (16.7–24.7) 9.2 (2.1–32.2) 21.4 (15.7–28.6) 21.1 (13.1–32.0) 22.5 (15.1–32.1) 6–11 24.3 (20.4–28.7) 12.9 (3.8–35.8) 23.8 (17.7–31.1) 32.3 (22.4–44.2) 23.6 (16.7–32.2) All 23.2 (20.3–26.4) 11.5 (4.5–26.5) 22.9 (18.4–28.1) 27.7 (20.8–36.1) 23.1 (17.9–29.4)
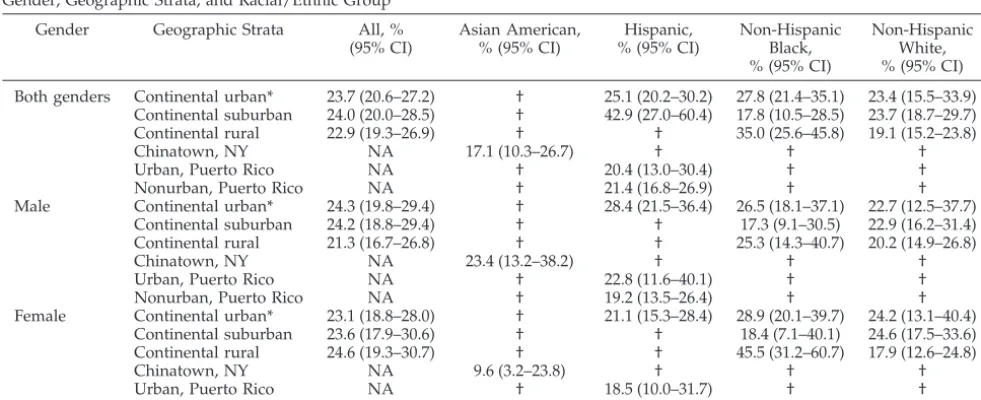
TABLE 3. Prevalence of Overweight, as Defined by CDC Reference Definitions, in a Representative Sample of 2474 Children Living in a Medically Underserved Area and Seeking Care at Community Health Centers Supported by HRSA Regions II and III According to Gender, Geographic Strata, and Racial/Ethnic Group
Gender Geographic Strata All, % (95% CI)
Asian American, % (95% CI)
Hispanic, % (95% CI)
Non-Hispanic Black, % (95% CI)
Non-Hispanic White, % (95% CI)
Both genders Continental urban* 23.7 (20.6–27.2) † 25.1 (20.2–30.2) 27.8 (21.4–35.1) 23.4 (15.5–33.9) Continental suburban 24.0 (20.0–28.5) † 42.9 (27.0–60.4) 17.8 (10.5–28.5) 23.7 (18.7–29.7) Continental rural 22.9 (19.3–26.9) † † 35.0 (25.6–45.8) 19.1 (15.2–23.8)
Chinatown, NY NA 17.1 (10.3–26.7) † † †
Urban, Puerto Rico NA † 20.4 (13.0–30.4) † †
Nonurban, Puerto Rico NA † 21.4 (16.8–26.9) † †
Male Continental urban* 24.3 (19.8–29.4) † 28.4 (21.5–36.4) 26.5 (18.1–37.1) 22.7 (12.5–37.7) Continental suburban 24.2 (18.8–29.4) † † 17.3 (9.1–30.5) 22.9 (16.2–31.4) Continental rural 21.3 (16.7–26.8) † † 25.3 (14.3–40.7) 20.2 (14.9–26.8)
Chinatown, NY NA 23.4 (13.2–38.2) † † †
Urban, Puerto Rico NA † 22.8 (11.6–40.1) † †
Nonurban, Puerto Rico NA † 19.2 (13.5–26.4) † †
Female Continental urban* 23.1 (18.8–28.0) † 21.1 (15.3–28.4) 28.9 (20.1–39.7) 24.2 (13.1–40.4) Continental suburban 23.6 (17.9–30.6) † † 18.4 (7.1–40.1) 24.6 (17.5–33.6) Continental rural 24.6 (19.3–30.7) † † 45.5 (31.2–60.7) 17.9 (12.6–24.8)
Chinatown, NY NA 9.6 (3.2–23.8) † † †
Urban, Puerto Rico NA † 18.5 (10.0–31.7) † †
Nonurban, Puerto Rico NA † 24.4 (17.1–33.5) † †
the confidence intervals (CIs) are wide and do not
exclude type II errors. The only significant subgroup
difference was observed between rural non-Hispanic
black girls (
n
⫽
53 [45.5%]) and rural non-Hispanic
white girls (
n
⫽
191 [17.9%];
P
⬍
.001). The
preva-lence of overweight ranged widely between centers
from 9.0% (95% CI: 3.8 –20.0) to 37.9% (27.7– 49.4)
(Fig 1). Compared with a nationally representative
sample of children (NHANES) measured between
1999 and 2002,
1the prevalence of overweight was
significantly higher in this sample of children using
community health centers (Table 4). Because
His-panic children from this sample were different
(mostly Puerto Rican) in many ways from Mexican
American children from NHANES, these groups
were not compared. The point estimate of the
prev-alence of overweight was above the expected
preva-lence in a general population of children of this age
distribution (13.1%) in 27 of the 30 centers (Fig 1).
DISCUSSION
The prevalence of overweight was elevated in this
population of children using community health
cen-ters and did not seem to vary by racial/ethnic group
or geographic characteristics. These results suggest
that living in medically underserved areas and using
community health centers may be a strong indicator
of the risk for pediatric obesity, perhaps even
stron-ger than other characteristics such as race/ethnicity
or geographic area. This is important information to
know when deciding how to direct limited resources
for obesity prevention and treatment to children who
are at high risk.
When compared with a nationally representative
sample of children measured during the same
peri-od,
1the children in our sample were more frequently
overweight regardless of gender or race/ethnicity.
This difference was particularly large in younger
children, suggesting an earlier onset of obesity in this
sample compared with the rest of the country. The
higher prevalence of overweight in our sample than
in the nationally representative sample could be
ex-plained by regional differences. However, smaller
surveys in the community health care setting also
described high prevalence of childhood overweight
in Los Angeles, CA,
25Washington, DC,
26and
Mich-igan.
27Our sample was based on consultations at
primary care clinics rather than being population
based, which also could partially explain the high
prevalence of overweight in our sample, because
obese children are more likely to have chronic
con-ditions, such as asthma, that require more frequent
heath care visits.
28It is likely, however, that the high
prevalence of overweight in this study is also related
to characteristics of medically underserved areas,
particularly access to care. Anticipatory guidance by
primary care providers to prevent obesity by
pro-moting healthy eating and physical activity is a
po-tentially powerful approach to prevent obesity,
29,30but it may not be as widely available in medically
Review Copy
0 5 10 15 20 25 30 35 40
Community Health Centers
Prevalence of overweight, %
Fig 1. Prevalence of overweight (per-cent), according to center, in children ages 2 to 11 years seeking care at 30 commu-nity health centers supported by the HRSA regions II and III. The horizontal line represents the expected prevalence in the general population of US children with the same age distribution.
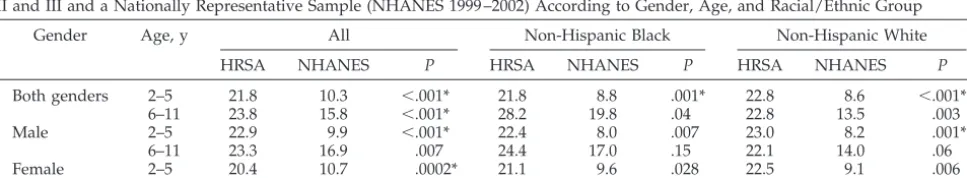
TABLE 4. Comparison in the Prevalence of Overweight, as Defined by CDC Reference Definitions, Between a Representative Sample of 2474 Children Living in a Medically Underserved Area and Seeking Care at Community Health Centers Supported by HRSA Regions II and III and a Nationally Representative Sample (NHANES 1999 –2002) According to Gender, Age, and Racial/Ethnic Group
Gender Age, y All Non-Hispanic Black Non-Hispanic White
HRSA NHANES P HRSA NHANES P HRSA NHANES P
Both genders 2–5 21.8 10.3 ⬍.001* 21.8 8.8 .001* 22.8 8.6 ⬍.001*
6–11 23.8 15.8 ⬍.001* 28.2 19.8 .04 22.8 13.5 .003
Male 2–5 22.9 9.9 ⬍.001* 22.4 8.0 .007 23.0 8.2 .001*
6–11 23.3 16.9 .007 24.4 17.0 .15 22.1 14.0 .06
Female 2–5 20.4 10.7 .0002* 21.1 9.6 .028 22.5 9.1 .006
6–11 24.3 14.7 .0003* 32.3 22.8 .13 23.6 13.1 .02
underserved areas as in more privileged areas
de-spite the fact that users of community health centers
usually receive better preventive care than other
un-insured patients.
17Additionally, areas that are
med-ically underserved may also be characterized by
poor access to healthy foods or lack of opportunities
for physical activities, defining a particularly
“obe-sogenic” environment.
12,13The wide variability in
the prevalence of overweight between centers seems
to be unrelated to racial/ethic or geographic
differ-ences between centers but may be a result of
unmea-sured variations in the environment. Although
HRSA-funded community health centers serve
com-munities that are medically underserved but not
nec-essary of low income, the populations of many of
these communities also are of low income. It is
there-fore useful to compare our findings to other studies
of low-income populations. Sherry et al
9described,
in young children participating in federally funded
programs that submit data to the Pediatric Nutrition
Surveillance System, an elevated prevalence of
over-weight that increased from 1989 to 2000. However, in
the same population, Mei et al
31did not find
signif-icant differences in the weight-for-height
z
scores
between these children and the general population of
children.
Contrary to our expectation and nationally
repre-sentative samples, no significant differences were
detected between racial/ethnic groups in our
sam-ple, which was restricted to users of community
health centers. In the most recent nationally
repre-sentative NHANES sample of 1999 –2002,
1no ethnic
difference was detected in children aged 2 to 5 years,
but among children aged 6 to 11 years, Mexican
American boys (
n
⫽
384) had a higher prevalence of
overweight than non-Hispanic white (
n
⫽
295) and
non-Hispanic black (
n
⫽
363) boys. Among girls in
the 6- to 11-year-old age group, Mexican American (
n
⫽
361) and non-Hispanic black (
n
⫽
351) girls were
more likely to be overweight than non-Hispanic
white girls (
n
⫽
281). In our sample, no differences
between ethnic groups were observed, not because of
a lower prevalence of overweight among
non-His-panic black and Hisnon-His-panic children compared with
the nationally representative sample but rather
be-cause of an elevated prevalence among non-Hispanic
white children. It is possible that the prevalence of
overweight among Hispanic and non-Hispanic black
children living in the same areas who are not users of
community health centers is even higher than the
community health center users in our sample. These
centers have been shown to be successful in
decreas-ing racial/ethnic health disparities, especially in
pre-ventive care.
14,15In this study, we identified a population of
chil-dren at high risk for obesity based on characteristics
related to the health care system rather than personal
characteristics. This finding could be particularly
useful for directing services, training, and research
resources to health care structures serving high-risk
populations. HRSA-supported community health
centers, which serve 4.7 million children,
11may be
especially appropriate points of access and settings
to deliver pediatric obesity prevention and
treat-ment, because in addition to serving a high-risk
population, their financial security depends less on
private insurers, and their primary mission is
com-munity service. The continuity of care provided by
community health centers over time
14may also
al-low long-term interventions that would not be
pos-sible in the context of managed care and frequent
insurance changes. Among uninsured Americans,
community health center users are more likely than
nonusers to have a usual source of care and more
likely to make regular medical visits.
17Therefore,
pediatric obesity interventions in this setting may be
distinctly useful, with a potentially strong public
health impact.
This study had several limitations. The
cross-sec-tional observacross-sec-tional design does not allow causal
inference. Furthermore, the health care– based
sam-pling may not have yielded a representative sample
of children living in medically underserved areas but
rather only a sample of children seeking care at
community health centers in these areas. This
limi-tation may have artificially inflated the prevalence of
obesity because of chronic conditions associated with
obesity that increase the chance of consultations. On
the other hand, families who consult for yearly
rou-tine visits, particularly those with children in the
older age group, may be healthier and less likely to
be overweight than the general population. The
sig-nificance of our results identifying a population at
risk based on health care system characteristics is
unaffected by this limitation. The lack of detected
differences between racial/ethnic groups may be the
result of a type II error, ie, an insufficient sample size
to detect an existing difference, especially in the
smaller group of Asian American children. Weight
and height data were extracted from clinical charts,
and measurements were not standardized between
centers. This may have led to misclassification of
overweight status. Weight and height, even when
measured clinically, are relatively reproducible
32;
therefore, we do not believe that this has led to a
significant bias. However, to our knowledge, clinical
measurements have not been validated to classify
children as overweight, and this constitutes a
limita-tion of the present study. Missing data are a concern
in this study, but the method we used to impute
height data relies on a missing-at-random
assump-tion, which assumes that height is independent of
missingness conditional on weight, age, gender, and
center; this generally will reduce bias when
com-pared with a complete case analysis,
22which in this
avail-able on the prevalence of overweight in the 9
non-participating centers. Therefore, we cannot assess if
this nonparticipation has resulted in a biased
esti-mate of the prevalence or if our results can be
gen-eralized to nonparticipating centers. Finally, because
of the regional sampling strategy, our findings may
not be generalized to other US regions.
This study also had unique strengths. The complex
sampling strategy provides a representative sample
of children seeking care in HRSA-sponsored
commu-nity health centers of regions II and III in 2001.
Ad-ditionally, this study provides important data on
understudied minorities, such as non-Mexican
American Hispanic children, and allows
compari-sons between geographic areas. The Youth Risk
Be-havior Surveillance System
33also provides data on
overweight prevalence by state and metropolitan
ar-eas, but these data are self-reported and limited to
adolescents.
CONCLUSIONS
This study describes a high prevalence of
over-weight in children 2 to 11 years old using community
health centers in medically underserved areas
re-gardless of race/ethnicity and geographic
character-istics. Identifying a high-risk population, based on
use of community health centers, may provide useful
information for targeting obesity prevention and
treatment to those who are most vulnerable and to
better understand the socioeconomic risk factors for
pediatric obesity.
ACKNOWLEDGMENTS
This work was supported in part by the Health Resources and Services Administration and Office of Public Health and Science (regional divisions II and III), Penn-Cheyney EXPORT Center of Excellence for Inner City Health grant P60 MD000209, and the Nutrition Center of the Children’s Hospital of Philadelphia. Dr Stettler is supported in part by National Institutes of Health grant K23 RR16073.
We thank the staff and leadership of the 30 sampled commu-nity health centers for their work and collaboration: Northwest Buffalo Community Health Care Center (Buffalo, NY); Syracuse Community Health Center (Syracuse, NY); Oak Orchard Commu-nity Health (Brockport, NY); Sunset Park Family Health (Brook-lyn, NY); William F. Ryan Community Health (New York, NY); Central Areawide Comprehensive (Naranjito, Puerto Rico); Con-cilio De Salud Integral (Loı´za, Puerto Rico); Dr Jose S. Belaval Community Health Center (San Juan, Puerto Rico); Northern Os-wego County Health (Pulaski, NY); CamCare (Camden, NJ); Charles B. Wang Chinatown Community Health Center (New York, NY); Hudson River Health Care (Peekskill, NY); Hudson Headwaters Network (Warrensburg, NY); Barceloneta Primary Health Care Services (Barceloneta, Puerto Rico); Soundview Health Center (Bronx, NY); Lares Health Center (Lares, Puerto Rico); Bronx Lebanon Integrated Services System (BLISS) (Bronx, NY); Bronx Community Health Network (Bronx, NY); Kasson Health Center (Susquehanna, PA); Rural Health Corporation of Northeast Pennsylvania (Wilkes-Barre, PA); Central Virginia Health Services (New Canton, VA); ES Rural Health System, Inc (Nassawadox, VA); Monongahela Valley Association of Health Centers (Fairmont, WV); Tug River (Gary, WV); Pendleton Com-munity Care (Franklin, WV); Tri-State ComCom-munity Health Center (Hancock, MD); Choptank (Caroline) Community Health System (Denton, MD); Baltimore Medical System, Inc (Baltimore, MD); Community Health Net (Erie, PA); and Unity Health Care, Inc (Washington, DC).
REFERENCES
1. Hedley AA, Ogden CL, Johnson CL, Carroll MD, Curtin LR, Flegal KM. Prevalence of overweight and obesity among US children, adolescents, and adults, 1999 –2002.JAMA.2004;291:2847–2850
2. Ogden CL, Flegal KM, Carroll MD, Johnson CL. Prevalence and trends in overweight among US children and adolescents, 1999 –2000.JAMA. 2002;288:1728 –1732
3. Whitaker RC, Wright JA, Pepe MS, Seidel KD, Dietz WH. Predicting obesity in young adulthood from childhood and parental obesity.
N Engl J Med.1997;337:869 – 873
4. Robinson TN. Reducing children’s television viewing to prevent obesity: a randomized controlled trial.JAMA.1999;282:1561–1567 5. Popkin BM, Udry JR. Adolescent obesity increases significantly in
sec-ond and third generation U.S. immigrants: the National Longitudinal Study of Adolescent Health.J Nutr.1998;128:701–706
6. Melnik TA, Rhoades SJ, Wales KR, Cowell C, Wolfe WS. Overweight school children in New York City: prevalence estimates and character-istics.Int J Obes Relat Metab Disord.1998;22:7–13
7. Dennison BA, Erb TA, Jenkins PL. Television viewing and television in bedroom associated with overweight risk among low-income preschool children.Pediatrics.2002;109:1028 –1035
8. Tanasescu M, Ferris AM, Himmelgreen DA, Rodriguez N, Perez-Escamilla R. Biobehavioral factors are associated with obesity in Puerto Rican children.J Nutr.2000;130:1734 –1742
9. Sherry B, Mei Z, Scanlon KS, Mokdad AH, Grummer-Strawn LM. Trends in state-specific prevalence of overweight and underweight in 2-through 4-year-old children from low-income families from 1989 through 2000.Arch Pediatr Adolesc Med.2004;158:1116 –1124
10. Troiano RP, Flegal KM. Overweight children and adolescents: descrip-tion, epidemiology, and demographics.Pediatrics. 1998;101(3 pt 2): 497–504
11. Bureau of Primary Health Care. Uniform data system calendar year 2003 data: national rollup report. 2004. Available at: www.bphc.hrsa.gov/ uds/data.htm. Accessed July 1, 2005
12. Morland K, Wing S, Roux AD, Poole C. Neighborhood characteristics associated with the location of food store and food service places.Am J
Prev Med.2001;22:23–29
13. Gomez JE, Johnson BA, Selva M, Sallis JF. Violent crime and outdoor physical activity among inner-city youth.Prev Med.2004;39:876 – 881 14. Politzer RM, Yoon J, Shi L, Hughes RG, Regan J, Gaston MH. Inequality
in America: the contribution of health centers in reducing and eliminat-ing disparities in access to care.Med Care Res Rev.2001;58:234 –248 15. Shi L, Regan J, Politzer RM, Luo J. Community health centers and
racial/ethnic disparities in healthy life.Int J Health Serv.2001;31:567–582 16. Regan J, Schempf AH, Yoon J, Politzer RM. The role of federally funded health centers in serving the rural population.J Rural Health.2003;19: 117–124; discussion 115–116
17. Carlson BL, Eden J, O’Connor D, Regan J. Primary care of patients without insurance by community health centers.J Ambul Care Manage. 2001;24(2):47–59
18. Eberhardt MS, Ingram DD, Makuc DM, et al.Urban and Rural Health
Chartbook. Health, United States, 2001. Hyattsville, MD: National Center
for Health Statistics; 2001
19. Box GE, Cox DR. An analysis of transformations.J R Stat Soc [Ser B]. 1964;B26:211–252
20. Cole TJ. The LMS method for constructing normalized growth stan-dards.Eur J Clin Nutr.1990;44:45– 60
21. Kuczmarski RJ, Ogden CL, Grummer-Strawn LM, et al. CDC growth charts: United States.Adv Data.2000;(314):1–27
22. Little RJA, Rubin DB. Statistical Analysis With Missing Data. 2nd ed. Hoboken, NJ: Wiley; 2002
23. Rubin DB. Multiple imputation for nonresponse in surveys. New York, NY: Wiley; 1987
24. Schafer JL. Analysis of incomplete multivariate data. New York, NY: Chapman & Hall; 1997
25. Hamilton JL, James FW, Bazargan M. Provider practice, overweight and associated risk variables among children from a multi-ethnic under-served community.J Natl Med Assoc.2003;95:441– 448
26. Mirza NM, Kadow K, Palmer M, Solano H, Rosche C, Yanovski JA. Prevalence of overweight among inner city Hispanic-American children and adolescents.Obes Res.2004;12:1298 –1310
27. Gauthier BM, Hickner JM, Noel MM. High prevalence of overweight children in Michigan primary care practices. An UPRNet Study. Upper Peninsula Research Network.J Fam Pract.2000;49:73–76
28. Gennuso J, Epstein LH, Paluch RA, Cerny F. The relationship between asthma and obesity in urban minority children and adolescents.Arch
29. Sallis JF, Patrick K, Frank E, Pratt M, Wechsler H, Galuska DA. Inter-ventions in health care settings to promote healthful eating and physical activity in children and adolescents.Prev Med.2000;31:S112–S120 30. Ford BS, McDonald TE, Owens AS, Robinson TN. Primary care
inter-ventions to reduce television viewing in African-American children.
Am J Prev Med.2002;22:106 –109
31. Mei Z, Grummer-Strawn LM, Scanlon KS. Does overweight in infancy
persist through the preschool years? An analysis of CDC Pediatric Nutrition Surveillance System data.Soz Praventivmed.2003;48:161–167 32. Willett W. Anthropometric measures and body composition. In: Willett W, ed. Nutritional Epidemiology. New York, NY: Oxford University Press; 1990:217–235