Medicaid and CHIP Premiums and
Access to Care: A Systematic Review
Brendan Saloner, PhD,a Stephanie Hochhalter, MPH,b Lindsay Sabik, PhDb
abstract
BACKGROUND: Premiums are required in Medicaid and the Children’s Health Insurance Program in many states. Effects of premiums are raised in policy debates.
OBJECTIVE: Our objective was to review effects of premiums on children’s coverage and access.
DATA SOURCES: PubMed was used to search academic literature from 1995 to 2014.
STUDY SELECTION: Two reviewers initially screened studies by using abstracts and titles, and 1 additional reviewer screened proposed studies. Included studies focused on publicly insured children, evaluated premium changes in at least 1 state/local program, and used longitudinal or repeated cross-sectional data with pre/postchange measures.
DATA EXTRACTION: We identified 263 studies of which 17 met inclusion criteria.
RESULTS: Four studies examined population-level coverage effects by using national survey data, 11 studies examined trends in disenrollment and reenrollment by using administrative data, and 2 studies measured additional outcomes. No eligible studies evaluated health status effects. Increases in premiums were associated with increased disenrollment rates in 7 studies that permitted comparison. Larger premium increases and stringent enforcement tended to have larger effects on disenrollment. At a population level, premiums reduce public insurance enrollment and may increase the uninsured rate for lower-income children. Little is known about effects of premiums on spending or access to care, but 1 study reveals premiums are unlikely to yield substantial revenue.
LIMITATIONS: Effect sizes were difficult to compare across studies with administrative data.
CONCLUSIONS: Public insurance premiums often increase disenrollment from public insurance and may have unintended consequences on overall coverage for low-income children.
aDepartment of Health Policy and Management, Johns Hopkins Bloomberg School of Public Health, Baltimore, Maryland; and bDepartment of Health Behavior and Policy, Virginia
Commonwealth University, Richmond, Virginia
(Medicaid OR CHIP OR S-CHIP OR SCHIP OR public insurance OR insurance program) AND (premium OR premiums) AND (children OR child OR adolescent OR adolescents OR youth OR family OR families).
Dr Saloner co-conceptualized and designed the study, reviewed primary literature, and drafted the initial manuscript; Ms Hochhalter reviewed primary literature and made critical revisions to the manuscript; Dr Sabik co-conceptualized and designed the study, selectively reviewed studies, and made critical revisions to the manuscript; and all authors approved the fi nal manuscript as submitted.
DOI: 10.1542/peds.2015-2440
Accepted for publication Dec 10, 2015
Address correspondence to Brendan Saloner, PhD, Department of Health Policy and Management, Johns Hopkins School of Public Health, 624 N Broadway, Hampton House 344, Baltimore, MD 21205. E-mail: bsaloner@jhu.edu
PEDIATRICS (ISSN Numbers: Print, 0031-4005; Online, 1098-4275). Copyright © 2016 by the American Academy of Pediatrics
FINANCIAL DISCLOSURE: The authors have indicated they have no fi nancial relationships relevant to this article to disclose. FUNDING: No external funding.
POTENTIAL CONFLICT OF INTEREST: The authors have indicated they have no potential confl icts of interest to disclose.
Premiums, periodic financial contributions required to maintain insurance benefits, are now included in many public insurance programs serving low- and moderate-income children. Premiums for children’s insurance became prominent with implementation of the 1997 Children’s Health Insurance Program (CHIP).1 CHIP was created for
children in working families with incomes too high to qualify for Medicaid. Before CHIP, most children enrolled in Medicaid were in families below the poverty line that were generally exempted from premiums.2
Under CHIP states were provided with new federal funding to expand insurance to nonpoor children by using either existing Medicaid programs, new stand-alone CHIP plans, or some combination.1 Using
this flexibility, many states created CHIP programs with benefits more closely resembling private insurance plans, and included premiums for nonpoor children.
Premiums are now permitted in both CHIP and Medicaid. The 2005 Deficit Reduction Act (DRA) increased cost-sharing, allowing Medicaid programs to charge premiums to children in households above 150% of the federal poverty line (FPL).2
Premiums can be charged at even lower income levels in CHIP. For both programs, the DRA limits total cost-sharing from premiums and copayments to 5% of the enrollee’s household income.2
The DRA exempts certain groups, including children in foster care, from premiums.3 States have also
received authority through Section 1115 demonstration waivers to charge premiums beyond DRA levels to cover higher-income children (an “optional population”) using Medicaid funding.
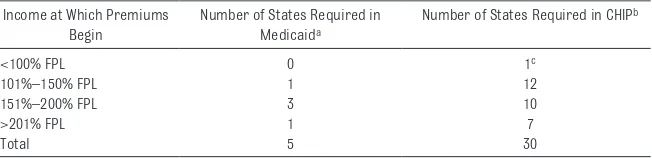
As of 2013, thirty states imposed premiums on some children in CHIP and 5 applied them in Medicaid (Table 1; states have discretion to change these premiums
year-to-year), with the majority of states imposing premiums only at incomes above 150% FPL. States with premiums in Medicaid use CHIP funds to expand traditional Medicaid to higher-income populations rather than creating stand-alone programs. Median monthly premiums ranged from $10 in states requiring premiums of populations below 150% FPL to $39 for states requiring premiums only of populations between 251% and 300% of FPL.4
Application of premiums is controversial. Opponents argue that requiring low-income families to contribute even small amounts to children’s health insurance undermines the financial protection of public insurance, discourages parents from enrolling uninsured children, leads to greater instability (“churn”) in children’s coverage,5
and introduces administrative complexities and hidden costs.6
Supporters, on the other hand, contend that premiums increase the financial stability and reach of public insurance without creating an undue burden for families, foster personal responsibility and ownership over health care use among low-income individuals, and better prepare families to ultimately enroll in private insurance where premiums are routine.7 Additionally,
premiums could limit “crowd-out”
(ie, substituting public coverage for a private alternative).8
A simple economic framework posits that premiums could affect access and wellbeing through their impact on insurance coverage. Compared with a free program, premiums introduce a cost that families must weigh against the benefits (financial protection and access to care) of having a child covered by public insurance. Although premiums are hypothesized to discourage public insurance enrollment in general, effects could be heterogeneous depending on the child’s health, the availability of private insurance alternatives, and the financial resources of the family. Premiums can alter 3 domains: coverage (eg, coverage stability and crowd-out), spending for both families and state programs, and access to health services that promote health and wellbeing. These issues will likely be raised in future policy debates over children’s insurance, as CHIP will require Congressional reauthorization to continue beyond 2017.9 There is
also interest in transitioning some CHIP populations to other coverage options under the Affordable Care Act (ACA), including insurance Marketplace plans.10 Subsidies to
purchase Marketplace plans are available for families between 100%
TABLE 1 Summary of Premiums in Medicaid and CHIP for Children, 2013
Income at Which Premiums Begin
Number of States Required in
Medicaida
Number of States Required in CHIPb
<100% FPL 0 1c
101%–150% FPL 1 12
151%–200% FPL 3 10
>201% FPL 1 7
Total 5 30
Premium amounts can vary year-to-year, so these data represent only 1 point in time and are subject to change. Source: Georgetown University Health Policy Institute, Center for Children and Families. Premium, enrollment fee, and copayment requirements for children. Available at: http:// ccf. georgetown. edu/ wp- content/ uploads/ 2012/ 04/ Cost- Sharing2. pdf. Accessed on January 11, 2016
a Maryland, Minnesota, Rhode Island, Vermont, and Wisconsin.
b Alabama, Arizona, California, Colorado, Connecticut, Delaware, Florida, Georgia, Idaho, Illinois, Indiana, Iowa, Kansas,
Louisiana, Maine, Massachusetts, Michigan, Missouri, Nevada, New Jersey, New York, North Carolina, Oregon, Pennsylvania, Texas, Utah, Vermont, Washington, West Virginia, and Wisconsin.
c In Nevada, although Medicaid covers children in families with income up to 133% FPL, some children with lower incomes
and 400% FPL, with premiums capped at 2% of household income at the low-end and 9.5% at the upper end. Experiences under CHIP thus provide guidance about effects of ACA premiums.11 Although
the effects of CHIP and Medicaid coverage on access and health have been broadly reviewed,12–14 to our
knowledge this is the first systematic review of the effects of premiums. We focus on studies related to publicly insured children, focusing on quasi-experimental studies.
METHODS
Literature Search
PubMed was searched to identify articles published between January 1995 and December 2014, a 15-year time period encompassing the implementation of CHIP (originally called the State Children's Insurance Program, or SCHIP/S-CHIP) in 1997 and the 2005 DRA. Search terms were divided into 3 groups: terms identifying children, youth, or families; terms identifying a public insurance program (Medicaid, CHIP, SCHIP, S-CHIP, insurance program, public insurance); and terms identifying premiums.* The Boolean phrase “AND” was used between groups and the phrase “OR” was used within groups.
Inclusion Criteria
Our initial search yielded 263 articles, of which 34 were deemed relevant on the basis of abstracts and titles, and 17 were ultimately found to meet study criteria. To be included in the review, studies had to report on youth under 18 enrolled in Medicaid, CHIP, or some other public insurance program (such as a county safety net insurance program); evaluate effects of a change in premiums (either an increase or decrease); and report on outcomes related to coverage and enrollment, access to care, financial burden, program expenditures, or health status. To be included, studies
needed to present an estimate specific to the effect of premiums, independent of other concurrent policy changes. Additionally, studies were required to include data on the population of children before and after the study intervention by using either longitudinal or repeated cross-sectional data. Studies using a single cross-section were excluded, because baseline data were considered necessary to evaluating possible causal effects of premium changes.
Study Selection
Two members of our team compiled an initial set of studies and removed duplicates. Authors also conducted an initial review of titles and abstracts. Potentially eligible studies were reviewed by at least 2 of the study authors. The final set of included studies was agreed upon by all study authors.
Risk of Bias
All of the studies included used quasi-experimental methods, but potential biases varied. Studies with greater potential bias were evaluations in a single state where the premium change coincided with other simultaneous policy changes, making it difficult to isolate effects of the premium change, or studies where premiums may have been implemented in response to concurrent changes in the economic environment, such as a recession, that could independently influence trends in enrollment. Bias may be present in these studies if the effect of premiums is confounded by other cooccurring trends. Furthermore, even if the premium effect is
successfully identified, this effect may not generalize to other contexts (an issue of external validity). Strongest studies were those in which it was possible to identify a policy exposing some, but not other, publicly insured children to premiums in a nearly random manner, and it was possible to compare both groups. Absent
random assignment, stronger observational studies included controls for the unemployment rate and other contextual variables. Stronger studies using administrative data also included comparison groups that reported on children in the same state that were not impacted by premium changes during the study period. Stronger observational studies using national survey data included state and year fixed effects, covariates for time-varying economic conditions, prices of private insurance premiums, income eligibility thresholds, and other public insurance policies. Stronger studies also probed sensitivity of study results for lagged effects (since short-term and long-term effects may differ) and tested alternative measures of premiums (for example discrete versus continuous measures). Overall, publication bias could exist if studies reporting a significant effect of premiums were more likely to be accepted for publication than studies reporting null effects.
Data Synthesis
in each study (not in current year dollars). It is important to note that the studies we cite are from different time periods and many of the
premium amounts reported would be substantially larger in current year dollars.
For studies on coverage dynamics with national survey data, we extracted estimates of the effects of premium changes on the share of low-income children in the population with public insurance (Medicaid or CHIP), private insurance, or uninsured. Several of these studies included simulations of the likely effects of different premium policies, typically by extrapolating the effects on different income groups by using regression coefficients. In these studies, we identified a “midrange” simulation representing a moderate premium increase, and compared percentages with each coverage type with and without premium increases. Using a midrange amount reduced possible out-of-sample extrapolations (eg, simulations that could not be supported by data) and also improved comparability. For administrative data studies, we extracted several variables related to changes in enrollment after premium changes: (1) changes in disenrollment rates; (2) changes in rates of transfers from premium to nonpremium public insurance programs; (3) changes in reenrollment rates (the probability that a child would reenter the program after a period of lapsed coverage); and (4) net change in enrollment in the premium program. Wherever possible, we recorded the time period over which changes were assessed.
An important point of differentiation across these studies is the definition of an enrollment spell (the length of time a child is enrolled in public insurance). Some administrative data studies used both Medicaid and CHIP enrollment data, so were able to differentiate between CHIP coverage
exits in which children transitioned to Medicaid coverage and exits in which the child left public coverage completely. Others used CHIP data only, so were not able to differentiate in this way. There are also differences in how studies treated censoring (ie, enrollment patterns before or after the study period), coverage gaps, and multiple spells of coverage.
For studies that considered other outcomes, we extracted estimates related to relevant outcomes, initially searching for effects on access to care, program and household spending, and financial burden within the population impacted by premiums.
RESULTS
Population Coverage Studies
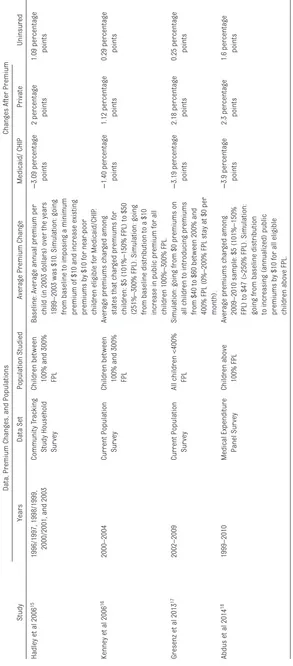
We identified 4 studies that included estimates of the effects of premium changes on the overall insurance coverage of low-income children by using multiple years of data (Table 2).15–18 Using national survey data
from 1996 to 2003, Hadley et al15
model children’s enrollment into public insurance as an effect of prevailing premiums in their state’s CHIP program versus the likely premium level of private insurance in the county predicted by using an instrumental variables technique.15
They estimate that increasing the relatively modest premiums of the early 2000s by ∼$10 (in 2003 dollars) would result in a 3 percentage point decrease in public insurance enrollment among children eligible for CHIP, with approximately one-third of these children becoming uninsured.
Using a similar approach, Kenney et al16 examine changes across states
from 1999 to 2003 with data from the Current Population Survey. Their models also account for average private insurance premium costs at the county level. They simulate that compared with no premium, a $10
per month premium (in 2003 dollars) resulted in approximately a 1.4 percentage point decrease in public coverage among children between 100% and 300% of the FPL, with approximately one-third of those children becoming uninsured. In a subanalysis, they find average effects on enrollment were more than twice that size for the segment of children between 100% and 200% of the FPL.16
Gresenz et al17 update earlier
In another recent study, Abdus et al18 use data from the 1999–2010
Medical Expenditure Panel Survey on low- and moderate-income children above the poverty line. They control for child and family fixed effects, and directly observe whether a child’s parent is offered employer-sponsored insurance. They simulate that a $10 per child premium (in 2010 dollars) would result in an average decrease in public insurance of 3.9 percentage points among eligible children, with private coverage rising by 2.3 percentage points and the child uninsured rate increasing by 1.6 percentage points. The estimated decrease in public insurance enrollment was almost twice as large when considering children between 100% and 150% FPL, and most of the decrease among the lowest-income children was simulated to result in uninsurance in households where the parent had no offer of employer-sponsored insurance.
The magnitude of the estimates from these 4 studies varies somewhat, but they consistently indicate that premiums reduce public insurance coverage and that a substantial fraction of children (perhaps two-thirds) who leave public insurance after premium increases receive private coverage. The magnitude of these effects and the degree of crowd-out varies by population segment, with lower-income children being more vulnerable to losing insurance coverage.
Studies of Program Enrollment
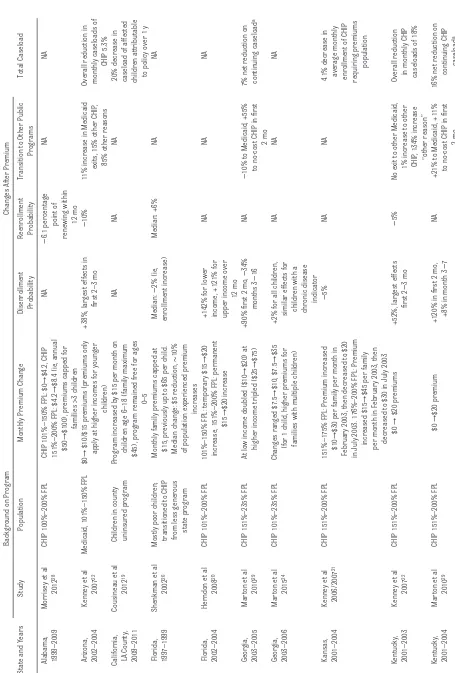
We identified 11 studies with data from 9 state programs on changes in enrollment after changes in public insurance premiums (Table 3).19–29
The majority of studies reported on children enrolled in CHIP programs with household incomes at 150% to 300% FPL. Most premium changes were increases between $5 and $20, but some changes were either partial (applying to a subset of beneficiaries)
TABLE 2
Population Studies Estimates
Data, Premium Changes, and Populations
Changes After Premium
Study
Years
Data Set
Population Studied
Average Premium Change
Medicaid/ CHIP
Private
Uninsured
Hadley et al 2006
15
1996/1997, 1998/1999, 2000/2001, and 2003
Community T
racking
Study Household Sur
vey
Children between 100% and 300% FPL Baseline: Average annual premium per child (in 2003 dollars) over the years 1999–2003 was $10. Simulation: going from baseline to imposing a minimum premium of $10 and increase existing premiums by $10 for near
-poor
children eligible for Medicaid/CHIP
.
−
3.09 percentage points 2 percentage points 1.09 percentage points
Kenney et al 2006
16
2000–2004
Current Population Sur
vey
Children between 100% and 300% FPL
Average premiums char
ged among
states that char
ged premiums for
children: $5 (101%–150% FPL) to $50 (251%–300% FPL). Simulation: going from baseline distribution to a $10 increase in public premium for all children 100%–300% FPL.
−
1.40 percentage points 1.12 percentage points 0.29 percentage points
Gresenz et al 2013
17
2002–2009
Current Population Sur
vey
All children <400% FPL Simulation: going from $0 premiums on all children to introducing premiums from $40 to $60 between 200% and 400% FPL (0%–200% FPL stay at $0 per month).
−
3.19 percentage points 2.18 percentage points 0.25 percentage points
Abdus et al 2014
18
1999–2010
Medical Expenditure Panel Sur
vey
Children above 100% FPL
Average premiums char
ged among
2009–2010 sample: $5 (101%–150% FPL) to $47 (>250% FPL). Simulation: going from baseline distribution to increasing (annualized) public premiums by $10 for all eligible children above FPL.
−
3.9 percentage points 2.3 percentage points 1.6 percentage points
Premium amounts represent per child per month for the relevant income categories. If multiple simulations were presented, we se
lected a simulation representing a moderate increase in premiums relative to a baseline (often characterized by
low premium levels). CHIP
or complete premium reductions.21,26
Effect sizes were typically reported as hazard ratios, reflecting changes in monthly disenrollment risk relative to baseline rates over a discrete period of time (such as 12 months after a premium change). However, some studies reported changes on total caseload, reflecting changes in both entries and exits from the program, or reported changes over a different time period. Regardless of unit of measurement or time horizon, direction of association was generally consistent across studies. Premium increases were generally associated with disenrollment (7 studies revealed such reductions)16,20–22,24,27,29 and
premium reductions were associated with increased retention.21,26
Effect sizes were difficult to directly compare across studies but, qualitatively, several factors appear to be associated with larger disenrollment effects. Disenrollment was higher when premiums were new (as opposed to increases to existing premiums) and when premiums were more stringently enforced, including lockout periods (preventing reenrollment for a time interval after nonpayment) and prompt termination of benefits for nonpayment. For example, both Kansas and Kentucky imposed $20 per family per month premium increases in 2003, but in Kentucky the premium was new and accompanied by prompt termination of benefits, whereas in Kansas the policy was an increase of an existing premium with no benefits termination for 12 months. Premiums had no significant effect on disenrollment in Kansas, but increased disenrollment hazards 28% in Kentucky in the first year of the program.21
Enrollment responses to the same premium change may also differ depending on the child’s health status, because parents of children with elevated health care needs may
be willing to pay more to maintain public insurance coverage. Two studies reveal a lower disenrollment rate among children with physical or mental chronic diagnoses compared with healthy children,20,26 whereas
1 study reveals no difference in effect,24 1 study reveals that
disenrollment rates were actually higher among children with chronic illness,28 and 1 study reveals that
the response varies depending on the child’s chronic condition (with a significantly lower disenrollment change for families with children with intellectual disability but higher for asthma).27 The evidence
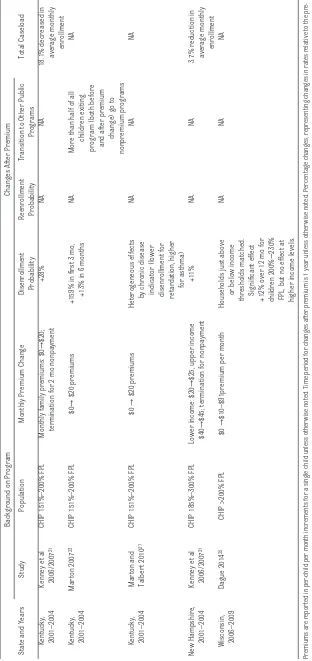
is mixed about whether greater premium amounts lead to higher disenrollment; for example, the disenrollment effect was larger for moderate income children in Kansas than in Kentucky (net premium changes of $20), but other program features also differed. A study using Wisconsin data that matched households just above or below income thresholds that trigger higher premiums reveals that although small premiums reduced enrollment compared with zero dollars, premium increases did not affect enrollment at higher income levels.25
Not all children that disenroll from CHIP programs with premiums leave public insurance; some may become eligible for nonpremium (ie, “free”) CHIP or Medicaid,
mitigating the effects of premiums on disenrollment. This eligibility change could theoretically arise through a strategic response from parents to maintain an income low enough to stay in a program not requiring premiums (sometimes known as “the welfare notch”)25,30 or through
families being motivated to update their eligibility determination after income decreases. In a simulation, for every 3 additional children disenrolling from CHIP programs requiring premiums in the year after a premium increase in Georgia, 1 child would subsequently enroll in
Medicaid29; large effects on other
public program enrollment have also been found in studies of children exiting CHIP in Kentucky and Arizona.22,29
Studies on Cost, Access, and Wellbeing
We identified 1 study (also reported as a program enrollment study) that explicitly considered program spending as an outcome. Using data from Arizona and Kentucky, the study reveals that premium revenues, on their own, account for little savings (recovering 0.5%– 2.0% of total costs in a best case scenario).22 Larger program savings
result from decreased spending on children who drop CHIP coverage requiring premiums. However, the savings from spending less on children who drop CHIP coverage requiring premiums are mitigated by the fact that some of these children subsequently enroll in nonpremium Medicaid.
Premiums directly increase family health care spending, but it is unclear to what extent they might increase financial hardship. We did not identify any studies that compared overtime changes in self-reported financial insecurity or medical debt after changes in premiums.
Effects on access to care have also not been extensively studied. We only identified 1 study that met our criteria examining an access outcome. This study examines a premium forgiveness program in Idaho that waived premium requirements for families who maintain
recommended well-child visits and immunizations.31 This policy, which
TABLE 3
Studies on Premium Changes and Program Enrollment
Background on Program
Changes After Premium
State and Years
Study
Population
Monthly Premium Change
Disenrollment Probability Reenrollment Probability
Transition to Other Public
Programs
Total Caseload
Alabama, 1999–2009
Morrisey et al
2012
28
CHIP 100%–200% FPL
CHIP 101%–150% FPL: $0
→
$4.2, CHIP
151%–200% FPL: $4.2
→
$8.4 (ie, annual
$50
→
$100), premiums capped for families >3 children
NA − 6.1 percentage point of renewing within 12 mo NA NA
Arizona, 2002–2004
Kenney et al
2007
22
Medicaid, 101%–150% FPL
$0
→
$10/$15 premiums (premiums only apply at higher incomes for younger
children)
+38%, lar
gest effects in
fi
rst 2–3 mo
−
10%
11% increase in Medicaid
exits, 15% other CHIP
,
85% other reasons
Overall reduction in monthly caseloads of
CHIP 5.3%
California, LA County, 2009–2011
Cousineau et al
2012
19
Children in county uninsured program
Program increased by $15 per month on
children age 6–18 (family maximum $45), program remained free for ages
0–5
NA
NA
NA
20% decrease in caseload of affected children attributable to policy over 1 y
Florida, 1997–1999
Shenkman et al
2002
26
Mostly poor children; transitioned to CHIP from less generous
state program
Monthly family premiums capped at $15, previously up to $65 per child. Median change: $5 reduction,
∼
10%
of population experienced premium
increases Median: − 2% (ie, enrollment increase) Median: +6% NA NA
Florida, 2002–2004
Herndon et al
2008
20
CHIP 101%–200% FPL
101%–150% FPL: temporary $15
→
$20
increase, 151%–200% FPL: permanent
$15
→
$20 increase
+142% for lower income, +121% for upper income over
12 mo NA NA NA Geor gia, 2003–2005 Mar
ton et al 2010
29
CHIP 151%–235% FPL
At low income doubled ($10
→
$20) at
higher income tripled ($25
→
$75)
+90% fi
rst 2 mo,
− 34% months 3 − 16 NA −
10% to Medicaid, +55% to no-cost CHIP in fi
rst
2 mo
7% net reduction on continuing caseload
a
Geor
gia,
2003–2006
Mar
ton et al 2015
24
CHIP 101%–235% FPL
Changes ranged $7.5
→
$10, $7.5
→
$35
(for 1 child, higher premiums for families with multiple children) +2% for all children, similar effects for
children with a chronic disease
indicator
NA
NA
NA
Kansas, 2001–2004 Kenney et al 2006/2007
21
CHIP 151%–200% FPL
151%–175% FPL: Premium increased
$10
→
$30 per family per month in
February 2003, then decreased to $20 in July 2003. 176%–200% FPL: Premium
increased $15
→
$45 per family
per month in February 2003, then decreased to $30 in July 2003
−
5%
NA
NA
4.1% decrease in average monthly enrollment of CHIP requiring premiums
population
Kentucky, 2001–2003
Kenney et al
2007
22
CHIP 151%–200% FPL
$0 → $20 premiums +52%, lar gest effects fi rst 2 − 3 mo − 5%
No exit to other Medicaid,
1% increase to other CHIP
, 134% increase
“other reason”
Overall reduction in monthly CHIP caseloads of 18%
Kentucky, 2001–2004
Mar
ton et al 2010
29
CHIP 151%–200% FPL
$0
→
$20 premium
+120% in fi
rst 2 mo,
+8% in month 3
−
7
NA
+21% to Medicaid, +11% to no-cost CHIP in fi
rst
2 mo
16% net reduction on
continuing CHIP
caseload
Background on Program
Changes After Premium
State and Years
Study
Population
Monthly Premium Change
Disenrollment Probability Reenrollment Probability
Transition to Other Public
Programs
Total Caseload
Kentucky, 2001–2004 Kenney et al 2006/2007
21
CHIP 151%–200% FPL
Monthly family premiums: $0
→
$20;
termination for 2 mo nonpayment
+28%
NA
NA
18.1% decreased in
average monthly
enrollment
Kentucky, 2001–2004
Mar
ton 2007
23
CHIP 151%–200% FPL
$0
→
$20 premiums
+159% in fi
rst 3 mo,
+13% in 6 months
NA
More than half of all
children exiting
program (both before and after premium
change) go to
nonpremium programs
NA
Kentucky, 2001–2004
Mar
ton and
Talber
t 2010
27
CHIP 151%–200% FPL
$0
→
$20 premiums
Heterogeneous effects
by chronic disease indicator (lower disenrollment for retardation, higher
for asthma)
NA
NA
NA
New Hampshire,
2001–2004
Kenney et al 2006/2007
21
CHIP 185%–300% FPL
Lower income: $20
→
$25, upper income
$40
→
$45; termination for nonpayment
+11%
NA
NA
3.7% reduction in average monthly
enrollment
Wisconsin, 2006–2009
Dague 2014
25
CHIP >200% FPL
$0
→
$10–$91premium per month
Households just above
or below income
thresholds matched. Signifi
cant
effect
+12% over 12 mo for children 200%
−
230%
FPL, but no effect at higher income levels.
NA
NA
NA
Premiums are repor
ted in per
-child per month increments for a single child unless other
wise noted. Time period for changes afte
r premium is 1 year unless other
wise noted. Percentage changes, representing changes in rates relative to the
pre-premium period, are often conver
ted hazard ratios (eg, hazard ratio 2.0 = +100% relative increase). NA, not applicable. The "
→
" symbol indicates a time-varying increase.
a Continuing caseload estimates do not refl
ect new entries into the program, only changes in baseline population.
TABLE 3
the effects of conventional premium programs on access or wellbeing.
DISCUSSION
This article reviews the effects of premiums in CHIP and Medicaid on enrollment, access to care, spending, and related outcomes among low-income children. Across studies, premium increases are generally associated with reduced enrollment in premium insurance programs20,22,27,29 and decreases
are associated with enrollment increases.21,26 Premiums that are
more stringently enforced and premiums that are newly added (rather than increases of existing premiums) are associated with larger declines in enrollment.21 Some,20,26
but not all,28 studies reveal that
children with chronic illnesses are less likely to disenroll after premium increases. Despite these effects, the overall effects of premiums on the child uninsured rate are mixed. For lower-income children, raising premiums may increase the uninsured rate, but at higher incomes premium increases may result in substitution to private insurance without a substantial increase in the child uninsured rate.16–18
Beyond the question of whether premiums increase the uninsured rate, the impact of premiums on other child and family outcomes is uncertain. We did not identify any studies meeting our study criteria (ie, use of pre- and postdata and methodology to isolate premium effects from other program changes) that evaluated effects of premiums on outcomes related to financial burden or health status. Such studies are challenging to conduct because state administrative data are not typically linked to data sets that include these measures. Only 1 study, examining a particular program in Idaho that offered premium forgiveness for check-up visits, has linked premiums to a utilization measure.31 This
finding is important because it may relate to an area of growing experimentation under the ACA, tying financial incentives to health and wellness behaviors.7 However, there
is not yet evidence about whether traditional premium programs (without incentives) have any effects on health care utilization.
The only study to evaluate potential budgetary impacts of premiums suggests they raise little revenue relative to program spending, and may create other administrative costs.22 Cost-savings that are
generated from premium programs appear to largely derive from reduced enrollment in public insurance. For policymakers, an important question is whether families discouraged by premium programs ultimately enroll children in other forms of coverage, because some policymakers may find it desirable to use premiums to reduce crowd-out. This issue is also of growing importance, because some states have used premium programs to extend coverage to children in higher income families (essentially creating a Medicaid buy-in option for households that are in middle- or higher-income families, as in Wisconsin).25
These findings have implications for pediatric providers. Providers can play an important role in educating low-income families about public insurance premiums that apply in their state. Premiums may be an unfamiliar concept to low-income families, especially those with limited experience with private insurance. Knowledge of premiums can help pediatric providers to assist families with enrollment in public programs. Partnerships between providers and state programs can also enhance awareness of when premium changes will take effect, because changes in premiums can increase the risk of children losing insurance coverage. Finally, pediatricians can play a role as advocates for low-income families
in presenting state policymakers with first-hand evidence on the impact of premiums on access to care.
Our review indicates some important evidence gaps. Research on
premiums could be strengthened by consistently reporting levels and changes in premium amounts, relative and absolute parameters representing changes in enrollment, and time periods over which changes were observed. A lack of consistent reporting of these measures decreased comparability of findings across studies. To improve comparability, program enrollment studies should consistently report changes in 1-year hazard rates relative to preperiods, and if possible separate rates for transitions out of public insurance versus transitions to other public programs. There is a dearth of research on the impact of premiums on access to care, health status, and financial burden, and on longer-term effects of premium programs (beyond 1 year). Such studies would fill a critical gap necessary for complete policy evaluation of premium programs. Cost–benefit analyses that include administrative costs would also enhance the evidence base.
CONCLUSIONS
Although evidence indicates that premiums reduce public insurance enrollment for children overall,15–18
effects across subgroups are complex and vary by other features of programs. One study suggests that premiums produce little direct revenue compared with average program costs.22 Less is
access to care or are as affordable as CHIP.32 If the objective of premiums
is to encourage specific health-related behaviors, more targeted use of premiums may be warranted. For example, using premium forgiveness as an incentive to increase wellness activities could be an effective tool, but there is a dearth of empirical evidence on the impact of such programs. Researchers should continue to evaluate new premium arrangements, including premiums that apply to children receiving coverage through the ACA.
ACKNOWLEDGMENT
The authors thank Victoria Powell, MD, for assistance reviewing the literature.
ABBREVIATIONS
ACA: Affordable Care Act CHIP: Children’s Health
Insurance Program DRA: Deficit Reduction Act FPL: federal poverty line
REFERENCES
1. Georgetown University Center for Children and Families. About CHIP. Washington, DC: Georgetown University Center for Children and Families; 2014
2. Georgetown University Center for Children and Families. Cost Sharing for Children and Families in Medicaid and CHIP. Washington, DC: Georgetown University Center for Children and Families; 2009
3. The Defi cit Reduction Act of 2005: An overview of key Medicaid provisions and their implications for early childhood development services. Available at: www. commonwealthfund. org/ publications/ fund- reports/ 2006/ oct/ the- defi cit- reduction- act- of- 2005–an- overview- of- key- medicaid- provisions- and- their- implications- for. Accessed June 21, 2015
4. Rudowitz R, Samantha A, Arguello R. Children’s health coverage: Medicaid,
CHIP and the ACA. Washington, DC: Kaiser Family Foundation; 2014. Available at: http:// kff. org/ health- reform/ issue- brief/ childrens- health- coverage- medicaid- chip- and- the- aca/ . Accessed February 23, 2015
5. Sommers BD. Why millions of children eligible for Medicaid and SCHIP are uninsured: poor retention versus poor take-up. Health Aff (Millwood). 2007;26(5):w560–w567
6. Families USA. Increasing Cost-Sharing in Medicaid: A Bad Solution to Budget Issues. Washington, DC: Families USA; 2012
7. Saloner B, Sabik L, Sommers BD. Pinching the poor? Medicaid cost sharing under the ACA. N Engl J Med. 2014;370(13):1177–1180
8. Gruber J, Simon K. Crowd-out 10 years later: have recent public insurance expansions crowded out private health insurance? J Health Econ. 2008;27(2):201–217
9. Oberlander J, Jones DK. The children’s cliff—extending CHIP. N Engl J Med. 2015;372(21):1979–1981
10. Rosenbaum S. Searching for a child health policy in a post-reform world.
Milbank Q. 2014;92(3):438–441 11. McMorrow S, Kenney GM, Anderson
N, et al. Trade-offs between public and private coverage for low-income children have implications for future policy debates. Health Aff (Millwood). 2014;33(8):1367–1374
12. Howell EM, Kenney GM. The impact of the Medicaid/CHIP expansions on children: a synthesis of the evidence.
Med Care Res Rev. 2012;69(4):372–396 13. Bitler MP, Zavodny M. Medicaid: a
review of the literature. National Bureau of Economic Research, Inc; 2014. Available at: https:// ideas. repec. org/ p/ nbr/ nberwo/ 20169. html. Accessed February 23, 2015
14. Chiu T, Hudak ML, Snider IG, et al Medicaid Policy Statement. Pediatrics. 2013;131(5). Available at: www. pediatrics. org/ cgi/ content/ full/ 131/ 5/ e1697
15. Hadley J, Reschovsky JD, Cunningham P, Kenney G, Dubay L. Insurance premiums and insurance coverage of near-poor children. Inquiry. 2006-2007;43(4):362–377
16. Kenney G, Hadley J, Blavin F. Effects of public premiums on children’s health insurance coverage: evidence from 1999 to 2003. Inquiry. 2006-2007;43(4):345–361
17. Gresenz CR, Edgington SE, Laugesen MJ, Escarce JJ. Income eligibility thresholds, premium contributions, and children’s coverage outcomes: a study of CHIP expansions. Health Serv Res. 2013;48(2 pt 2):884–904 18. Abdus S, Hudson J, Hill SC, Selden
TM. Children’s Health Insurance Program premiums adversely affect enrollment, especially among lower-income children. Health Aff (Millwood). 2014;33(8):1353–1360
19. Cousineau MR, Tsai K-Y, Kahn HA. Two responses to a premium hike in a program for uninsured kids: 4 in 5 families stay in as enrollment shrinks by a fi fth. Health Aff (Millwood). 2012;31(2):360–366
20. Herndon JB, Vogel WB, Bucciarelli RL, Shenkman EA. The effect of premium changes on SCHIP enrollment duration.
Health Serv Res. 2008;43(2):458–477 21. Kenney G, Allison RA, Costich JF, Marton
J, McFeeters J. Effects of premium increases on enrollment in SCHIP: fi ndings from three states. Inquiry. 2006-2007;43(4):378–392
22. Kenney G, Marton J, McFeeters J, Costich J. Assessing potential enrollment and budgetary effects of SCHIP premiums: fi ndings from Arizona and Kentucky. Health Serv Res. 2007;42(6 pt 2):2354–2372
23. Marton J. The impact of the introduction of premiums into a SCHIP program. J Policy Anal Manage. 2007;26(2):237–255
24. Marton J, Ketsche PG, Snyder A, Adams EK, Zhou M. Estimating premium sensitivity for children’s public health insurance coverage: selection but no death spiral. Health Serv Res. 2015;50(2):579–598
25. Dague L. The effect of Medicaid premiums on enrollment: a regression discontinuity approach. J Health Econ. 2014;37:1–12
27. Marton J, Talbert JC. CHIP premiums, health status, and the insurance coverage of children. Inquiry. 2010;47(3):199–214
28. Morrisey MA, Blackburn J, Sen B, et al. The effects of premium changes on ALL Kids, Alabama’s CHIP program. Medicare Medicaid Res Rev. 2012;2(3):mmrr.002.03.a01
29. Marton J, Ketsche PG, Zhou M. SCHIP premiums, enrollment, and expenditures: a two state, competing risk analysis. Health Econ. 2010;19(7):772–791
30. Yelowitz AS. The Medicaid notch, labor supply, and welfare participation: evidence from eligibility expansions. Q J Econ. 1995;110(4):909–939
31. Kenney GM, Marton J, Klein AE, Pelletier JE, Talbert J. The effects of Medicaid and CHIP policy changes on receipt of preventive care among children. Health Serv Res. 2011;46(1 pt 2):298–318
DOI: 10.1542/peds.2015-2440 originally published online February 19, 2016;
2016;137;
Pediatrics
Brendan Saloner, Stephanie Hochhalter and Lindsay Sabik
Medicaid and CHIP Premiums and Access to Care: A Systematic Review
Services
Updated Information &
http://pediatrics.aappublications.org/content/137/3/e20152440
including high resolution figures, can be found at:
References
http://pediatrics.aappublications.org/content/137/3/e20152440#BIBL
This article cites 25 articles, 4 of which you can access for free at:
Subspecialty Collections
http://www.aappublications.org/cgi/collection/federal_policy_sub
Federal Policy
_sub
http://www.aappublications.org/cgi/collection/child_health_financing
Child Health Financing
http://www.aappublications.org/cgi/collection/advocacy_sub
Advocacy
following collection(s):
This article, along with others on similar topics, appears in the
Permissions & Licensing
http://www.aappublications.org/site/misc/Permissions.xhtml
in its entirety can be found online at:
Information about reproducing this article in parts (figures, tables) or
Reprints
http://www.aappublications.org/site/misc/reprints.xhtml
DOI: 10.1542/peds.2015-2440 originally published online February 19, 2016;
2016;137;
Pediatrics
Brendan Saloner, Stephanie Hochhalter and Lindsay Sabik
Medicaid and CHIP Premiums and Access to Care: A Systematic Review
http://pediatrics.aappublications.org/content/137/3/e20152440
located on the World Wide Web at:
The online version of this article, along with updated information and services, is
by the American Academy of Pediatrics. All rights reserved. Print ISSN: 1073-0397.