Health Care Utilization and Expenditures Associated With Child Care
Attendance: A Nationally Representative Sample
Michael Silverstein, MD*‡; Anne E. Sales, PhD§; and Thomas D. Koepsell, MD, MPH*
储
ABSTRACT. Objective. Participation in center-based child care among preschool-aged children is associated with an increased incidence of communicable illness. Although estimates of health care utilization and costs associated with child care attendance exist in other coun-tries with different health care systems, nationally rep-resentative data for the United States are lacking. The objective of this study was to determine the patterns of health care utilization and costs associated with atten-dance at different types of child care, among a nationally representative sample of preschool-aged children.
Methods. A nationally representative sample of chil-dren aged 0 to 5 years enrolled in the Medical Expendi-ture Panel Survey, 1997 Cohort were studied. Data were analyzed by cross-sectional analysis within a single cal-endar year. The Rand Health Insurance experiment 2-part multivariate regression model was used to accommodate skewed expenditure data.
Results. A total of 871 children were included in the study. A total of 484 (56%) attended no child care pro-vided by anyone other than their primary caregiver; 134 (15%) attended center-based child care; 76 (9%) attended friend or neighbor care; and 170 (20%) attended in-home or relative care. In a weighted multivariate model, chil-dren in center-based child care were more likely than those not in child care to have attended at least 1 office-based visit (adjusted odds ratio [aOR]: 2.8; 95% confi-dence interval [CI]: 1.0 –7.9) and emergency department visit (aOR: 2.0; 95% CI: 1.1–3.6) and to have received a medication prescription (aOR: 2.8; 95% CI: 1.2– 6.1). The adjusted 2-part model predicted total health care expen-ditures for those not attending child care to be $642 (95% CI: 508 – 813), versus $985 (95% CI: 714-1336) for a similar population in center-based child care. Expenditure data for office-based visits and medication prescriptions mir-rored these trends.
Conclusion. In the immediate term, children in cen-ter-based child care tend to use more health care services. This increased utilization translates into modest per-child differences in health care expenditures. We hypoth-esize that this pattern of utilization and expenditure is attributable primarily to a higher incidence of minor, self-limited, communicable illness among children in center-based child care. Pediatrics 2003;111:e371–e375. URL: http://www.pediatrics.org/cgi/content/full/111/4/ e371;child care, children, costs, expenditures, utilization, Medical Expenditure Panel Survey.
ABBREVIATIONS. MEPS, Medical Expenditure Panel Survey; FPL. federal poverty level; CI, confidence interval; aOR, adjusted odds ratio.
M
ore than half of all preschool-aged children
in the United States attend out-of-home
child care.
1Numerous studies have
de-scribed an increased incidence of viral illness
associ-ated with center-based child care and preschool
at-tendance—primarily upper respiratory infection and
diarrhea.
2,3Such illness, although typically
self-lim-ited, is responsible for a large number of physician
visits, missed parental workdays, and medication
prescriptions.
4,5Attendance at child care centers has
also been associated with other, more significant
en-tities such as hepatitis,
6injuries,
7and chronic otitis
media.
8,9Center-based child care, however, has become a
necessity in the United States, as single-parent and
dual-income families currently constitute a
signifi-cant proportion of American households.
Further-more, educational child care has proven social and
educational benefits for both medically fragile
10 –12and low-income children.
13–18Participation in
cen-ter-based child care has also been reported to protect
against subsequent illness, presumably through
ac-quired immunity.
19,20Characterizing the immediate
and long-term costs and benefits of different types of
child care is therefore important from both family
and societal standpoints.
Although increased disease incidence associated
with child care attendance has been characterized, it
is unclear the extent to which this increased disease
burden translates into increased health care
utiliza-tion and costs. In 1989, Bell et al
21reported increased
hospitalization rates, physician office visits, and total
health care costs among child care attendees enrolled
in a single prepaid health plan; however, their
anal-ysis failed to adjust for other potential contributors to
these outcomes. More recent studies have described
child care-associated health care costs in Canada
22and Finland.
23Recent, nationally representative data
for the United States, however, are lacking.
Using the 1997 Medical Expenditure Panel Survey
(MEPS), we sought to characterize health care
utili-zation and expenditures among a nationally
repre-sentative sample of 0- to 5-year-old children
attend-ing 1) center-based child care, 2) child care provided
in a separate private home (termed friend/neighbor
care), and 3) child care provided by a relative, as
contrasted with 4) those attending no child care
pro-From the *Robert Wood Johnson Clinical Scholars Program andDepart-ments of ‡Pediatrics, §Health Services, and储Epidemiology, University of Washington, Seattle, Washington.
Received for publication Aug 26, 2002; accepted Nov 12, 2002.
Reprint requests to (M.S.) Robert Wood Johnson Clinical Scholars Program, University of Washington, H-220 Health Sciences Center, Box 357183, Se-attle, WA 98195. E-mail: msilve@u.washington.edu
vided by anyone other than the child’s primary
care-giver.
METHODS Data Source
We extracted data from the household component of the 1997 and 1998 MEPS. MEPS is a project of the Agency for Healthcare Research and Quality and draws from a nationally representative sample of noninstitutionalized, nonmilitary Americans to estimate utilization and expenditures of inpatient, outpatient, emergency, and pharmacy services. MEPS’s subjects are followed for 2 years with regular face-to-face interviews; information is verified by cross-checking claims and utilization data.
Sample
We restricted our study sample to the 1997 MEPS Panel 2 (approximately half of the full 1997 cohort) because only these subjects were asked questions regarding child care arrangements. We further restricted our sample to children aged 0 to 5 and selected only the youngest child from each household. To this sample of 871 children, we merged the 1998 MEPS Household Component variables that reflected child care attendance in 1997. We eliminated 1 extreme outlier from the analysis, whose 1997 total health care expenditures of nearly $100 000 were unsup-ported by any corresponding explanatory diagnosis from the MEPS diagnostic file, and were therefore considered an error.
Child Care Exposure
Respondents were asked whether any of the children in the household required child care arrangements other than school attendance during 1997 because their primary caregiver was working.24If so, they were asked whether the child was usually in
the care of a relative or nonrelative. Those who responded non-relative were then asked about child care settings. Because the above questions were asked specifically with reference to the youngest child in the home, we selected only this child from each household. We grouped child care exposure into 4 mutually ex-clusive categories: 1) no child care; 2) center-based child care, including child care centers, preschools/nursery schools, and be-fore/after school programs; 3) friend/neighbor care, including care provided by a nonrelative at a private home other than the child’s; and 4) relative/home care, including care provided by a nonrelative in the home or a relative in any setting.
Child Data
We extracted the following data on each subject: age, insurance status (dichotomized as uninsured all year or not), Medicaid sta-tus (dichotomized relative to ever receiving publicly funded health insurance in 1997), number of people in the home, poverty status (categorized as⬍100% federal poverty level [FPL], 100% to
⬍125% FPL, 125% to⬍200% FPL, 200% to⬍400% FPL, 400% or greater FPL), and the child’s parent-perceived health status. In addition, we used a dichotomized measure created by MEPS to reflect the presence of any physical or social limitations. This variable was based on whether the child had any limitations in activity or play, or required any special schooling as a result of physical or mental impairment.
Parent/Guardian Data
We linked each subject to an adult (⬎16 years old) guardian who, by definition, lived in the same home as the child. In cases in which the subject’s mother was identified as living in the house-hold, we assigned guardian status to the mother (biological, adop-tive, or step). When the mother was not identified, we assigned guardian status to the father, and then to the household reference person, defined as the individual who either owned or rented the home.
The following data were collected on each guardian: age, edu-cation (dichotomized relative to having a high school diploma), and employment status (operationalized as having no job all year, different jobs over the year, or the same job continuously all year). We considered families to be marital dual-parent when the guard-ian indicated a marital partner living at home. (Because of
limita-tions of the MEPS data, we were unable to define cohabitating, nonmarried parents or caregivers.)
Health Care Utilization and Expenditures
Our primary outcome measure was total 1997 health care ex-penditures. We also extracted data individually for office-based, emergency department, inpatient, and prescription drug utiliza-tion and expenditures. MEPS defines expenditures as the sum of direct payments for care provided, including both out-of-pocket and insurance payments.25
Data Analysis
We used the individual level weights from the MEPS data to yield valid national estimates.26On weighted data, we performed
a cross-sectional analysis of 1997 expenditures using the Rand Health Insurance experiment 2-part model.27 We selected the
2-part model because of its accuracy in accommodating expendi-ture data in which 1) a large proportion of subjects have no expenditures, 2) the distribution among those with nonzero ex-penditures is skewed to the right but can be nearly normalized with log transformation, and 3) assumptions of linearity pertain-ing to ordinary least squares regression are typically violated.28,29
Variables were selected for inclusion in the model because of their documented or theoretical relevance to the outcomes of interest. We used model diagnostics to check the model’s validity.
Part I: Multivariate Logistic Regression
We estimated a weighted logistic regression model to predict the probability of incurring any health care expenditure or utili-zation in 1997 for each of the health care domains listed above.
Part II: Multivariate Linear Regression
Only children with nonzero expenditures were selected and were modeled using the natural logarithm of expenditures as the outcome variable. This part of the model predicted expenditures conditional on whether the individual used any health care ser-vices. Adjusted cost ratios were obtained from the exponentiated regression coefficients. For later combination with the results of part I, the weighted predictions were then retransformed from log dollars to dollars using Duan’s smearing estimator,30which uses
regression residuals to control for retransformation biases. We used both the homoscedastic and heteroscedastic versions of the smearing estimator where appropriate.31,32
Assembling the 2-Part Model
The 2 model parts were recombined by multiplying the results of part I (probability of incurring any expenditure) by the results of part II (predicted expenditure conditional on any utilization), yielding an individual’s predicted total health care expenditures. We used the 2-part model to make adjusted expenditure estimates among a standardized population (the no child care group) for center-based child care, friend/neighbor care, and relative/home care.
Confidence Intervals
Ninety-five percent confidence intervals (CIs) on the final esti-mates were calculated by bootstrapping the full 2-part model 1000 times on weighted data for each of the outcome categories.33We
performed all analyses using Stata 7.0. Because MEPS is a public use data set devoid of unique identifiers, the University of Wash-ington granted official exemption from institutional board review.
RESULTS
Sample Description by Child Care Group
diploma (94% vs 70%) and less likely to have parents
unemployed all year (6% vs 43%). A slightly lower
proportion of children in center-based child care
came from marital dual-parent households (71% vs
77%).
Unadjusted Outcomes
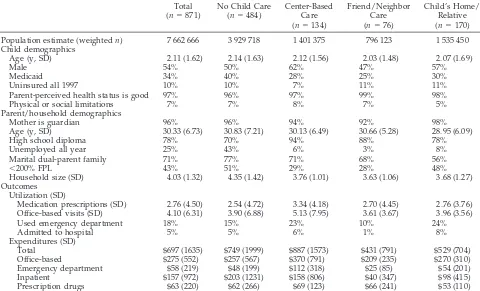
In an unadjusted analysis, children in center-based
care incurred the greatest mean total health care
expenditures ($887) in 1997 of all of the child care
exposure categories (Table 1). This trend held
indi-vidually for office-based, emergency department,
and prescription drug expenditures. Utilization for
each health care delivery site followed the same
pat-tern.
Adjusted Likelihood of Utilization
We estimated a weighted multivariate logistic
re-gression model for likelihood of any utilization for
each of the health care delivery sites (Table 2).
Chil-dren in center-based child care were more likely to
have at least 1 office-based (adjusted odds ratio
[aOR]: 2.8; 95% CI: 1.0 –7.9) or emergency
depart-ment (aOR: 2.0; 95% CI: 1.1–3.6) visit than children
out of child care. These children were also more
likely to receive a medication prescription (aOR: 2.8;
95% CI: 1.2– 6.1). There was no statistically
signifi-cant difference in the likelihood to have an inpatient
admission across child care groups.
2-Part Model
The results of the 2 parts of the model are shown
individually in Table 3. Within each of the health
care delivery sites, the odds of having any
expendi-tures differed slightly from the odds of having any
utilization because of uncompensated care. Among
children with nonzero health care expenditures,
those attending center-based child care had
in-creased total health care expenditures relative to
those not in child care (adjusted cost ratio: 1.48; 95%
CI: 1.04 –2.12; Table 3).
Using the no child care group as a standard
pop-TABLE 1. Sociodemographic Features and Health Care Expenditures of MEPS’s Preschool-Aged Children by Child Care Type*
Total (n⫽871)
No Child Care (n⫽484)
Center-Based Care (n⫽134)
Friend/Neighbor Care (n⫽76)
Child’s Home/ Relative (n⫽170)
Population estimate (weightedn) 7 662 666 3 929 718 1 401 375 796 123 1 535 450
Child demographics
Age (y, SD) 2.11 (1.62) 2.14 (1.63) 2.12 (1.56) 2.03 (1.48) 2.07 (1.69)
Male 54% 50% 62% 47% 57%
Medicaid 34% 40% 28% 25% 30%
Uninsured all 1997 10% 10% 7% 11% 11%
Parent-perceived health status is good 97% 96% 97% 99% 98%
Physical or social limitations 7% 7% 8% 7% 5%
Parent/household demographics
Mother is guardian 96% 96% 94% 92% 98%
Age (y, SD) 30.33 (6.73) 30.83 (7.21) 30.13 (6.49) 30.66 (5.28) 28.95 (6.09)
High school diploma 78% 70% 94% 88% 78%
Unemployed all year 25% 43% 6% 3% 8%
Marital dual-parent family 71% 77% 71% 68% 56%
⬍200% FPL 43% 51% 29% 28% 48%
Household size (SD) 4.03 (1.32) 4.35 (1.42) 3.76 (1.01) 3.63 (1.06) 3.68 (1.27)
Outcomes Utilization (SD)
Medication prescriptions (SD) 2.76 (4.50) 2.54 (4.72) 3.34 (4.18) 2.70 (4.45) 2.76 (3.76) Office-based visits (SD) 4.10 (6.31) 3.90 (6.88) 5.13 (7.95) 3.61 (3.67) 3.96 (3.56)
Used emergency department 18% 15% 23% 10% 24%
Admitted to hospital 5% 5% 6% 1% 8%
Expenditures (SD)
Total $697 (1635) $749 (1999) $887 (1573) $431 (791) $529 (704)
Office-based $275 (552) $257 (567) $370 (791) $209 (235) $270 (310)
Emergency department $58 (219) $48 (199) $112 (318) $25 (85) $54 (201)
Inpatient $157 (972) $203 (1231) $158 (806) $40 (347) $98 (415)
Prescription drugs $63 (220) $62 (266) $69 (123) $66 (241) $53 (110)
SD indicates standard deviation. * Table represents weighted estimates.
TABLE 2. AORs for Having Any Utilization in Weighted Logistic Regression Model*
Health Care Delivery Site
No Child Care
Center-Based Care
Friend/ Neighbor Care
Child’s Home/ Relative
Office-based reference 2.8 (1.0–7.9)† 2.2 (0.8–6.4) 2.1 (0.9–4.5) Emergency department reference 2.0 (1.1–3.6) 0.7 (0.3–1.8) 1.5 (0.8–2.9) Inpatient reference 1.9 (0.8–4.9) 0.4 (0.1–2.8) 1.8 (0.7–5.0) Prescription drugs reference 2.8 (1.2–6.1) 1.1 (0.6–2.2) 1.5 (0.8–2.5)
* Adjusted for gender, household size, child’s and parent’s age, poverty status, insurance and Medicaid status, health perception, presence of social or physical limitations, marital dual-parent family, parental education, and employment.
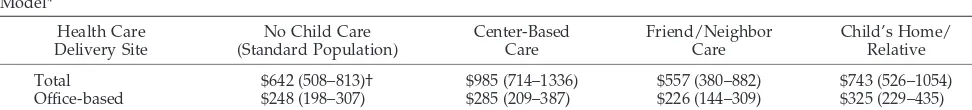
ulation, the 2-part model predicted adjusted mean
total health care expenditures for children in
center-based child care to be $985 (95% CI: $714 –$1336),
compared with $642 (95% CI: $508 –$813) for those
out of child care (Table 4). Expenditures for
office-based visits and prescription drugs showed trends in
the same direction. Because hospital admission and
emergency department visits were relatively rare
events and the number of children included in the
sample was fairly small, the 2-part model was unable
to predict these expenditures accurately.
DISCUSSION
Among this nationally representative sample of
preschool-aged children, we found that attendance
at center-based child care was associated with
in-creased utilization of health care services relative to
children not in child care. Specifically, children in
center-based child care were 2 to 3 times more likely
to use any emergency department, office-based, or
pharmacy services than nonattendees. This increased
utilization translated into an estimated difference of
$343 per child in total annual health care
expendi-tures.
Our results are consistent with previously
pub-lished reports concerning child care-associated
health care utilization. Previous studies reporting
health care costs, however, have done so in the
con-text of international health care systems different
from the United States’ or among children within a
single health maintenance organization. Our study is
the first to address the issue of cost with an adjusted
analysis among a nationally representative US
pop-ulation.
On the basis of this and other studies, we
hypoth-esize that increased use of health care services among
child care attendees reflects a combination of causes.
Foremost is a higher incidence of minor
communica-ble illness among these children. In addition, child
care policies that require physician authorization for
symptomatic children to return to the center, as well
as a theoretical tendency among working parents to
seek medical care more promptly for their children
(so that they may return to work), may augment the
repercussions of this increased disease burden.
Although children in center-based child care tend
to use more health care services, these services—for
a predominantly healthy population—are relatively
inexpensive or rare. As a result, a proportional
in-crease in health care expenditures for these children
is not seen. In our study, the $343 per-child
differ-ence in total health care expenditures between those
in center-based child care and those not in child care
reached only borderline statistical significance.
Our study was limited by a number of factors. The
high variability of expenditure data demands large
sample sizes to demonstrate statistically significant
differences. Because we had a relatively small
sam-ple, our study was likely unable to detect modest
differences in health care expenditures across child
care groups. Therefore, the borderline significant
in-crease in total health care expenditures from $642
among nonattendees to $985 among center-based
at-tendees and the increase in prescription drug
expen-ditures from $42 to $73 likely represent authentic, if
modest, differences in health care expenditures.
Sample size limitations also precluded an analysis
of possible effect modification by age. Previous
re-TABLE 3. AORs and Cost Ratios on Expenditure Data for Individual Parts of the 2-Part Model*
Healthcare Delivery Site
No Child Care
Center-Based Care
Friend/Neighbor Care
Child’s Home/ Relative
Part I: adjusted odds of having any health care expenditure
Total Reference 1.9 (0.6–5.8)† 2.7 (0.7–9.6) 1.4 (0.6–3.3)
Office-based Reference 2.6 (1.0–6.7) 2.4 (0.9–6.5) 1.6 (0.8–3.2)
Emergency department Reference 1.9 (1.0–3.5) 0.7 (0.3–1.9) 1.6 (0.9–3.1)
Inpatient Reference 1.9 (0.7–4.7) 0.4 (0.1–2.6) 1.8 (0.7–5.1)
Prescription drugs Reference 2.7 (1.2–6.1) 1.1 (0.6–2.2) 1.5 (0.8–2.5)
Part II: adjusted cost ratios among children with non-zero health care expenditures
Total Reference 1.48 (1.04–2.12) 0.82 (0.55–1.23) 1.14 (0.81–1.57)
Office-based Reference 1.06 (0.78–1.45) 0.84 (0.61–1.16) 1.25 (0.96–1.62)
Prescription drugs Reference 1.36 (0.91–2.03) 1.61 (1.06–2.45) 1.20 (0.81–1.77)
* Adjusted for gender, household size, child’s and parent’s age, poverty status, insurance and Medicaid status, health perception, presence of social or physical limitations, marital dual-parent family, parental education, and employment.
† Parentheses represent 95% CIs on weighted data.
TABLE 4. Adjusted Health Care Expenditures Predicted in Dollars Among a Standardized Population, as Predicted by the 2-Part Model*
Health Care Delivery Site
No Child Care (Standard Population)
Center-Based Care
Friend/Neighbor Care
Child’s Home/ Relative
Total $642 (508–813)† $985 (714–1336) $557 (380–882) $743 (526–1054)
Office-based $248 (198–307) $285 (209–387) $226 (144–309) $325 (229–435)
Prescription drugs $42 (29–56) $73 (45–114) $70 (42–119) $56 (35–87)
* Adjusted for gender, household size, child’s and parent’s age, poverty status, insurance and Medicaid status, health perception, presence of social or physical limitations, marital dual-parent family, parental education, and employment.
ports have suggested that the increased disease
bur-den of children in center-based child care is carried
disproportionately by those under 2 years of age.
34Because of sample size limitations, we were unable
to analyze these children separately. Similarly,
be-cause emergency department and inpatient use both
are relatively rare among children, our sample left
the linear regression portion (part 2) of the 2-part
model with too few nonzero observations to
calcu-late these outcomes accurately.
MEPS’s exposure and outcome measurements
in-troduce 2 final limitations to the study. First, MEPS
fails to account for either hours per week of child
care attendance or number of children in each child
care setting—2 factors that are known to be
associ-ated with disease transmission in this context.
35This
limitation likely introduces a conservative bias by
underestimating differences in cost and utilization
associated with being in full-time child care. Second,
although emergency department and prescription
drug utilization can be attributed justifiably to an
increased disease burden associated with child care
attendance, the increased use of office-based services
may reflect, in part, better adherence to well-child
care guidelines among children enrolled in child care
centers.
Although children in center-based child care tend
to use more health care services than nonattendees,
these differences are insufficient to cause
propor-tional increases in associated health care
expendi-tures. Assuming that the $343 dollar differential in
health care expenditures between child care
attend-ees and nonattendattend-ees represents a true difference,
center-based child care attendance does seem to
carry a modest per-child societal cost. Its costs,
how-ever, must be viewed in the context of its known
benefits—particularly those involving early
child-hood development, socialization, immune system
maturation, and parent job flexibility.
ACKNOWLEDGMENTS
We thank David Grossman, MD, MPH, and Richard Deyo, MD, MPH, for input and feedback; Chuan-Fen Liu, PhD, for method-ologic expertise; Alex Chen, MD, and Alison Galbraith, MD, for generous assistance; and Frederick Rivara, MD, MPH, and Kari Hironaka, MD, MPH, for thoughtful review of the manuscript.
REFERENCES
1. Shonkoff JP, Phillips DA, eds.From Neurons to Neighborhoods: The Science of Early Childhood Development. Washington, DC: National Academy Press; 2001
2. Nafstad P, Hagen J, Oie L, Magnus P, Jaakkola J. Day care centers and respiratory health.Pediatrics. 1999;103:753–758
3. Louhiala PJ, Jaakkola N, Ruotsalainen R, Jaakkola JJ. Day-care centers and diarrhea: a public health perspective.J Pediatr. 1997;131:476 – 479 4. Rasmussen F, Sundelin C. Use of medical care and antibiotics among
preschool children in different day care settings.Acta Paediatr Scand. 1990;79(8 –9):838 – 846
5. Skull SA, Ford-Jones EL, Kulin NA, Einarson TR, Wang EE. Child care center staff contribute to physician visit and pressure for antibiotic prescription.Arch Pediatr Adolesc Med. 2000;154:180 –183
6. Hurwitz ES, Deseda CC, Shapiro CN, Nalin DR, Freitg-Koontz MJ, Hayashi J. Hepatitis infections in the day-care setting.Pediatrics. 1994; 94:1023–1024
7. Solomons HC, Elardo R. Rates of injury at day-care centers.JAMA. 1993;269:2734 –2735
8. Wald ER, Dashefsky B, Byers C, Guerra N, Taylor F. Frequency and severity of infections in day care.J Pediatr. 1988;112:540 –546 9. Hardy AM, Fowler MG. Child care arrangements and repeated ear
infections in young children.Am J Public Health. 1993;83:1321–1325 10. The Infant Health and Development Program. Enhancing the outcomes
of low-birth-weight, premature infants.JAMA. 1990;263:3035–3042 11. Brooks-Gunn J, McCarton CM, Casey PH, et al. Early intervention in
low-birth-weight premature infants: results through age 5 years from the Infant Health and Development Program. JAMA. 1994;272: 1257–1262
12. McCarton CM, Brooks-Gunn J, Wallace IF, et al. Results at age 8 years of early intervention for low-birth-weight premature infants: the Infant Health and Development Program.JAMA. 1997;277:126 –132 13. Schweinhart LJ, Barnes HV, Wiekart DP.Significant Benefits: The High/
Scope Perry Preschool Study Through Age 27. MI: High/Scope Press; 1993 14. Campbell FA, Ramey CT. Effects of early intervention on intellectual and academic achievement: a folup study of children from low-income families.Child Dev. 1994;65(2 Spec No):684 – 698
15. Reynolds AJ, Temple JA, Robertson DL, Mann EA. Long-term effects of an early childhood intervention on educational achievement and juve-nile arrest.JAMA. 2001;285:2339 –2346
16. Lally JR, Mangione PL, Honig AS.Long-Range Impact Of An Early Intervention With Low-Income Children and Their Families.San Francisco, CA: Center for Child & Family Studies, Far West Lab for Educational Research and Development; 1997
17. Johnson DL, Walker T. A follow-up evaluation of the Houston Parent-Child Development Center: school performance.J Early Interv. 1991;15: 226 –236
18. Zoritch B, Robert I, Oakley A. Day care for preschool children.Cochrane Database Syst Rev.
19. Ball TM, Holberg CJ, Aldous MB, Martinez FD, Wright AL. Influence of attendance at day care on the common cold from birth through 13 years of age.Arch Pediatr Adolesc Med. 2002;156:121–126
20. Kramer U, Heinrich J, Wjst M, Wichmann HE. Age of entry to day nursery and allergy in later childhood.Lancet. 1999;353:450 – 454 21. Bell DM, Gleiber DW, Mercer AA, et. al. Illness associated with child
day care: a study of incidence and cost.Am J Public Health. 1989;79: 479 – 484
22. Carabin H, Gyorkos T, Soto J, Penrod J, Joseph L, Collet J. Estimation of direct and indirect costs because of common infections in toddlers attending day care centers.Pediatrics. 1999;103:556 –564
23. Nurmi T, Salminen E, Ponka A. Infections and Other illnesses of chil-dren in day-care centers in Helsinki II: the economic losses.Infection. 1991;19:331–335
24.Documentation for the Medical Expenditure Panel Survey 1998 Full Year Consolidated Data File. Rockville, MD: Agency for Healthcare Research and Quality; 2001 (MEPS file HC-028; p C45)
25.Documentation for the Medical Expenditure Panel Survey 1998 Full Year Consolidated Data File. Rockville, MD: Agency for Healthcare Research and Quality; 2001 (MEPS file HC-028; p C55)
26. Cohen SB.Sample Design of the 1997 Medical Expenditure Panel Survey Household Component. Rockville, MD: Agency for Healthcare Research and Quality; 2000 (MEPS Methodology Report 11; AHRQ publication 01-0001)
27. Brook RH, Ware JE Jr, Rogers WH, et al. Does free care improve adults’ health? Results from a randomized controlled trial. N Engl J Med. 1983;309:1426 –1434
28. Lumley T, Diehr P, Emerson S, Chen L. The importance of the normality assumption in large public health data sets.Annu Rev Public Health. 2002;23:151–169
29. Chen AY, Chang RR. Factors associated with prescription drug expen-ditures among children: an analysis of the medical expenditure panel survey.Pediatrics. 2002;109:728 –732
30. Duan N. Smearing estimate: a nonparametric retransformation method.
J Am Stat Assoc. 1983;78:605– 610
31. Manning WG. The logged dependent variable, heteroscedasticity, and the retransformation problem.J Health Econ. 1998;17:283–295 32. Ai C, Norton EC. Standard errors for the retransformation problem with
heteroscedasticity.J Health Econ. 2000;19:697–718
33. Efron B, Tibshirani RJ.An Introduction to the Bootstrap. Boca Raton, FL: Chapman and Hall/CRC; 1998
34. The National Institute of Child Health and Human Development Early Child Care Research Network. Child care and common communicable illnesses.Arch Pediatr Adolesc Med. 2001;155:481– 488