India’s Vulnerability to Oil Shocks
Ashutosh Kumar P. Neelameham
UG Student Associate Professor
Department of Petroleum Engineering Department of Petroleum Engineering Excel College of Engineering & Technology Excel College of Engineering & Technology
S. Arvind Magesh Pandian V. Shankar
UG Student UG Student
Department of Petroleum Engineering Department of Petroleum Engineering Excel College of Engineering & Technology Excel College of Engineering & Technology
G. Divakar UG Student
Department of Petroleum Engineering Excel College of Engineering & Technology
Abstract
This paper examines the trends and patterns in oil shocks and India’s vulnerability to shocks in supply and prices at the national and international levels. First examining the definitions and international experiences of crude oil volatility, a qualitative approach is taken to examine the impact of volatility on major indicators. This paper takes a broad definition of volatility looking at demand, supply and speculation In addition, a manifestation of the country’s dependence on oil and its reflection through different economic and physical indicators such as share of oil in the energy basket, importance of crude oil and petroleum products in the trad e balance and the patterns of trade in the recent years is also examined to understand the extent of vulnerability to shocks. It has been found that the vulnerability to these is expected to rise in the future as dependence on imported oil is projected to rise. Finally, based on international experience, measures to mitigate this vulnerability have been recommended. The case study is organized according to four subsystems of the socio-economic system, namely: energy; transport; agriculture & macro-economy. Each of the four major sections includes a brief overview of the subsystem, an analysis of its oil dependency, and a discussion of the likely impacts of oil shocks under business-as-usual policy environments.
Keywords: Energy, Transport, Agriculture, Macro-economy, Volatility, and Oil Shocks
________________________________________________________________________________________________________
I. INTRODUCTION
This Paper is based on Indian case study of oil dependencies and vulnerabilities to oil price and supply shocks. India had a Gross Domestic Product (GDP) per capita of $1 420 in 2011, which places it in the lower-middle income country category of the World Bank. Additional indicators for development measured by the World Bank, such as primary school enrolment, life expectancy at birth and carbon dioxide emissions also demonstrate that India is representative of the lower-middle income country category. However, India represents a unique case within this income category in that the country exhibits consistent economic growth despite a slowing global economy. In addition, India has the second largest population in the world and according to the World Bank (2012) the third largest economy when measured in purchasing power party terms. India is increasingly dependent on imports for its growing energy needs. In 2010, India was relying on imported oil for more than 70% of total oil consumption.
The population of the country as per the provisional figures of Census of India (2011) is 1210.19 million. With more than 1.2 billion people, India is the world’s largest democracy. The country has emerged as a global economic player over the last decade. Economic growth has translated into a substantial decline in poverty. According to official Government of India estimates, poverty declined from 37.2% in 2004-05 to 29.8% in 2009-10. In 2009, India was the fourth largest energy consumer in the world, after USA, China and Russia (EIA, 2011), and the third largest crude oil consumer in the Asia-Pacific region after China and Japan (MOSPI, 2012)
The fall in oil prices in the second half of 2014 is expected to result—absent a change in other macroeconomic conditions—in a boost to global economic activity in 2015–16. But the specifics depend on a number of factors, with complex interactions.
II. ABBREVIATIONS
ASEAN Association of Southeast Asian Nations BPCL Bharat Petroleum Corporation Limited bpd barrels per day
DES Directorate of Economics and Statistics DGFT Directorate General of Foreign Trade EIA Energy Information Administration FAO Food and Agriculture Organization GQ Golden Quadrilateral Highway Project GVA Gross Value Added
HPCL Hindustan Petroleum Corporation Limited IEA International Energy Agency
IMF International Monetary Fund IPA Indian Ports Authority JVC Joint Venture Company MJ mega joules
MMTOE million tons of oil equivalent MOF Ministry of Finance
MORTH Ministry of Road Transport and Highways MOS Ministry of Shipping
MPNG Ministry of Petroleum and Natural Gas MRTS Mass Rapid Transit Systems
MT million tons
NELP New Exploration License Policy NFSM National Food Security Mission NHAI National Highways Authority of India NPOI National Portal of India
NRAA National Rain-fed Area Authority OIFC Overseas Indian Facilitation Centre
OVL Oil and Natural Gas Corporation Videsh Limited RPL Reliance Petroleum Limited
TFEC Total Final Energy Consumption TJ terra joules
TPES Total Primary Energy Supply WPI Wholesale Price Index
III. ENERGY
This section presents an overview of the energy system and the role of oil products in India. It begins with a summary of global energy scenario, energy scenario in India, primary sources of energy supply, energy carriers and final consumption (demand) by major sectors, i.e. the national energy balance. The focus is then narrowed to the supply and demand for oil and petroleum products. Oil supply is discussed in terms of sources (imports and domestic production), The final subsection briefly considers the likely impacts of oil shocks on the energy system.
Global Energy Scenario:
The global energy landscape is currently undergoing significant changes as alternative hydrocarbon sources are evolving as major contributors to the energy basket. Simultaneously, an impetus to increase the share of renewable energy sources (particularly in Europe) to address climate concerns is also contributing to an increase in the share of these low carbon source in the overall energy mix. Based on the data from the International Energy Agency (IEA), oil production is expected to rise to 98 million barrels per day (mbpd) by 2035. Most of this increase is projected to be in the production of natural gas liquids and unconventional oil. The production of coal is also expected to increase in this period and reach 6300 million tons of coal equivalents (mtce). The largest increase is, however, expected to be in the production of natural gas which will register a growth of 47% and reach 5 trillion cubic meters (tcm), largely on account of growing unconventional natural gas production in North America (USA and Canada)
Energy Scenario in India:
Primary Energy Supply:
India’s energy mix comprises of both non-renewable sources (coal, lignite, petroleum, natural gas and nuclear power) and renewable energy sources (wind, solar, small hydro, biomass, cogeneration bagasse, etc.). Displays the evolution of India’s primary energy supply mix between 1990 and 2010.
Since 1996 coal has been the dominant fuel for primary energy, growing from 32% of TPES in 1990 to more than 41% in 2010. Oil’s share also rose marginally to 25% in 2003 from 19% in 1990, and has remained consistently above 23% since 2003. The share of gas has more than doubled over the two decades, starting at just over 3% in 1990 and contributing 7.6% in 2010. The combined shares of nuclear, hydro and renewables (solar, wind, etc.) have never exceeded 3%, while the share of combustible renewables and waste (e.g. wood, used for cooking and heating) has declined significantly from 42% in 1990 to 24.6% in 2010. While the total primary energy requirement registered an average annual growth rate of 4% between 1990-91 and 2009-10, the primary commercial energy requirement registered an average annual growth rate of 5.68% during the same period.
Final Energy Consumption:
Primary energy sources (e.g. oil) are converted into energy carriers (e.g. petroleum fuels), which are then consumed by end users. Petroleum products and combustible materials have contributed significant shares of final energy, while the share of electricity has nearly doubled during 1990-2010. Over the period, the direct use of coal has remained above 16%, after recovering from a decrease to almost 10% in 2000-2001. By 2010, petroleum accounted for over 28% of final energy consumption, a marginal increase from 20.9% in 1990. In 2010, natural gas 7 accounted for a five percent share, which is expected to grow with the discovery of new gas deposits (IEA, 2012).
Coal and petroleum account for a large share (about 44%) of India’s final energy consumption. Combustible renewables and waste constitute about one third of Indian energy use. The large share of non-commercial energy sources include traditional fuels like wood, cow dung and crop residues, a large proportion of which is used by predominantly rural households for their thermal and cooking needs. This is indicative of India’s lower middle income country status.
Source: IEA (2012)
Fig. 1: Shares of total primary energy supply
Supply of Oil:
In India, more than 70% of crude oil consumption and part of the petroleum products demand is met through imports (MOSPI, 2012). India imported more than 3.2 million barrels per day (bpd) of crude oil, or 163.59 million tones (MT), during 2010-11 (MOSPI, 2012). India produced roughly 950 thousand bpd of total liquids in 2010, of which 750 thousand bpd was crude oil (or 37.7 MT) (EIA, 2011; MOSPI, 2012). During 2011-12, production of crude oil is estimated at 38.19 MT, which is about 1.33 per cent higher than during 2010-11 (MOF, 2012). India’s crude oil reserves stood at 5.7 billion barrels as of January 2011, the second largest in the region after China (EIA, 2011).
Displays India’s total annual production, consumption and imports of oil (crude oil plus refined petroleum products) from 1984 to 2010. Domestic production has remained below 1 million barrels per day (bpd) during the period, while consumption has more than trebled. Production levels barely cater to a quarter of the petroleum products demand and the remaining oil requirements are met by imported crude. Despite recent government efforts to deregulate the hydrocarbons industry, state owned enterprises dominate the Indian oil sector, with the Oil and Natural Gas Corporation (ONGC) accounting for nearly three-quarters of oil production in the country (EIA, 2011).
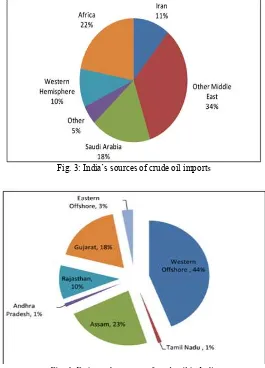
In 2010, the majority of India's crude oil imports came from the Middle East, with Saudi Arabia (18%) and Iran (11%) providing the largest individual shares (EIA, 2011). The share of India’s oil imports supplied by Iran has decreased in recent years (down from 16% in 2008), largely due to US sanctions to deter foreign investment in Iran (EIA, 2011). In order to continue undisrupted crude oil supply from Iran, India will pay for 45% of its transactions in rupee terms, as per recent trade negotiations, which Iran can use to buy commodities and products from India.
Fig. 3: India’s sources of crude oil imports
Fig. 4: Estimated reserves of crude oil in India
Likely Impact of Oil Shocks on the Energy System:
Oil’s share in TPES (23%) and over 28% of final energy consumption in 2010, of which more than 70% is imported, threatens the country’s growth through international oil price and supply shocks. Other things being equal, rising oil prices will at some point begin to gradually dampen demand and result in less petroleum energy being consumed in the country, especially in the longer term. The prices of other energy sources, especially those that are to some extent or other substitutable for oil – such as coal and gas – are likely to rise along with the oil price. These price rises will in turn put upward pressure on the price of electricity, since coal is the feedstock for about 70% of national power generation. According to Coal India Ltd., transportation of coal by railways to coal-fired power stations currently suffers from severe infrastructural bottlenecks, while mining regions also suffer from poor road connectivity. The costs of upgrading infrastructure for increased production of coal-based thermal power will increase to some extent as a result of rising fuel costs. Buying or manufacturing, transporting and installing renewable energy infrastructure, including wind turbines and solar panels, will also increase due to higher petroleum fuel costs. The rising cost of alternative energy sources illustrates their dependence on an economic infrastructure that is itself dependent on oil. Thus there will be added upward pressure on electricity prices. However, the rising cost of fossil fuel energy will make renewable energy (RE) sources relatively more competitive and is likely to stimulate investment in this sector. Increased production of RE technologies could deliver economies of scale and learning, and hence reduce their prices, setting off a positive feedback loop. Thus over the longer term, one can expect a process of (partial) substitution of renewable energy for oil and coal.
Acute physical shortages of oil products, which could arise from time to time owing to global supply interruptions, could have more serious consequences than gradually rising (or volatile) energy costs. Strategic oil reserves are meant to alleviate concern over security of oil supplies in emergency situations such as conflict, natural calamities or a sudden spike in the international price of oil. India does not have very large strategic oil reserves which makes the economy highly vulnerable to oil supply disruptions. Significantly, a sudden interruption of liquid fuel supplies could worsen the flow of coal to power stations, since more than 70% of railway freight (the preferred form of coal transportation in the country) runs on diesel, and further disrupt electricity generation. As it is, India suffers from a severe shortage of electricity generation capacity, linked to coal shortages. Power outages would in turn hamper the refining of petroleum fuels and their distribution through pipelines and at retail outlets, thus setting in motion a self-reinforcing feedback loop with very adverse consequences.
The current governance of the energy sector in the Indian political system poses a significant challenge in that multiple decision-making structures are in existence, with the potential to diffuse policies to deal with high vulnerability to oil price and supply shocks. The Government of India has a Ministry of Power, a Ministry of Coal, a Ministry for Petroleum and Natural Gas and a Ministry of New and Renewable Energy. Effective coordination among these various ministries will be essential to deal with energy security threats in the medium to long term.
IV. TRANSPORT
Effective transport systems are essential for the conduct of local, regional and international commerce and trade, and mobility is an important determinant of human welfare.
Oil Dependence of the Transport System:
The transport sector utilized about 17% of total final energy consumed in India in 2005-06. Within the transport sector itself, energy consumption is equally distributed between passenger and freight transportation. 95% of the energy consumed (3400 peta joules) is derived from petroleum products, of which 75% is derived from diesel, 19% from petrol and 1% from jet fuel (Ghate and Sundar, 2011). CNG and electricity each contribute only 1% of energy to the transport sector. Road transport dominates energy consumption with 85.5% of petroleum fuels and 90% of all energy (Ghate and Sundar, 2011). ‘Increase of car ownership is considered the main driver of increasing energy use in the transport sector due to its high level of energy demand per passenger-km’. Energy consumption in railways was approximately 5.1% of total transport energy, and was comprised of 77.5% diesel and the balance, electricity. During 2004-05, the consumption of aviation fuel increased from 0.98 MT (1976-77) to 6.2 MT in 2005-06, with more than a 24% increase in the number of international and domestic flights. Clearly, the transport sector is overwhelmingly dependent on liquid petroleum fuels, i.e. petrol, diesel and jet fuel.
V. AGRICULTURE
Agriculture, which is classified as one of the primary economic sectors, is quantitatively and qualitatively, one of the most important sectors of the Indian economy. It provides livelihood to more than 58% of the population and is the back-bone of several industries. Agriculture and allied sectors contributed nearly 17% of GDP during 2008-09.
Oil Dependence of Agriculture:
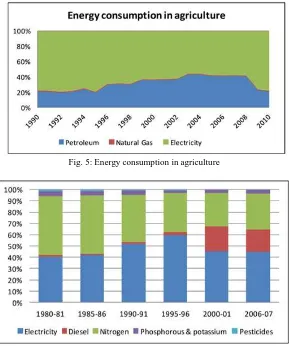
over 20% of the energy used by the agricultural sector was in the form of liquid petroleum fuels, while electricity contributed 78% and natural gas just under 2%. However, between 2003 and 2008, the share of petroleum fuels rose to more than 40% of total energy used in the agricultural sector. The sharp decline in the share of petroleum fuels from 2008 may be a data anomaly, as it is unlikely for energy use patterns to change so rapidly.
Production of food grains is the main driver of energy consumption in the Indian agricultural sector. Underlying the trend of increasing energy consumption in the food grain sector is a shift in the structure of direct energy use, away from animal and human labor towards increased reliance on electricity and petroleum. Electricity, used for water pumping for irrigation, is a major input to Indian agricultural activity. In 2004, electricity represented just over 50% of final energy use in the sector and accounted for 22% of all final electricity consumed in the country. Liquid petroleum fuels – especially high speed diesel –are used to power farm vehicles and machinery such as tractors, threshers and pumps.
Fig. 5: Energy consumption in agriculture
Fig. 6: Sources of commercial energy use in Indian agriculture
Likely Impact of Oil Shocks on Agriculture:
would have to compete with freight companies and private operators of passenger transport. Fuel shortages would also have a negative impact on the distribution of farming products to processing facilities and markets in towns and cities. India already suffers from a poor food distribution system, which is given as the leading cause of high levels of malnutrition among the country’s poor, despite self-sufficiency in the production of food staples.
VI. MACRO-ECONOMY
The evolution of the broad structure of the Indian economy between 1950 and 2010 which shows the relative components of the Gross Domestic Product by the eight one-digit economic sectors. The most significant shift has been the decline in the relative importance of agriculture and allied activities, from over 52% of GDP in 1950 to 17.7% in 2010. The largest gains were in transport, trade and communication (more than doubling in relative size from 10% in 1950 to 25% in 2010), construction (3% to 8%), electricity, gas and water (0.2% to 1.7%) and mining (from less than one percent in 1950 to 2.7% in 2010). Community services grew from 11% of the GDP to 14%, while finance and business services grew from 13% to 16% in 2010. Manufacturing has also increased significantly, from 10.6% to 14.5% of GDP. The services sector now holds a 55% share of the GDP, and includes trade, hotels and restaurants; transport, storage and communication; financing, insurance, real estate, and business services; and community, social and personal services, as per National Accounts classification of services Agriculture is the second largest sector while mining is the second smallest sector. Overall, the economy is dominated by agriculture in terms of employment and the services sector in terms of relative share of the GDP.
Likely Impact of Oil Shocks on the Macro-Economy:
The direct impacts of oil price shocks occur via higher fuel prices and have reverberations on several important macroeconomic variables. India is a price taker on the international oil market, but exercises discretion in passing on international oil price shocks to domestic prices. Domestically, the downstream liquid fuels industry is subject to extensive government regulation. Prices of petroleum fuels (petrol, diesel, kerosene and LPG) are administered by the Indian Government, which imposes various levies and taxes and determines retail and wholesale margins, over-and-above a ‘basic fuel price’. The administered price system for oil in India is supported by subsidies, even as oil revenues constitute a sizeable portion of the total revenues for government. The oil pass-through policy is under reform, with important implications for the impact of international oil prices on macroeconomic objectives for growth, inflation and equity. The pricing of petroleum products was scheduled to be completely deregulated fro m April 1, 2002. However, it only enabled the Oil Marketing Companies to ‘freely determine retail prices of some petroleum products based on an international parity pricing formula, while the government continued to regulate the prices of other petroleum products’. Bhanumurthy etal’s results show that deregulation of domestic oil prices over the 12th Five-Year Plan, as is currently underway, will reduce growth while increasing inflation. However, it will also result in an improved fiscal deficit and marginally, the current account deficit. In the case of partial pass-through, in the medium to long-term, an increased subsidy bill could potentially reduce public investment, thus adversely affecting growth. The basic fuel price is influenced by two primary factors: the dollar price of crude oil traded on international markets; and the rupee/dollar exchange rate. Volatility in both of these variables has historically had a significant impact on the rupee denominated price of oil. In recent years, the real price of oil in rupees has risen to nearly double the previous record level set after the second oil price shock in 1979/80, largely because of the long-term depreciation of the rupee against the dollar.
In India, high economic growth in the last decade on the back of a strong services sector which is dominated by transport services, with very high oil-dependence, threatens future economic growth. A sharp oil price increase may lead to a fall in demand, linked to higher inflation, as well as a reduction in the profit margin of manufacturers. This may result in a slowdown in industrial growth, as witnessed in the declining growth of India’s manufacturing sector during 2011-12. A government decision to expand refining capacity and exports of petroleum products due to expectations of greater demand in the Asia-Pacific region increases the manufacturing sector’s vulnerability to sudden oil price increases, which would dampen foreign demand. The residential sector will experience hikes in the price of transportation fuels, and impacts from increases in the prices of Rupees (2011) US$ (2011) kerosene (predominantly rural use) and LPG (urban and semi-urban use), which are currently still subsidized.
Factors That Determine Vulnerability to Shocks in India:
Vulnerability to oil supply and price shocks is dependent on the oil intensity of energy consumption, oil intensity of the GDP, domestic production of crude oil and also the oil import dependence of the country. Another issue that affects the vulnerability to shocks is the availability on oil & the international oil markets. We analyze each of these factors and discuss the likely trajectory of each factor for the near to mid-term future.
Impacts of Oil Shocks on the Indian Economy:
control over the prices of refined petroleum products. Such an analysis would therefore require a CGE based model which is outside the purview of this paper.
On the other hand, an understanding of the impact of international oil shocks can be made possible by identifying the key macro-economic variables that are likely to reflect the vulnerability to such shocks. The key macro-macro-economic parameters which reflect the impact of oil price volatility include:
GDP Growth rate
Total important bill & current account balance
Fiscal balances (in case of provision of fuel subsidies by the government)
Managing Vulnerability to Oil Shocks:
As the dependence on imports is likely to continue and so is the vulnerability to shocks, it is pertinent to look at measures that help in reducing the vulnerability and building resilience to oil shocks.
In the short term, building defenses against supply and price shocks by construction of Strategic Petroleum Reserves (SPRs) provides the most immediate defense against any shocks in supply or even demand. Further, SPRs also have the potential to act as a strategic signal against any intended blockage of supplies.
Based on available estimates, as of December 2009, India already possessed nearly 74 days of commercially trappable storage capacity. Construction of SPRs is already underway and the first phase when completed will add 5.33 MT of crude oil storage space. A second phase is also being planned and will add 12.5 MT to the strategic oil stocks of the country. However, in addition to the country’s own stocks, collaboration with other countries to undertake joint stockpiling and release activities need to be adopted. In this context, having agreements with both consuming and supplying countries is essential. Since any supply shortage or maritime blockage is likely to impact most Asian oil consumers, a program among these nations to jointly create and maintain strategic oil storage capacities will help in addressing short term supply shocks.
In order to reduce the impact of oil price shocks on the domestic economy, it is critical to review the country’s policy on fuel subsidies and to manage the energy access agenda in a financially sustainable manner. As mentioned in the preceding sections, petroleum product subsidies form a major proportion of the country’s total fiscal outgo. In addition to this, the contribution from oil companies (especially those in the upstream sector) also affects the ability of these companies to invest in increasing their domestic production capacity and expansion of infrastructure to effectively reduce reliance on imports.
In the medium and long term, efforts to diversify sources of crude oil imports and substitution towards alternatives need to be made. As stated previously, countries from the Middle East constitute the largest sources of crude oil supply for India. Efforts need to be made to diversify the crude oil import portfolio of the country and to enhance diplomatic relations with oil producing countries. Cross investments wherein companies from oil producing are allowed to make investments in energy infrastructure in India can also be considered. In this context, countries from Latin America and Africa provide vital options. In the past few years, imports of crude oil from Venezuela have increased from less than 2 Mt in 2007-08 to nearly 10 MT in 2011-12. Similarly, imports from Nigeria, have also increased from nearly 10 MT in 2007-08 to the current level of over 14 MT (2011-12). Increasing imports from these countries and furthering bilateral ties with their respective Governments will form a key component of India’s oil security policy in the coming years. In addition to these emerging players, imports of unconventional oil (tar sand, natural gas liquids etc.) from North America (Canada and USA) also provide an opportunity to diversify the country’s supply base. Not only do these options provide additional sources of oil, the relative geo-political certainty of supplies region adds to the long term security of oil supply for India.
In the medium term, policies to enhance domestic oil production also need to be encouraged, and foreign companies with expertise in exploration, particularly in deep offshore fields, need to be invited to participate in the upstream industry. This will also require substantial effort on the domestic front in making high quality data available for different oil basins and commissioning studies on the geology of reserves.
Further, in order to reduce the dependence on crude oil altogether, efforts to move towards alternative sources of supply need to be made. Particularly in the transport sector, policies on blending of biofuels in automotive fuels have already been introduced but the enforcement of such regulations, coupled with investments in making the entire value chain feasible need to be provided. Further, promotion of electric and hybrid vehicles, encouraging a shift towards public modes of passenger transport and towards railways in freight transport needs to be undertaken.
VII. CONCLUSION
Conclusion of India’s key strengths and vulnerabilities, and likely impacts of oil shocks. These subsystems are not isolated from one another, but are connected by many linkages and feedbacks, which in many ways intensify the dependencies on oil and magnify the vulnerabilities to oil shocks. The impacts of the energy are possible interruptions to supply of crude oil and refined fuel imports, possible disruptions to supply of coal to power stations, upward pressure on electricity prices, increased cost of renewable energy infrastructure. The impacts of transport are raising costs of passenger & freight transport, constrained mobility of passengers, rising costs of road maintenance, possible interruptions to freight logistics. The impact of agriculture are rising input costs (diesel, fertilizers, and pesticides), disruptions to farming activities, possible rise in farmer suicides, transport disruptions hamper the public, distribution system of food to the poor. The impact of macro-economy are rising oil import bill and current account deficit, exchange rate depreciation, rising inflation, higher manufacturing costs, slowing economic growth.
ACKNOWLEDGEMENT
Praise is to the God, the most gracious and the most merciful. Without his blessing and Guidance my accomplishments would never have been possible. I would like to acknowledge many people who helped me during the course of this work. First, I would like to thank Excel College of Engineering & Technology, my Principal Dr. E. Palanisamy and my guide U.Ashadevi, for giving me the opportunity to be a part of this research group and for providing me with the right balance of guidance and independence in my paper work. I am greatly indebted to him for his full support and constant encouragement and advice both in technical and nontechnical matters. His broad expertise and superb intuition have been a source of inspiration to me over the last one year. His detailed comments and criticisms have greatly influenced my technical writing, and are reflected throughout the presentation of this dissertation. I am also thankful to the staff of Petroleum Engineering dept. and my elder brother Mr.Ashish kumar. For their support and all sorts of co-operation.
Last, but certainly not the least, I would like to acknowledge the commitment, sacrifice and support of my parent, who have always motivated me.
REFERENCES
[1] Teri-NFA working paper series No.18 by Anomol Soni
[2] AAI. 2012. about AAI. New Delhi: Airports Authority of India, Government of India. [Online].
[3] Bhanumurthy, N. R., Das, S. andBose, S. 2012. Oil Price Shock, Pass-through Policy and its Impact on India. Working Paper No. 2012-99. March 2012. New Delhi: National Institute of Public Finance and Policy.
[4] BP. 2012. Statistical Review of World Energy 2012. London: BP plc.
[5] Chaturvedi, S. 2012. Coal India forecasts sluggish output growth. New York: The Wall Street Journal,
[6] DES. 2011. Agricultural Statistics at a Glance. Directorate of Economics and Statistics. New Delhi: Government of India. DOC. 2012. System on Foreign Trade Performance Analysis. New Delhi: Department of Commerce, Ministry of Commerce and Industry, Government of India. De la Rue du Can, S., Letschert, V., McNeil, M., Zhou, N. and Sathaye, J. 2009a. Residential and transport energy use in India: past trend and future outlook. Ernest Orlando Lawrence Berkeley National Laboratory, Environmental Energy Technologies Division. January, 2009
[7] De la Rue du Can, S., McNeil, M. and Sathaye, J. 2009b. India Energy Outlook: End Use Demand in India to 2020. Ernest Orlando Lawrence Berkeley National Laboratory, Environmental Energy Technologies Division. January, 2009
[8] DGFT. 2011. Annual Report 2010-11. New Delhi: Directorate General of Foreign Trade, Ministry of Commerce and Industry, Government of India. Dutta, S. 2012. India’s strategic oil stockpile plan delayed by a year. New Delhi: The Times of India.
[9] EIA. 2011. India Country Analysis Brief. Washington, D.C.: US Energy Information Administration. [10] EIA. 2012. International Energy Statistics. US Energy Information Administration. [Online].
[11] Fischer-Kowalski, M. & Swilling, M. 2011. Decoupling Natural Resource use and Environmental Impacts from Economic Growth. Paris: United Nations Environment Program.