Earthquake Early Warning System Based on
Multiple Sensor Network
Balachandran.S Karthikeyan.T
UG Scholar UG Scholar
Department of Electronics Communication Engineering Department of Electronics Communication Engineering CCET, OddanchatramTamilnadu – 624619 CCET, OddanchatramTamilnadu – 624619
Ramesh.M Govindarajan.S
UG Scholar UG Scholar
Department of Electronics Communication Engineering Department of Electronics Communication Engineering CCET, OddanchatramTamilnadu – 624619 CCET, OddanchatramTamilnadu – 624619
Balachandran.S UG Scholar
Department of Electronics Communication Engineering CCET, OddanchatramTamilnadu – 624619
Abstract
Earthquake is one of the major natural calamity. So prediction of the reach of earthquake event to the various locations could result in minimizing the disaster due to it. This system contains the design of sensor system and the techniques used for detection and processing of the received signals in real time. In this system, an earthquake which is also known as a tremor or temblor is the result of a sudden release of energy in the Earth's crust that creates seismic waves. In this system, we use various sensors to detect the earthquake and alert us. Early warning systems can play an important role in reducing the negative impact of these catastrophic events on densely populated areas and in mitigating the damage to strategic structures and lifelines.
Keywords: Accelerometer, seismic sensor, vibration sensor, PIC controller
________________________________________________________________________________________________________
I. INTRODUCTION
If earthquake takes place, it creates two seismic waves, called P- and S-waves, that propagate outward from the hypocenter (i.e., the location that an earthquake starts beneath the surface of the Earth) in a spherical pattern. The S-wave, or secondary wave, is the slower of these two waves, but is also the more powerful and destructive. Early detection of the S-wave and prompt warning is vital to save lives. The time interval between the two waves grows as the distance from the earthquake hypocenter increases are, however, two additional latency components involved in this process. The processing time of events, during which seismic events are measured by the accelerometers. The communication latency, during which the seismic data is delivered to the QCN server. In this paper, we study critical scenarios in which the simple master-worker topology currently used in QCN fails to alert the public to the imminent danger or engage in additional safety measures e.g., activating backup systems, alerting Earthquake is one of the fatal disasters in the world. In early 2011, a major earthquake hit Japan, which calculated to be at the Micron Lo g 9. With today’s technology, the earthquake early warning system is able to announce the alert message before the earthquake arrives. There are three major components for earthquake early warning system. The Real time earthquake information collection from the sensor nodes. Earthquake estimation with predictive result. Alarm messages delivery to users. Alarm emergency message delivery is the most important issue for earthquake early warning system. The telecom service providers do not enable Multimedia Broadcast and Multicast Services (MBMS) in their network. The sensor system is comprised of highly sensitive 3-dimensional accelerometer, digital band pass filter, a microcontroller, GPS module and GSM module. Using community-based sensors for earthquake early warning is particularly challenging due to the large variety of sensor types, sensor locations, and ambient noise characteristics. As our second main contribution, we present an implementation of our approach in the Community Seismic Network (CSN). The goal of our community sensing system is to detect seismic motion using accelerometers in smart phones and other consumer devices. The issue real-time early-warning of seismic hazards . The duration of the warning is the time between a person or device receiving the alert and the onset of significant shaking. This duration depends on the distance between the location of initial shaking and the location of the receiving device, and on delays within the network and fusion center.The accelerometer captures the seismic waves and a client on the volunteer's computer sends the seismic data to the GSM/GPRS module.
Ideally, the server should promptly capture the faster wave (P-wave) and alert the population so that the time between the warning and the second S-wave is maximized. To meet this requirement, a GSM/GPRS should be able to analyze seismic data and make decisions inreal-time. There are, however, two additional latency components involved in this process.
1) The processing time of events, during which seismic events are measured by the accelerometers; 2) The communication latency, during which the seismic data is delivered to the QCN server.
The combination of these latency components might delay the delivery of the observed seismic event to the server. If, For instance, the latency is sufficiently high, the server might perceive a seismic event too late in time to trigger safety measures efficiently. The failure of the network to connect volunteers' computers to the server can have even more catastrophic impaction the earthquake detection and warning.
II. RELATED WORK
The possible connection of the electromagnetic activity that is observed prior to significant earthquakes with the corresponding EQ preparation processes, often referred to as seismoelectromagnetics, has been intensively investigated during the last years. Several possible EQ precursors and possible physical models have been suggested in the literature. The possible relation of the field-observed fracture-induced EM emissions in the frequency bands of megahertz and kilohertz has been examined in a series of publications while a three-stage model for the preparation of an EQ by means of its observable EM activity has been recently put forward.
This paper presents a different and innovative proposal to detect seismic events, a solution that uses smart phones as opportunistic sensor nodes to obtain real-time knowledge of the community environment through a hierarchical architecture, taking advantage of this growing trend. A distributed low-cost network formed of smart phones capable of detect a seismic-peak with a high accuracy by means of converting accelerometers in accelerographs optimizing distributed calculations in these. A server which considers time and spatial analyses not present in another works, making it more precise and customizable, coupling it to the features of the geographical zone, network and resources. Validated by extensive evaluation, the most relevant results have been the improvement in notifications delivery about a seismic-peak 12 seconds earlier in the epicenter zone, the reduced consumption of mobile battery and the reduction in the number of false positives. In addition, this challenge becomes an great opportunity giving people as much as tens of seconds warning before an earthquake occurs in places far from the epicenter. The class of applications are rare events - such as events that occur at most once a month - and that have very high costs for tardy detection and for false positives. The theory is applied to an application that warns about the onset of shaking from earthquakes based on real- time data gathered from different types of sensors with varying sensitivities located at different points in a region. We present algorithms for detecting events in Cloud computing servers by exploiting the scalability of Cloud computers while working within the limits of state synchronization across different servers in the Cloud. Ordinary citizens man- age sensors in the form of mobile phones and tablets as well as special-purpose stationary sensors; thus the geospatial distribution of sensors depends on population densities. The distribution of the locations of events may, however, be different from population distributions. We analyze the impact of population distributions (and hence sensor distributions as well) on the efficiency of event detection. Data from sensor measurements and from simulations of earthquakes validate the theory.
Seismicity and pre fracture EMEs should be two sides of the same coin concerning the EQ generation process. If the MHz EMEs and the corresponding foreshock seismic sequence are observable manifestations of the same complex system at critical state, both should be possible to be described as a critical phenomenon by means of the natural time method. Therefore, we also examined the corresponding foreshock seismic activity to verify this suggestion.
III. FUTURE DISCUSSION
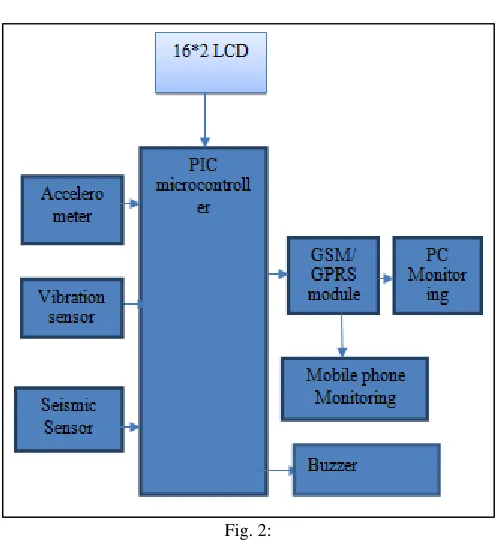
Fig. 2:
IV. BLOCK DESCRIPTION
Here we are using three major sensors vibration sensor, Seismic sensor and Accelerometer. The purpose of the three sensors is to read the vibrations from the earth. The three sensors are connected with the Peripheral Interface Controllers.The display is connected to the controller for showing the readings obtained from the sensors. Then the microcontroller is connected with GSM/GPRS module, the purpose of those module is that if the sensor package reads the vibration over the limit it sends the signal to the module and makes the server to sends text to the mobile phone and another signal is send to the pc for monitoring .A buzzer is attached to the microcontroller to make the alert via sound. The functions are done by implementing through embedded-c program developed in microprocessor lab.The operating voltage of the pic microcontroller is 5 voltage A battery which has dc voltage is given for the power supply The display we are using for our study is LCD which is a low cost one and the contrast of the display can be adjusted through pins. It can show 32 characters which is divided as 16 rows and 2 columns. There are 16 pins available in the LCD, the first 2 pins are given for voltage and pin number 3 is meant for contrast, pin number 4 acts as the enable pin. Other pins given for read and write option and the last 2 pins meant for ground the power supply. The pic controller has been available at both 40 and 44 pin packages. We are using 40 pin package.
V. HARDWARE DESCRIPTION
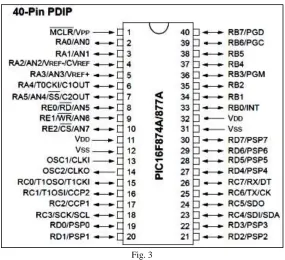
Pic microcontroller
Fig. 3
All PIC microcontroller family uses Harvard architecture. This architecture has the program and data accessed from separate memories so the device has a program memory bus and a data memory bus (more than 8 lines in a normal bus). This improves the bandwidth (data throughput) over traditional von Neumann architecture where program and data are fetched from the same memory (accesses over the same bus). Separating program and data memory further allows instructions to be sized differently than the 8-bit wide data word.
VI. PIN DESCRIPTION
It consist of both 40 and 44 pin packages Consist of five sectors “A-E”
A and E are analog pins B, C and D are digital pins
We can give analog input and obtain digital input similarly can give digital input and gain Analog output.
LCD
LCD (Liquid Crystal Display) screen is an electronic display module and find a wide range of applications. A 16x2 LCD display is very basic module and is very commonly used in various devices and circuits. These modules are preferred over seven segments and other multi segment LEDs. The reasons being: LCDs are economical; easily programmable; have no limitation of displaying special & even custom characters (unlike in seven segments), animations and so on. A 16x2 LCD means it can display 16 characters per line and there are 2 such lines. In this LCD each character is displayed in 5x7 pixel matrix. This LCD has two registers, namely, Command and Data.
Fig. 4:
VII.BUZZER
The transistor used in this project to drive the buzzer is BC547. The features of this transistor are discussed in the next topics. Digital systems and microcontroller pins lack sufficient current to drive the circuits like buzzer circuits and relay circuits(3). While these circuits need around 10milli amps to be energized, the microcontroller pin can provide a maximum of 1-2milli amps current. For this reason, a driver such as a power transistor is placed in between the microcontroller and the buzzer. This is a small 12mm round speaker that operates around the audible 2kHz range. You can use these speakers to create simple music or user interfaces. Each speaker is PTH soliderable and requires an operating voltage of 3.5-5V with a mean current of 35mA max. These speakers also have a typical sound output of 95 dB and a coil resistance of 42 ±6.3 ohm
Fig. 5:
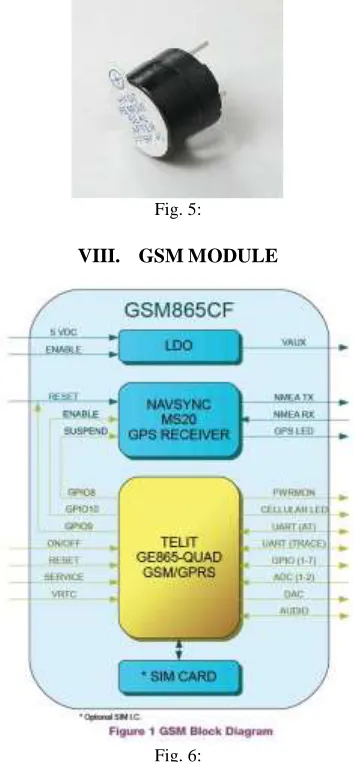
VIII. GSM MODULE
A GSM modem is a specialized type of modem which accepts a SIM card, and operates over a subscription to a mobile operator, just like a mobile phone. From the mobile operator perspective, a GSM modem looks just like a mobile phone. When a GSM modem is connected to a computer, this allows the computer to use the GSM modem to communicate over the mobile network. While these GSM modems are most frequently used to provide mobile internet connectivity, many of them can also be used for sending and receiving SMS and MMS messages. A GSM modem can be a dedicated modem device with a serial, USB or Bluetooth connection, or it can be a mobile phone that provides GSM modem capabilities. For the purpose of this document, the term GSM modem is used as a generic term to refer to any modem that supports one or more of the protocols in the GSM evolutionary family, including the 2.5G technologies GPRS and EDGE, as well as the 3G technologies WCDMA, UMTS, HSDPA and HSUPA.35A GSM modem exposes an interface that allows applications such as Now SMS to send and receive messages over the modem interface. The mobile operator charges for this message sending and receiving as if it was performed directly on a mobile phone. To perform these tasks, a GSM modem must support an “extended AT command set” for sending/receiving SMS messages, as defined in the ETSI GSM 07.05 and 3GPP TS 27.
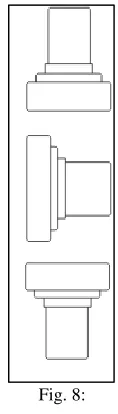
IX. ACCELEROMETER
Definition: the time rate of change of velocity – A .K.A.: the time rate of change of the time rate of change of distance.
Acceleration is measured in (ft/s)/s or (m/s)/s. A “g” is a unit of acceleration equal to Earth’s gravity at sea level • 32.2 ft/s 2 or 9.81 m/s Description “g” level
1g Earth’s gravity 2gPassenger car in corner 2gBumps in road
3gIndy car driver in corner 5gBobsled rider in corner 7gHuman unconsciousness 10gSpace shuttle
Acceleration is a physical characteristic of a system. – T he measurement of acceleration is used as an input into some types of control systems. – T he control systems use the measured acceleration to correct for changing dynamic conditions.
+1g:Output of the sensor with the base connector pointed up. 0g:Output of the sensor with the base connector horizontal
-1g:Output of the sensor with the base connector pointed down Linearity: The maximum deviation of the calibration curve from a straight line.
Linearity = Vout, 0g – ½(Vout, +1g + Vout, -1g)
Fig. 8:
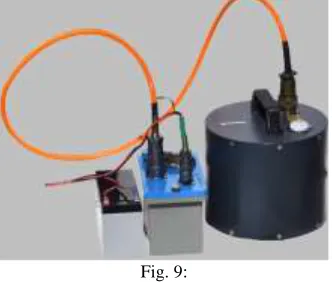
X. SEISMIC SENSOR
Seismic sensors are sensors that measure motion of the animals, humans, ground, including those of seismic waves generated by earthquakes, volcanic eruptions, and other seismic sources. Records of seismic waves allow seismologists to map the interior of the Earth, and locate and measure the size of these different sources.The word derives, a shaking or quake, from the verb, to shake, and measure and was coined by David Milne-Home in 1841, to describe an instrument designed by Scottish physicist James David Forbes.
Both types provide a continuous record of ground motion; this distinguishes them from seismoscopes, which merely indicate that motion has occurred, perhaps with some simple measure of how large it was.
Fig. 9:
Seismic sensors are sensors that measure motion of the animals, humans, ground, including those of seismic waves generated by earthquakes, volcanic eruptions, and other seismic sources. Records of seismic waves allow seismologists to map the interior of the Earth, and locate and measure the size of these different sources. The word derives, a shaking or quake, from the verb, to shake, and measure and was coined by David Milne-Home in 1841, to describe an instrument designed by Scottish physicist James David Forbes. Seismograph is, to draw. It is often used to mean seismometer, though it is more applicable to the older instruments in which the measuring and recording of ground motion were combined than to modern systems, in which these functions are separated. Both types provide a continuous record of ground motion; this distinguishes them from seismoscopes, which merely indicate that motion has
XI. VIBRATION SENSOR
Vibration sensors can measure and analyze displacement, linear velocity, and acceleration. These parameters are mathematically related and can be derived from a variety of sensors. Selection of a sensor proportional to displacement, velocity, or acceleration depends on the frequencies of interest and the signal levels involved. The two basic piezoelectric materials used in vibration sensors today are synthetic piezoelectric ceramics and quartz. In a piezoelectric sensor or accelerometer, the sensing element is a crystal that emits a charge when subjected to compression. The crystal is bonded to a mass so that when it is subjected to a “g” force, the mass compresses the crystal and a signal is emitted. The signal value is relative to the force imposed. The crystals are attached between a center post and a seismic mass. A compression ring or stud applies a pre-load force to the element assembly to ensure a rigid structure and linear behavior. Under acceleration, the mass causes shear stress to the sensing crystals, resulting in a proportional electrical output by the piezoelectric material. The output is collected by electrodes and transmitted by lightweight lead wires to other circuitry or directly to connectors.
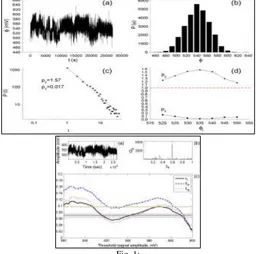
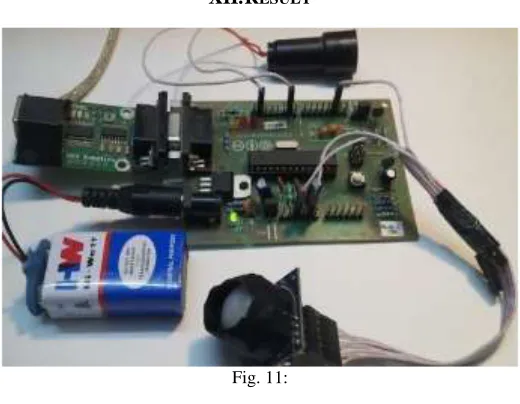
XII.RESULT
Fig. 11:
XIII. CONCLUSION
We have presented a novel technique to solve the automatic detection and classification problem of earth tremor in a single step by using microcontroller based earthquake detection. In our system the majority of cases offers real practical benefits in the event of an earthquake to safeguard lives and resources.
REFERENCES
[1] S.M.Potirakis, Y.Contoyiamis, K.Eftaxias, G.Koulouras, and C.Nomicos,”Recent Field Observations indications an Earth System in Critical Conditions Before the Occurrence of a Significant Earthquake”Vol.12 No.3 March 2015.
[2] R. D. Cicerone, J. E. Ebel, and J. Britton, “A systematic compilation of earthquake precursors,” Tectonophysics, vol. 476, no. 3/4, pp. 371–396, Oct. 2009. [3] M. Hayakawa, The Frontier of Earthquake Prediction Studies. Tokyo, Japan: Nihon-Senmontosho-Shuppan, 2013. [4] M. Hayakawa, Earthquake Prediction
Studies: Seismo Electromagnetics. Tokyo, Japan: Terrapub, 2013.
[4] Q. H. Huang, “Rethinking earthquake-related DC-ULF electromagnetic phenomena: Towards a physics-based approach,” Nat. Hazards Earth Syst. Sci., vol. 11, pp. 2941–2949, 2011.
[5] H. X. Ren, X. F. Chen, and Q. H. Huang, “Numerical simulation of co- seismic electromagnetic fields associated with seismic waves due to finite faulting in porous media,” Geophys. J. Int., vol. 188, no. 3, pp. 925–944, Mar. 2012.
[6] Q. H. Huang, “Retrospective investigation of geophysical data possibly associated with the Ms8.0 Wenchuan earthquake in Sichuan, China,” J. Asian Earth Sci., vol. 41, no. 4/5, pp. 421–427, Jun. 2011.
[7] G. J. Xu et al., “Anomalous behaviors of geomagnetic diurnal variations prior to the 2011 off the Pacific coast of Tohoku earthquake (Mw9.0),” J. Asian Earth Sci., vol. 77, pp. 59–65, Nov. 2013.
[8] K. Eftaxias et al., “Signatures of pending earthquake from electromag- netic anomalies,” Geophys. Res. Let., vol. 28, no. 17, pp. 3321–3324, Sep. 2001. [9] K. Eftaxias et al., “Review and a model of pre-seismic electromagnetic emissions in terms of fractal electrodynamics,” Fractals, vol. 12, no. 2, pp. 243–273,
Jun. 2004.
[10] P. Kapiris, K. Eftaxias, and T. Chelidze, “Electromagnetic signature of prefracture criticality in heterogeneous media,” Phys. Rev. Lett., vol. 92, no. 6, pp. 065702-1–065702-4, Feb. 2004.
[11] K. Karamanos et al., “Study of pre-seismic electromagnetic signals in terms of complexity,” Phys. Rev. E, vol. 74, no. 1, pp. 016104-1– 016104-21, Jul. 2006.
[12] K. Papadimitriou, M. Kalimeri, and K. Eftaxias, “Nonextensivity and universality in the earthquake preparation process,” Phys. Rev. E, vol. 77, no. 3, pp. 036101-1–016104-14, Mar. 2008.
[13] Y. F. Contoyiannis, P. G. Kapiris, and K. A. Eftaxias, “A monitoring of a pre-seismic phase from its electromagnetic precursors,” Phys. Rev. E , vol. 71, no. 6, pp. 066123-1–066123-14, Jun. 2005.
[14] Y. F. Contoyiannis, S. M. Potirakis, and K. Eftaxias, “The Earth as a living planet: Human-type diseases in the earthquake preparation process,” Nat. Hazards Earth Syst. Sci., vol. 13, pp. 125–139, 2013.
[15] K. Eftaxias, S. M. Potirakis, and T. Chelidze, “On the puzzling feature of the silence of precursory electromagnetic emissions,” Nat. Hazards Earth Syst. Sci., vol. 13, pp. 2381–2397, 2013.