www.pharmascholars.com
1178
Research Article
CODEN: IJPNL6
DEVELOPMENT AND VALIDATION OF RP-HPLC METHOD FOR SIMULTANEOUS
ESTIMATION OF SOME DRUGS IN PHARMACEUTICAL FORMULATION
Mahesh H. Kolhe*; Ujwala K. Waghmare; Ramesh D. Bhusal ; Pranit P. Hajare ; Swapnil R
Chavan
Department of Pharmaceutics, Pravara Rural College of Pharmacy, Loni Bk -413736,
Maharashtra, India.
*Corresponding author e-mail: [email protected]
ABSTRACTA simple, accurate and reproducible RP-HPLC method has been developed for simultaneous estimation of Aspirin and Ticlopidine hydrochloride in tablet dosage form. The RP-HPLC analysis is carried out using Acetonitrile: Ammonium acetate buffer (0.05 M) in the ratio of (68: 32 % v/v) as the mobile phase and MOS Thermosil C8 column (250 mm × 4.6 mm i.d.), flow rate 1.0 mL/min, with detection wavelength of 240 nm. Linearity was obtained in the concentration range of 10-50 μg/mL and 20-100 μg/mL for Aspirin and Ticlopidine hydrochloride respectively. The RP-HPLC methods was developed and statistically validated as per ICH guidelines.
Keywords: Liquid chromatography, mass spectrometers, electrospray ionisation
INTRODUCTION
Chromatography is a new technique first invented by M. Tswett, a botanist 1906 in Warsaw. Chromatography, although primarily a separation technique, is mostly employed in chemical analysis. Nevertheless, to a limited extent, it is also used for preparative purposes, particularly for the isolation of relatively small amounts of materials that have comparatively high intrinsic value. Chromatography is probably the most powerful and versatile technique available to the modern analyst. In a single process it can separate a mixture into its individual components and simultaneously provide a quantitative estimate of each constituent. Samples may be gaseous, liquid or solid in nature and can range in complexity from a simple blend of two entantiomers to a multi component mixture containing widely differing chemical species. Furthermore, the analysis can be carried out, at one extreme, on a very costly and complex instrument, and at the other, on a simple, inexpensive thin layer plate.
Aspirin (ASP):
Description: The prototypical analgesic used in the treatment of mild to moderate pain. It has
anti-inflammatory and antipyretic properties and acts as an inhibitor of cyclooxygenase which result in the inhibition of the biosynthesis of prostaglandins. Acetylsalicyclic acid also inhibits platelet aggregation and is used in the prevention of arterial and venous thrombosis. Color: off white to white. Appearance: Fine crystalline powder slightly hygroscopic. Odor: Odorless
The structural formula of Aspirin is
A)Test procedure: Add 2 ml of a 2 percent w/v
solution to a few ml of 2, 6- dichlorophenolindophenol solution.
Observation: Solution was decolorized.
www.pharmascholars.com 1179
Inference: Pure drug sample complies the
identification test for Aspirin.
B) Test procedure: To 2 ml of a 2 percent w/v
solution add 2 ml of water, 0.1 g of sodium bicarbonate and about 20 mg of
ferrous sulphate, shake and allow to stand. Add 5 ml of 1 M sulphuric acid; the colour disappears.
Observation: Deep violet colour was produced
which disappeared on addition of sulphuric acid.
Inference: Pure drug sample complies the
identification test for Aspirin.
Ticlopidine Hydrochloride (TIC)
Description: Ticlopidine is an effective inhibitor of platelet aggregation. The drug has been found to significantly reduce infarction size in acute myocardial infarcts and is an effective antithrombotic agent in arteriovenous fistulas, aorta-coronary bypass grafts, ischemic heart disease, and venous thrombosis. Colour: off white to white. Appearance: Fine crystalline powder. Odor: Odorless
The structural formula of Ticlopidine Hydrochloride is
. HCl
A)Test procedure: Dissolve 40 mg in water and dilute to 100.0 ml with the same solvent. Calculate the ratio of absorbance at 268 nm to absorbance at 275 nm.
Observation: Absorbance of sample solution at 268 nm = 0.5192
Absorbance of sample solution at 275 nm = 0.4352 Ration of Absorbance at 268 nm/275 nm = 1.19 Inference: As per B.P the ratio of absorbance at 268 nm to absorbance 275 nm should be between 1.1 to 1.2. The observed ratio of absorbance is 1.19. Hence, pure drug sample complies the identification test for ticlopidine hydrochloride.
B) Test procedure: Dissolve 40 mg in water and dilute to 100.0 ml with the same solvent. Dilute 5.0 ml of above solution to 100.0 ml with water. Determine peak maxima in uv range.
Observation: Two peak maxima were obtained at
214 nm and 232 nm.
Inference: Pure drug sample complies the
identification test for ticlopidine hydrochloride.
Materials and Methods:
Preparation of standard stock solution
Stock Solution A: Accurately weighed quantity (25.0 mg) of Aspirin (ASP) was transferred to 25.0 ml volumetric flask, dissolved and diluted up to the mark with mobile phase. The solution was filtered through 0.2µ membrane filter (Concentration: 1000 µg/ml).
Stock Solution B: Accurately weighed quantity (25.0 mg) of Ticlopidine hydrochloride (TIC) was transferred to 25.0 ml volumetric flask, dissolved and diluted up to the mark with mobile phase. The solution was filtered through 0.2 µ membrane filter (Concentration: 1000 µg/ml)
Stock Solution C: An accurately weighed
quantity of ASP (20.0 mg) and TIC (50.0 mg) was transferred to 25.0 ml volumetric flasks, dissolved and diluted up to mark with mobile phase. From this solution, 3.0 ml was transferred to 10.0 ml volumetric flask and diluted to the mark with mobile phase. Further diluted 1.0 ml of above solution to 10.0 ml with mobile phase The solution was mixed and filtered through 0.2 µ membrane filter (Concentration:24 µg/ml ASP and 60 µg/ml TIC, respectively).
Selection of Mobile Phase
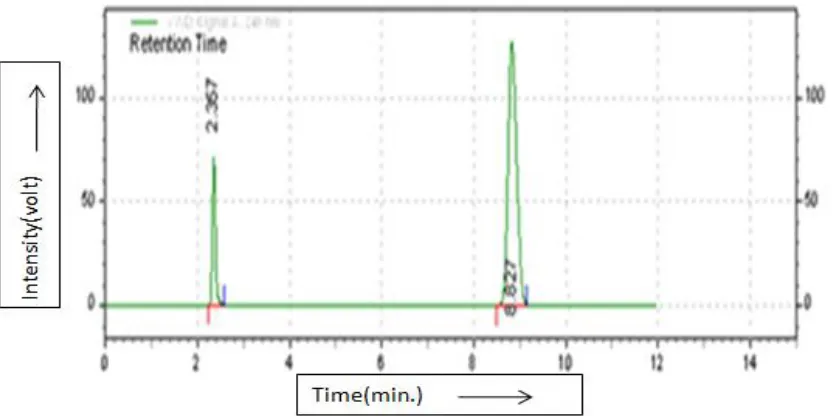
Standard stock solution A and B were appropriately diluted with mobile phase to obtain final concentration of 24 µg/ml and 60 µg/ml of ASP and TIC, respectively. The diluted standard solutions were filtered through 0.2 µ membrane filter. The filtrates were injected into the HPLC system and run in different solvent systems. Mixture of different solvents were tried in order to determine optimum chromatographic conditions for effective separation of ASP and TIC. After several permutations and combinations, it was found that mixture of Ammonium acetate buffer (0.05M) and Acetonitrile gives satisfactory results as compared to other mobile phases. Finally, the optimal composition of the mobile phase, Acetonitrile: Ammonium acetate buffer (0.05M) (68: 32v/v), and flow rate 1.0 ml/min showed good resolution, peak shape and desired elution time. Retention time for ASP and TIC was 2.36 min and 8.82 min, respectively.
Preparation of mobile phase
www.pharmascholars.com 1180
(0.05 M) and 68 ml of Acetonitrile. This mobilephase was ultrasonicated for 10 minutes and then it was filtered through 0.45 μ membrane filter.
Selection of analytical wavelength
Standard stock solution A and B were diluted separately with mobile phase to obtain final concentration of 24 µg/ml of ASP and 60 µg/ml of TIC. Each solution was scanned using double beam UV-Visible Spectrophotometer-1700 in the spectrum mode between the wavelength range of 400 nm to 200 nm against mobile phase as blank, and their spectra was overlaid. The wavelength selected for analysis was 240 nm as both the drugs showed significant absorbance at this wavelength.
Optimized Chromatographic Conditions
Column: MOS Thermosil C8 (250 mm × 4.6
mm i.d.)
Mobile phase: Acetonitrile: Ammonium acetate buffer(0.05M) (68:32 v/v)
Flow rate : 1.0 ml/min Detection Wavelength : 240 nm
Sample injection volume : 20 µl Run Time : 10.0 min.
Study of Linearity Range
Aspirin: From Standard stock solution A, 5.0 ml was diluted to 50.0 ml with mobile phase. From above solution, 1.0, 2.0, 3.0, 4.0, and 5.0 ml were transferred individually to 10.0 ml volumetric flask and diluted to the mark with mobile phase (Concentration 10, 20, 30, 40, and 50 µg/ml respectively). The diluted solutions were filtered through 0.2µ membrane filter.
Ticlopidine hydrochloride: From Standard stock
solution B, 5.0 ml solution was diluted to 25.0 ml with mobile phase. From above solution 1.0, 2.0, 3.0, 4.0 and 5.0 ml were transferred individually to 10.0 ml volumetric flask and diluted to the mark with mobile phase (Concentration 20, 40, 60, 80 and 100 µg/ml respectively). The diluted solutions were filtered through 0.2µ membrane filter.
Then each solution (20 µl) was injected into the column and chromatographed using optimized chromatographic conditions. The corresponding chromatograms were recorded and area of each peaks for ASP and TIC were measured at 240 nm.
Analysis of Standard Laboratory Mixture
Six samples were prepared and analysed in following manner:
Accurately weighed quantity of ASP (20 mg) and TIC (50 mg) was transferred to 50.0 ml volumetric flask, dissolved and diluted upto the mark with mobile phase. The resulting solution was mixed and filtered through Whatman filter paper No.42. From the filtrate, 5.0 ml solution was diluted to 25.0 ml with mobile phase. Further diluted, 3.0 ml of resulting solution to 10.0 ml with mobile phase to obtain final concentration 24 μg/ml of ASP and 60 μg/ml of TIC.
Equal volumes of standard stock solution C and sample solution (20 µl) were injected into the column and chromatographed using optimized chromatographic conditions. The corresponding chromatograms were recorded and area of each peak for ASP and TIC was measured at 240 nm. Each solution was injected and chromatographed in triplicate. Amount of ASP and TIC in sample (in mg) was calculated by comparing the mean peak area of sample with that of standard. Amount of drug estimated in sample and percent drug estimation was calculated using following formula
Amount of PASpl
drug estimated in = --- x Cs x df sample(mg) PAStd
Where, PASpl - Peak area of sample. PAStd - Peak area of standard. Cs - Concentration of standard (mg/ml) df - Dilution factor for sample.
Analysis of Tablet formulation
Six sample were prepared and analysed in following manner
Twenty tablets were weighed average weight was calculated and crushed to obtain fine powder. Accurately weighed quantity of tablet powder equivalent to about 40 mg of ASP and 100 mg of TIC was transferred to 50.0 ml volumetric flask, 30 ml mobile phase was added and ultrasonicated for 15 min, volume was then made upto the mark with mobile phase. The resulting solution was mixed and filtered through Whatman filter paper No.42. From the filtrate, 3.0 ml solution was diluted to 10.0 ml with mobile phase. Further diluted 1.0 ml of resulting solution to 10.0 ml with mobile phase and filtered using 0.2 µ membrane filter.
Equal volumes of standard stock solution C and sample solution (20 µl) were injected into the Amount of drug estimated in sample (mg)
% Estimation = --- X 100
www.pharmascholars.com 1181
column and chromatographed using optimizedchromatographic conditions. The corresponding
chromatograms were recorded and area of each peak for ASP and TIC was measured at 240 nm. Each solution was injected and chromatographed in triplicate. Amount of ASP and TIC in sample (mg)
was calculated by comparing the mean peak area of sample with that of standard. Amount of drug estimated in mg/tablet and percent label claim was calculated using following formula:
Where, PASpl - Peak area of sample, PAStd - Peak area of standard. df1 - Dilution factor for standard. . df2 - Dilution factor for sample.
Method Validation
The proposed method was validated by studying several parameters such as accuracy, precision, linearity, limit of detection (LOD), limit of quantitation (LOQ) and robustness.
Accuracy: To ascertain the accuracy of proposed
method, recovery studies were carried out by standard addition method, as per ICH guidelines. An accurately weighed quantity of pre-analysed tablet powder equivalent to about 40 mg ASP and 100 mg TIC was transferred individually in nine different 50.0 ml volumetric flasks. To each of the flask following quantities of ASP and TIC were added:
Flask No.1: 32.1 mg ASP + 80.2 mg TIC, Flask No.2: 32.2 mg ASP + 80.1 mg TIC, Flask No.3: 32.1 mg ASP + 80.0 mg TIC, Flask No.4: 40.1 mg ASP + 100.3 mg TIC, Flask No.5: 40.1 mg ASP + 100.1 mg TIC, Flask No.6: 40.0 mg ASP + 100.1 mg TIC, Flask No.7: 48.1 mg ASP + 120.0 mg TIC, Flask No.8: 48.2 mg ASP + 120.3 mg TIC, Flask No.9: 48.0 mg ASP + 120.0 mg TIC.
Then, 30 ml mobile phase was added to each flask and content of the flask were ultrasonicated for 20 min, volume was then made upto the mark with mobile phase. The solution was individually mixed and filtered through Whatmann filter paper No. 42. From the filtrate, 5.0 ml solution was diluted to 10.0
ml with mobile phase. From above solution, 3.0 ml was diluted to 10.0 ml with mobile phase. Further diluted, 1 ml of resulting solution to 10.0 ml with mobile phase. The diluted solution was filtered through 0.2 µ membrane filter.
Equal volumes of standard stock solution C and sample solution (20 µl) were injected into the column and chromatographed using optimized chromatographic conditions. Each solution was injected and chromatographed in triplicate. The corresponding chromatograms were recorded and area of each peak for ASP and TIC was measured at 240 nm.
Amount of the drug recovered (mg) and percent recovery was calculated by using following Equation,
Amount of drug recovered (mg)
% Recovery = --- X 100 Amount of pure drug added (mg)
Precision:
a) Intra-day Precision:
Intraday precision was determined by analyzing tablet sample solutions at different time intervals on the same day. Tablet sample solution was prepared and analysed in the similar manner as described under analysis of tablet formulation.
b) Inter-day Precision:
Inter-day precision was determined by analyzing tablet sample solutions on three different days. Tablet sample solution was prepared and analysed in the similar manner as described in analysis of tablet formulation.
Limit of Detection (LOD) and Limit of Quantitation
(LOQ): The LOD and LOQ were separately
determined based on the standard deviation of response of the calibration curve. The standard deviation of y- intercept and slope of the calibration curves were used to calculate the LOD and LOQ.
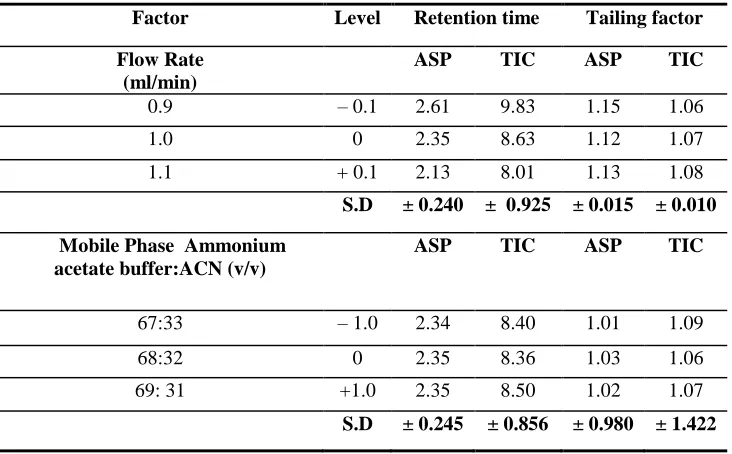
Robustness of Method: To evaluate the robustness of
the proposed method, small but deliberate variations in the optimized method parameters were done. The effect of change in flow rate and mobile phase ratio on retention time and tailing factor were studied. The tablet sample solution containing 24 µg/ml of ASP and 60 µg/ml of TIC was injected (in triplicate) into the HPLC system under the varied conditions.
CONCLUSION
The proposed RP-HPLC methods for simultaneous estimation of Aspirin and Ticlopidine hydrochloride Content of PASpl Weight of std. (mg) df2 Avg.
drug in = --- x --- x --- x weight of mg/tablet PAStd df1 Weight of tablet tablet (mg) powder taken (mg)
www.pharmascholars.com 1182
were found to be sensitive, accurate, precise,reproducible and less time consuming. Hence, the proposed HPLC methods can be employed for
routine quality control of Aspirin and Ticlopidine hydrochloride in combined dose tablet formulation.
Figure 1. Typical Chromatogram of Aspirin (RT = 2.36 min) and Ticlopidine hydrochloride (RT = 8.82 min).
Table 1: Standard Calibration Curve Data for ASP and TIC
ASP TIC
Concentration (µg/ml)
Peak Area* Concentration
(µg/ml)
Peak Area*
10 1243654 20 4817473
20 3853038 40 14357187
30 5976262 60 25852516
40 8988086 80 35091080
50 10757166 100 44031856
www.pharmascholars.com 1183
Figure 2. Standard calibration curve for Aspirin
Figure 3. Standard calibration curve for Ticlopidine hydrochloride
Table 2:Results of Standard Laboratory Mixture Analysis
Sr. No.
Amount of drug taken (mg)
Peak Area* Amount of drug
estimated (mg)
% Estimation
ASP TIC ASP TIC ASP TIC ASP TIC
1. 20.1 50.2 5563382 27512959 20.08 50.02 99.90 99.65
2. 20.0 50.1 5543410 27552214 20.01 50.09 100.04 99.99
3. 20.1 50.0 5555512 27555172 20.05 50.10 99.76 100.20
4. 20.1 50.2 5532895 27565028 19.97 50.12 99.35 99.84
5. 20.0 50.0 5573476 27677680 20.12 50.32 100.58 100.64
6. 20.0 50.3 5627668 27844753 20.31 50.63 101.56 100.65
www.pharmascholars.com 1184
Table 3: Statistical Validation for Standard Laboratory Mixture AnalysisSr. No Drug
% Estimation* S.D C.V
1. ASP 100.20 ± 0.777 0.776
2. TIC 100.16 ±0. 415 0.414
*denotes average of six determinations.
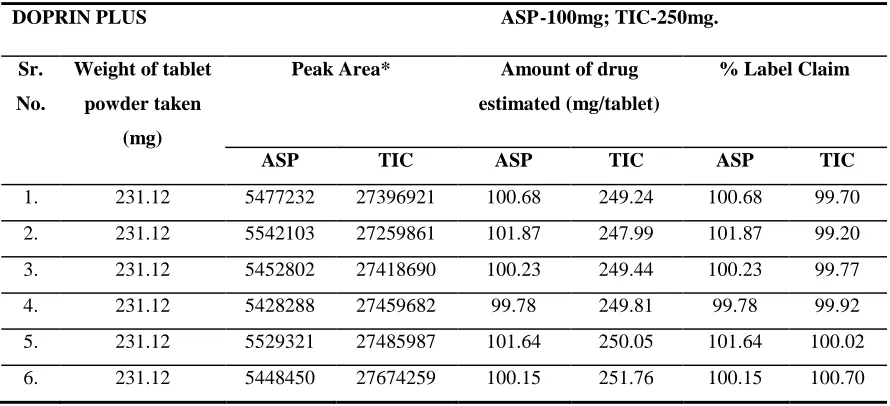
Table 4: Results of Analysis of TabletFormulation.
DOPRIN PLUS ASP-100mg; TIC-250mg.
Sr.
No.
Weight of tablet
powder taken
(mg)
Peak Area* Amount of drug
estimated (mg/tablet)
% Label Claim
ASP TIC ASP TIC ASP TIC
1. 231.12 5477232 27396921 100.68 249.24 100.68 99.70
2. 231.12 5542103 27259861 101.87 247.99 101.87 99.20
3. 231.12 5452802 27418690 100.23 249.44 100.23 99.77
4. 231.12 5428288 27459682 99.78 249.81 99.78 99.92
5. 231.12 5529321 27485987 101.64 250.05 101.64 100.02
6. 231.12 5448450 27674259 100.15 251.76 100.15 100.70
* denotes average of three determinations
Table 5: Statistical Validation Analysis of Tablet Formulation
Sr. No. Drug
Amount of drug estimated (mg/tablet)*
% Label Claim* S.D C.V
1. ASP 100.72 100.72 ± 0.850 0.843
2. TIC 249.71 99.88 ± 0. 490 0.490
www.pharmascholars.com 1185
Table 6: Results of Recovery StudiesSr. No.
Level of recovery
Weight of tablet powder
taken (mg)
Amount of drug added (mg)
Amount of drug recovered (mg)
% Recovery
ASP TIC ASP TIC ASP TIC
1.
80 % 229.6 32.1 80.2 32.33 80.35 100.72 100.19
235.8 32.2 80.1 31.90 76.59 99.06 98.21
232.1 32.1 80.0 31.27 78.66 99.97 98.33
2. 100 % 229.8 40.1 100.3 41.01 100.21 101.55 99.91
230.5 40.1 100.1 40.09 99.13 99.97 99.03
230.1 40.0 100.1 40.01 99.84 100.01 99.74
3. 120 % 229.6 48.1 120.0 49.07 120.25 101.70 100.21
229.9 48.2 120.3 47.58 121.87 98.72 101.30
230.4 48.0 120.0 47.17 120.06 101.31 100.05
Table 7: Statistical Validation for Recovery Study.
Level of recovery
% Recovery* S.D. C.V
ASP TIC ASP TIC ASP TIC
80 % 99.92 98.91 ±0.831 ±1.110 0.831 1.122
100 % 100.51 99.56 ±0.900 ±0.466 0.895 0.468
120 % 100.58 100.52 ±1.620 ±0.680 1.610 0.676
*denotes average of three determinations.
Table 8: Intra-day Precision Data
Drug % Label
claim*
S. D. C. V.
ASP 98.83 ± 0.600 0.607
TIC 100.52 ± 0.810 0.805
www.pharmascholars.com 1186
Table 9: Inter-Day Precision Data.Drug % Label claim
*
S. D. C. V.
ASP 99.06 ± 1.365 1.377
TIC 99.60 ± 1.209 1.213
* denotes average of three determinations
Table 10: LOD and LOQ of Aspirin and Ticlopidine HCl.
Parameter ASP TIC
Limit of Detection (μg/ml) 1.45 0.16
Limit of Quantification (μg/ml) 4.41 0.49
Table 11:Result of Robustness Studies.
REFERENCES
1. Rang HP, Dale MM, Ritter JM, More PK. Pharmacology. 5th ed., Elsevier Science Publisher: 2003, pp. 313, 315, 377, 378.
2. Indian Pharmacopoeia, volume II, New Delhi, Indian pharmacopoeia commission, Ghaziabad: 2007, pp. 370,763.
3. Bhargavi DK, Naga MI, Shajhan SK, Srinivasarao N. Int J Sci Innovations Discovery, 2011; 1(2): 151-57. 4. Hussain S, Munjewar RR, Farooqui M. Current Pharm Research, 2011; 2(1): 443-49.
5. Joshi P and Kumar M. Der Pharm Sinica, 2011; 2(3): 211-19.
6. Qutab SS, Razzaq SN. ACTA Chromatographia, 2007; 2(19): 119-29. 7. Godse VP, Bhosale AV. Eurasian J Anal Chem, 2010; 5(2): 137-44.
8. Reynolds DW, Facchine KL, Motto MG. Available Guidance and Best Practices for Conducting Forced Degradation Studies, Pharmaceutical Technology: 2002, pp. 48-56.
Factor Level Retention time Tailing factor
Flow Rate (ml/min)
ASP TIC ASP TIC
0.9 – 0.1 2.61 9.83 1.15 1.06
1.0 0 2.35 8.63 1.12 1.07
1.1 + 0.1 2.13 8.01 1.13 1.08
S.D ± 0.240 ± 0.925 ± 0.015 ± 0.010
Mobile Phase Ammonium acetate buffer:ACN (v/v)
ASP TIC ASP TIC
67:33 – 1.0 2.34 8.40 1.01 1.09
68:32 0 2.35 8.36 1.03 1.06
69: 31 +1.0 2.35 8.50 1.02 1.07
www.pharmascholars.com 1187
9. FDA, International Conference on Harmonization: Draft Revised Guidance on Q1A(R) Stability Testing of New Drug Substances and Products, Federal Register 65 (78), 21446–21453 (21 April 2000) [ICH Q1A(R)].10. Guideline, Validation of Analytical Procedures: Text and Methodology Q2 (R1), November, 2005. 11. ICH, Q2 (R1). Validation of analytical procedures: Text and Methodology International Conference on
Harmonization, Geneva: 2005, pp. 1- 13.
12. Nash RA, Wachter AH. Validation of analytical methods and pharmaceutical process, 3rd ed., Marcel Dekker Inc., New York: 2003, pp. 507- 524.
13. Sethi PD. High Performance Liquid Chromatography: Quantitative Analysis of Pharmaceutical Formulations, 1st ed., CBS Publishers and Distributors, New Delhi: 2001, pp. 3-72, 116-120.
14. Christen GD. Analytical Chemistry. 6th ed., John Wiley and Sons: 2003, pp. 35-42, 131-132.
15. Skoog DA, Holler FJ, Timothy A, Nieman NW. Principle of Instrumental Analysis. Saunders College Publications, London: 1998, pp. 1-12.
16. Beckett AH, Stenlake JB. Practical Pharmaceutical Chemistry. CBS Publishers and Distributors, New Delhi, Part-2: 2002, pp. 275-288.
17. Snyder R. Practical HPLC method development. 2nd ed., Wiley Interscience Publication: 1997, pp.120, 234-240, 266-278, 688.