ISSN (e): 2250-3021, ISSN (p): 2278-8719
Vol. 09, Issue 2 (February. 2019), ||S (III) || PP 11-19
The effect of electrolyte concentration on the energy storage using
MnO
2Supercapacitor electrode
M.M.El-Zaidia*, A.H.Khafagy, S.Hassan and M.Z.Zaki
(*) Physics Department, Faculty of Science, Menoufia University, Shebeen El-koom, Egypt Corresponding Author: M.M.El-Zaidia
Abstract:
Anodic potentiostatic electrochemical deposition was used for constructing MnO2 amorphous filmsonto stainless-steel substrates. Effects of concentration of Na2SO4 electrolyte solution in the range, from 0.1 to 1
M, on the capacitive behavior, charging/discharging characteristics and electrochemical impedance spectroscopy were studied. The obtained I-V or cyclic voltammogram curves indicate the existence of high capacitive behavior as a good response to the charge carrier’s polarizability. The specific capacitance decreases, from 308.52 to 183.9 F/g as the voltage scan rate increases from 10 to 100 mV/s, and the highest maximum and average power obtained are 15 and 4.25 watt which corresponds to 0.5 M electrolyte concentration. Also, the max energy density =50.045 Wh/kg and corresponds to concentration of 0.5 M Na2SO4 electrolyte.
With respect to the times of charging/discharging processes, their time constants and specific capacitance are also calculated and their results revealed that the best concentration of Na2SO4 among all tested electrolyte
solutions to construct MnO2 based supercapacitor of maximum high capacity (341.99 F/g) is 0.5 Molar. This
was interpreted due to the different effect of Na2SO4 concentration below and beyond the 0.5 M of electrolyte
concentration.
Electrochemical impedance spectra of tested films in the range of 10 mHz to 100 kHz showed both the two resistive and capacitive behaviors which are dependent on the electrolyte concentration noting that lower values of both electrical series and charge transfer resistances are found as 4.9 Ω and 21.4 Ω, associated to the Na2SO4
of electrolyte solution of 0.5 M concentration.
Keywords: Anodic deposition; MnO
2 Supercapacitors; electrochemical impedance spectroscopy (EIS)--- --- Date of Submission: 09-02-2019 Date of acceptance:24-02-2019 ---
---I.
INTRODUCTION
In the recent past decades, MnO2 has attracted great attention with respect to the technology of
super-capacitor and energy storage. This is due to its linear I-V dependence capacitive electrode, energy storage attributed to ion insertion/desertion within MnO2surface depending on particle size, surface area and porosity in
addition to the abundance and un toxicity of manganese rather than the ruthenium oxide which is toxic and expensive [1-3].For achievement optimized conditions for obtaining high specific capacitance and energy, different morphologies of manganese dioxide have been developed, e.g., nanorods[4], nanosheets[5] and nanowires [6] etc., where, the synthesis route has found to play an important and vital role in determining the required morphology.
MnO2 has been prepared by several different methods like, chemical precipitate [7], sol-gel [8],
pyrogenation[9], mechanical grinding [10], electrochemical deposition [11] and hydrothermal synthesis [10, 12]. It has been reported [4, 11, 14, and 15] that the electrochemical deposition method was proven to be more effective for preparing MnO2 nanostructures.
Also, electrochemical deposition of MnO2 could be prepared via two approaches; anodic oxidation and
cathodic reduction. In the anodic oxidation, cationic Mn2+ precursor is commonly used, but anionic MnO4
-(Mn7+) is used in cathodic reduction. Both of anodic oxidation and cathodic reduction can be manipulated by potentiostatic (PS) at constant potential as well as galvanostatic (GS) at constant current density processes [6, 16-20].
It is worth mentioning that both (PS) and (GS) techniques could be electrochemically employed to produce nanostructures as well as amorphous films of MnO2 films. Anodic [21] and cathodic [1] investigations
demonstrated that the galvanostatic tested nanostructured MnO2 films are associated with the higher values of
electrical specific capacitance than those ones corresponding to potentiostatic films. On the other hand, the results reported [22] on amorphous MnO2films, electrochemically and anodically deposited on Stainless-Steel
Anodic deposition of MnO2 on a carbon substrate in manganese acetate solution was investigated [23],
where, the effects of electrolyte concentration, in the range, 0.01 to 1 M and different temperatures from 0 to 50
o
C, on the characteristics of prepared manganese oxide were explored. The reported results [23] revealed that the concentration of manganese acetate solution could affect the oxidation state of manganese ions as well as the morphology of the deposited oxide, i.e., the specific capacitance of the MnO2 increased with decreasing
deposition temperature as well as the capacitance has its maximum value for the oxide deposited in 0.5 M manganese acetate solution.
The present work is aimed: i) to prepare, anodically and PS electrodeposited MnO2thin films from 0.25
M (CH3COO)2Mn.4H2O solution at 1 Volt on Stainless-Steele substrate and ii)the effect of molar concentration
of the Na2SO4 electrolyte on their capacitive behavior for supercapacitor applications will be studied.
II.
EXPERIMENTAL
2.1 Electrochemical deposition of MnO2 films
Stainless-Steel (SS) foils commercially available (type 304) of thickness 0.175 mm were cut as samples of 1× 2 cm2 each to be used as working electrodes for the electrochemical deposition. The samples were first etched in Hydrochloricacid, 38% concentration for 10 minutes, and then washed with distilled water and air dried. MnO2 thin films were anodically electrodeposited from 0.25 M (CH3COO)2Mn.4H2O solution by
potentiostatic (PS) conditions at 1 Volt. The estimated mass loading of the deposited MnO2 film was 300
µg/cm2, which controlled by adjusting the total charge passed through the electrode during deposition time.
2.2 Electrochemical characterization of MnO2/SS electrode
All electrochemical deposition and measurements were performed by conventional three electrode system using SP-150 potentiostat/galvanostat device in an electrochemical cell with stainless steel substrate as a working electrode, Ag/AgCl (NaCl saturated) as a reference electrode, Pt wire as a counter electrode, and 0.5 M Na2SO4 solution as the characterization electrolyte. The deposited MnO2 thin films were tested for
supercapacitor application by studying the effect of Na2SO4 electrolyte concentration in the range, from 0.1 to 1
M on cyclic voltammetry, charge-discharge, and electrochemical impedance spectroscopy (EIS) measurements. Cyclic voltammetry (CV) tests were conducted in a potential range of 0-1 V at scan rates of 10-100 mV/s. Galvanostatic charge/ discharge cycling was conducted at current density of 1-10 mA/cm2 between 0 and 1 volt. EIS data were collected at alternating current root mean square voltage amplitude 10 mV in a frequency range of 100 kHz-10 mHz.
III.
RESULTS AND DISCUSSION
3.1 The cyclic voltammetry curves
The structure of the etched bare stainless-steel (SS) as well as the electrodeposited MnO2 on it was
previously studied using X-ray and SEM imaging [22].
The cyclic voltammetry curves of potentiostatic deposition of MnO2 films on etched SS electrodes
were recorded in an electrolyte solution of 0.5 M of Na2SO4 concentration are recorded at different scan rates,
ranging from10 mV/s to 100 mV/s in the potential range, from 0 to1 volt are shown in Fig.1. These curves show that, as the electric potential (V) reaches one volt (maximum value) the current (I) start to decay to reach minimum value as the electric potential (V) reaches zero. The growth and decay I-V curves, are forming a nearly rectangular loop of area representing, the stored electric energy as a result of MnO2 polarization. The
0.0 0.2 0.4 0.6 0.8 1.0 -12
-10 -8 -6 -4 -2 0 2 4 6 8 10
cu
rre
n
t
d
e
n
si
ty
A/
cm
2
Voltage V
10 mV/sec 20 mV/sec 30 mV/sec 40 mV/sec 50 mV/sec 60 mV/sec 70 mV/sec 80 mV/sec 90 mV/sec 100 mV/sec
Fig. 1: I-V curves of (PS) deposited MnO2 films at different scan rates in a 0.5 M electrolyte of Na2SO4.
It is well known that, as the integrated area of the I-V curves increases, the higher specific capacitance
(SC) of the deposited film can be calculated using the relation S.C = ,where, (Q) is the capacitive charge, (m) the mass of the deposited film, (∆V) is the width of the potential window. The values of SC were tabulated in Table (1).
Table (1): Specific capacitance values for tested PS deposited MnO2 films as calculated at different indicated
voltage scan rates. Voltage Scan
rate(mV/S) 10 20 30 40 50 60 70 80 90
Specific Capacitance
(F/g) for (PS) method
308.52 278.53 258.77 243.2 230.03 218.68 208.38 198.52 190.67
Refereeing to Table (1), it can be generally observed that, the specific capacitance value decreases as the voltage scan rate increases. This decrease in the SC values with increasing voltage scan rate has been commonly observed. This has been attributed to an increase of the resultant electric field as a result of the polarization of deposited MnO2.
3.2 Effect of electrolyte concentration on CV curves.
Fig. 2 shows all the cyclic voltammetry (CV) comparison curves of PS deposited MnO2 films on etched SS
electrodes recorded for different molar concentrations, (0.1, 0.3, 0.5, 0.7, 1) in Na2SO4 electrolytes, respectively,
0.0 0.2 0.4 0.6 0.8 1.0 -8
-6 -4 -2 0 2 4 6 8 10
C
u
rre
n
t
d
e
n
si
ty
A/
cm
2
Voltage V 0.1 M
0.3 M 0.5 M 0.7 M 1 M
Fig. 2: I-V curves of PS deposited MnO2 films measured in different concentrations of Na2SO4 electrolytes at
same scan rate, 90 (mV/s).
From previous I-V curves in Fig.2, the values of the maximum and the average stored electric power was calculated for all tested concentrations of the Na2SO4electrolyte and are given in Table (2). However, the
variation of the maximum power with the electrolyte concentration is illustrated in Fig. 3.
Table (2): Maximum and average power for tested PS deposited MnO2 films for different electrolyte
concentrations.
Concentration (M) Pmax (Watt) Pav (Watt)
0.1 10 3
0.3 13 4
0.5 15 4.25
0.7 9 3.25
1 10 3
0.0 0.2 0.4 0.6 0.8 1.0
9 10 11 12 13 14 15
Pma
x
(W)
Concentration (M)
It is clear from Fig.3 that the highest maximum power obtained is 15 watt which is corresponding to 0.5 M electrolyte concentration. Also, the specific capacitance for each electrolyte concentration was calculated as a function of the voltage scan rate and given in Table (3).
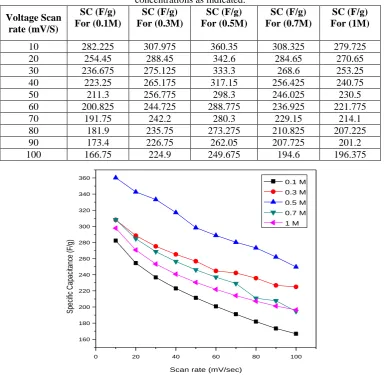
Table (3): Specific Capacitance for tested PS deposited MnO2 films with scan rate in different electrolyte
concentrations as indicated.
Voltage Scan rate (mV/S)
SC (F/g) For (0.1M)
SC (F/g) For (0.3M)
SC (F/g) For (0.5M)
SC (F/g) For (0.7M)
SC (F/g) For (1M)
10 282.225 307.975 360.35 308.325 279.725
20 254.45 288.45 342.6 284.65 270.65
30 236.675 275.125 333.3 268.6 253.25
40 223.25 265.175 317.15 256.425 240.75
50 211.3 256.775 298.3 246.025 230.5
60 200.825 244.725 288.775 236.925 221.775
70 191.75 242.2 280.3 229.15 214.1
80 181.9 235.75 273.275 210.825 207.225
90 173.4 226.75 262.05 207.725 201.2
100 166.75 224.9 249.675 194.6 196.375
0 20 40 60 80 100
160 180 200 220 240 260 280 300 320 340 360
Sp
eci
fic
C
ap
aci
ta
nce
(F
/g
)
Scan rate (mV/sec)
0.1 M 0.3 M
0.5 M 0.7 M
1 M
Fig.4: Variations of Specific Capacitance with the voltage scan rate for different tested concentrations, 0.1, 0.3,
0.5, 0.7 and 1 Molar of Na2SO4 electrolytes.
It is clear from Fig. 4, for each electrolyte concentration that the specific capacitance values decrease as the voltage scan rate increases. This common behavior may be attributed to the increase of the actual area of the studied amorphous MnO2 film as has been deposited in a form of hills and valleys [22] with surface area wider
than the original electrode area (1 cm2).
On the other hand, the specific capacitance for each electrolyte concentration as a function of the voltage scan rate (see Table (3)). The recorded maximum specific capacity of the constructed super capacitor was corresponding to 0.5 M electrolyte concentration. This may be due to the increase of the electrolyte molecular polarization till it reaches 0.5 M. After this 0.5 molar concentration, the value of the molecular polarization decreases due to the increase of the electrolyte viscosity, which decreases the molecular orientation, i.e., decrease the molecular polarization and as a result does the specific capacitance.
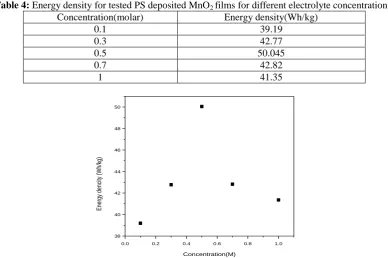
The values of energy density were calculated for the cases of tested concentrations (0.1, 0.3, 0.5, 0.7, 1) molar of Na2SO4 electrolytes by using the equation: E = (½) CV2, where C is the specific capacitance and V is
Table 4: Energy density for tested PS deposited MnO2 films for different electrolyte concentrations.
Concentration(molar) Energy density(Wh/kg)
0.1 39.19
0.3 42.77
0.5 50.045
0.7 42.82
1 41.35
0.0 0.2 0.4 0.6 0.8 1.0
38 40 42 44 46 48 50
Ene
rg
y
de
nci
ty
(W
h/
kg
)
Concentration(M)
Fig. 5: the concentration dependence of energy density in tested PS MnO2/SS electrode in different
concentrations Na2SO4 electrolytes.
From this figure it is clear that the value of max energy density equals 50.045 Wh/kg and corresponds to concentration of 0.5 M Na2SO4 electrolyte. This means that the most suitable Na2SO4 electrolyte
concentration used electrolyte solution to construct MnO2 based supercapacitor of maximum specific capacity
341.99 F/g is 0.5 molar. This may be due to that, the increase in Na2SO4 concentration from 0.1 M to 0.5 M
meets the increase of the electric polarization due to high degree of freedom of the molecular orientation under the effect of the resulted electric field.
On the other hand, the increase of the Na2SO4 concentration more than the above critical value (0.5 M)
may cause the start to reduce the freedom of the molecular orientation under the effect of the resulted electric field of the decreased electric polarization. This decrease in the molecular orientation mobility increases as the electrolyte concentration increases than 0.5 M. This leads to the observed decrease in the polarization and thus the decrease of the specific capacity.
3.3 Charge-Discharge curves dependence on electrolyte concentration
Charge-discharge curves of the prepared electrodes were conducted using chronopotentiometry at current density 1mA/cm2, for each concentration of Na2SO4 electrolyte and are shown in Fig. 6.
Fig. 6: Charge- discharge curves of deposited MnO2 films at constant current density value 1mA/cm2 for
From the Fig. 6, it can be noticed, for each tested concentration, the voltage increases to reach maximum value at the end of the charging process half cycle. As, the voltage reaches max value, it starts to decrease during the other discharging half cycle. The values of specific capacitance were obtained from charge-discharge curves by using the following equation: SC =
, where I is the discharge current, m is the mass of
the MnO2 film, and dv/dt is the slope of the discharge half cycle. Also, the time required for both charging and
discharging, as well as, the time constants were all calculated for each electrolyte concentration and the obtained results are listed in Table (5).
Table (5): Specific capacitance, charging time, discharging time and time constant values, for tested PS
deposited MnO2 films for different electrolyte concentrations.
Concentration (molar)
Charging half cycle Dis-charging half cycle
Specific Capacitance(F/g) Time
(sec)
Time constant
(sec)
Time (sec)
Time constant (sec)
0.1 40 20 58 40 292.57
0.3 60 32 70 40 336.24
0.5 55 33 78 55 341.99
0.7 55 30 59 34 318.47
1 48 20 58 40 307.31
From the obtained results of Fig. 6 and table (5) we can conclude that the best concentration of Na2SO4
as an electrolyte solution to construct MnO2 based super-capacitor of maximum high capacity is 0.5 Molar. This
may be due to that the effect of increase of Na2SO4 concentration from 0.1 M to 0.5 M meets as was interpreted
and mentioned previously in sec. 3.2 [25].
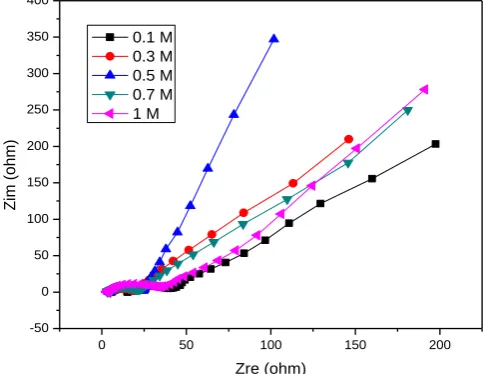
3.4 Electrochemical Impedance Spectroscopy (EIS)
Fig. 7: shows the Nyquist plots (the imaginary and real parts of the electrical impedence, Zimm versus
Zreal) for the (PS) deposited MnO2 films as tested in different concentrations (0.1, 0.3, 0.5, 0.7, 1) molar of
Na2SO4 electrolyte. Measurements were carried out in the frequency range (10 mHz -100 kHz) at 10mV
amplitude.
0 50 100 150 200
-50 0 50 100 150 200 250 300 350 400
Z
im
(o
h
m)
Zre (ohm) 0.1 M
0.3 M 0.5 M 0.7 M 1 M
Fig. 7: Nyquist plots of MnO2 deposited films investigated in different concentrations of Na2SO4 electrolyte in
the frequency range of 10 mHz –100 kHz at 10 mV amplitude.
From this Fig. 7, it is obvious to note the dependence of Zim on Zreal shows the appearance of
semi-circles and a linear behavior at high frequency and low frequency regions, respectively. These results indicate the resistive and capacitive behaviors of the tested electrode. Intercepts of the obtained semi-circles at the beginning with the real impedance axis, gives the corresponding values of the equivalent series resistance (ESR) as a dominant resistive behavior of the constructed supercapacitor, while, values of the diameters of the obtained semicircles define the charge transfer resistance (Rct) for tested electrode in each concentration [13, 30].
Table (6): Values of RESR& Rct for tested PS deposited MnO2 films for different electrolyte concentrations.
Concentration(Molar) RESR (Ω) Rct (Ω)
0.1 15.10 34.5
0.3 6.53 21.4
0.5 4.9 15.5
0.7 4.95 21.95
1 6.66 41.62
From Table (6) it is seen that the lowest values of both resistances, RESR& Rct are 4.9 Ω and 15.5
Ωcorresponding to the value of 0.5 M concentration in agreement with all previous results of this work and confirms that anodic potentiostatic electrodeposited amorphous MnO2 film on SS substrate and that reported
[26] on the effect of manganese acetate concentration in the range, 0.05 to 1M may help good for supercapacitor application.
IV.
CONCLUSION
In the present study, anodic potentiostatic electrochemical deposited MnO2 amorphous film onto
stainless-steel substrate was prepared. Effects of concentration of Na2SO4 electrolyte solution in the range, from
0.1 to 1 M, on the capacitive behavior, charging/discharging characteristics and electrochemical impedance spectroscopy were investigated. The obtained results revealed that cyclic I-V curves indicate the existence of high capacitive behavior as a good response to the charge carrier’s polarizability. The specific capacitance decreases, from 308.52 to 183.9 F/g as the voltage scan rate increases from 10 to 100 (mV/s) and the highest maximum and average power obtained are 15 and 4.25 watt which corresponds to 0.5 M electrolyte concentration. Also, the max energy density =50.045 Wh/kg and corresponds to concentration of 0.5 M Na2SO4
electrolyte.
Investigation of charging/discharging processes, has led to the calculation of their time, time constants and specific capacitance and the results obtained revealed that the best concentration of Na2SO4 among all tested
electrolyte solutions to construct MnO2 based supercapacitor of maximum high capacity is 0.5 Molar. This was
interpreted due to the different effect of Na2SO4 concentration below the 0.5 M and beyond which meets the
increase as well the decrease of electric polarization according to freedom of molecular orientations, Electrochemical impedance spectra of tested films in the range of 10 mHz to 100 kHz showed both the two resistive and capacitive behaviors which are dependent on the electrolyte concentration noting that lower values of both electrical series and charge transfer resistances are found as 4.9 Ω and 21.4 Ω, associated to the 0.5 M concentration of the Na2SO4 of electrolyte solution.
Finally, we can conclude that the best concentration of Na2SO4 as an electrolyte solution to construct MnO2
based supercapacitor of maximum high capacity is 0.5 Molar.
REFRENCES
[1]. G. A. M. Ali, M. M. Yusoff, Y. H. Ng, H. N. Lim, and K. F. Chong, "Potentiostatic and galvanostatic electrodeposition of manganese oxide for supercapacitor application: A comparison study," Current Applied Physics, vol. 15, pp. 1143-1147, 2015/10/01/ 2015.
[2]. S. C. Pang, M. A. Anderson, and T. W. Chapman, "Novel Electrode Materials for Thin‐Film Ultracapacitors: Comparison of Electrochemical Properties of Sol‐Gel‐Derived and Electrodeposited Manganese Dioxide," Journal of The Electrochemical Society, vol. 147, pp. 444-450, January 1, 2000 2000.
[3]. D. Z. W. Tan, H. Cheng, S. T. Nguyen, and H. M. Duong, "Controlled synthesis of MnO2/CNT nanocomposites for supercapacitor applications," Materials Technology, vol. 29, pp. A107-A113, 2014/11/01 2014.
[4]. T. Yousefi, A. N. Golikand, M. HosseinMashhadizadeh, and M. Aghazadeh, "Facile synthesis of α-MnO2
one-dimensional (1D) nanostructure and energy storage ability studies," Journal of Solid State Chemistry, vol. 190, pp. 202-207, 2012/06/01/ 2012.
[5]. D. Yan, Z. Guo, G. Zhu, Z. Yu, H. Xu, and A. Yu, "MnO2 film with three-dimensional structure prepared
by hydrothermal process for supercapacitor," Journal of Power Sources, vol. 199, pp. 409-412, 2012/02/01/ 2012.
[6]. T. Yousefi, R. Davarkhah, A. N. Golikand, and M. H. Mashhadizadeh, "Synthesis, characterization, and supercapacitor studies of manganese (IV) oxide nanowires," Materials Science in Semiconductor Processing, vol. 16, pp. 868-876, 2013/06/01/ 2013.
[7]. M. Toupin, T. Brousse, and D. Belanger, "Influence of Microstructure on the Charge Storage Properties of Chemically Synthesized Manganese Dioxide," Chemistry of Materials, vol. 14, pp. 3946-3952, 2002. [8]. R. N. Reddy and R. G. Reddy, "Sol-gel MnO2 as an electrode material for electrochemical capacitors,"
[9]. H. Lee and J. Goodenough, "Supercapacitor Behavior with KCl Electrolyte," Journal of Solid State Chemistry, vol. 144, p. 220, 1999.
[10]. V. Subramanian, H. Zhu, R. Vajtai, P. M. Ajayan, and B. Wei, "Hydrothermal Synthesis and Pseudocapacitance Properties of MnO2 Nanostructures," The Journal of Physical Chemistry B, vol. 109, pp. 20207-20214, 2005/11/01 2005.
[11]. C. C. Hu, T. W. Tsou, ElectrochimActa 47 (2002) 3523.
[12]. V. Subramanian, H. W. Zhu, R. Vajrai, P.M.Ajayan, B.Q.Wei, J. Phys. Chem., B 109 (2005) 20207. [13]. Fang Xiao, YoulongXu Pulse electrodeposition of Manganese Oxide for High – Rate capability
supercapacitors. Int. J. Electrochem. Sci. 7 (2012) 7440-7450.
[14]. X. Hu, X. Lin, Y Li, X. Fu, Fabrication and characteristics of galvanostatic electrodeposited MnO2 on
pourus nickel from etched aluminum. Electrochem.Acta 138 (2014) 132-138.
[15]. G.A.M. Ali, L.L. Tan, R. Jose, M.M. Yousoff, K.E. Chong, Electrochemical performance studies of MnO2nanoflowers recovered from spent battery. Matter. Res. Bull. 60 (2014) 5-9.
[16]. G. Yang, B. Wang, W. Guo, Z. Bu, C. Miao, T. Xue, H. Li, Liquid crystalline phase synthesis of nanoporous MnO2 thin film arrays as an electrode material for electrochemical capacitors, Mater, Res,
Bull, 47 (11) (2012) 3120-3123.
[17]. G.M. Jacob, I. Zhitomirsky. Microstructure and properties of Manganese Dioxide films prepared by electrodeposition. Appl, Surf, Sci. 254 (20) (2008) 6671-6676.
[18]. M.Gupta, D. Pinisetty, J.C. Flake, J.J. Spivey, J. Electrochem. Soci. 157 (2010) 473. [19]. J. Wu, C.D. Johonson, Y. Jiang, R.S. Gemmen, X. Liu, Electrochem. Acta 54 (2008) 793. [20]. J.P. Wang, Y. Xu, J. Wang, X. Du, F. Xiao, J. Li, Synth. Met.160 (2010) 1826.
[21]. Suhasini, Effect of deposition method and the surfactant on high capacitance ofelectrochemically deposited MnO2 on stainless-steel substrate, J. Electroanal. Chem. 690 (2013) 13-18.
[22]. M.M. El-Zaidia, A.H. Khafagy, S. Hassan, M.Z. Zaki, Energy Storage using MnO2
supercapacitorelectrod IOSR. Journal of Engineering (IOSRJEN) Vol. 07 Issue 09 (2017) 14-21.
[23]. Suhasini, Effect of deposition methodand the surfactant on high capacitance of electrochemically deposited MnO2 on stainless steele substrate, Journal of Electroanalytical Chemistry 690 (2013) 13-18.
[24]. Yuan, A., et al., Comparison of nano-MnO2 derived from different manganese sources and influence of
active material weight ratio on performance of nano-MnO2/activated carbon supercapacitor. Energy
conversion and management., 2010. 51(12): p. 2588-2594.
[25]. Tsay, K.-C., L. Zhang, and J. Zhang, Effects of electrode layer composition/thickness and electrolyte concentration on both specific capacitance and energy density of supercapacitor. Electrochimica Acta,60(2012) p 428-436.
[26]. J. K. Chang and W.T.Tsai, Effects of temperature and concentration on the structure and specific capacitance of manganese oxide in manganese acetate solution. Journal of Applied Electrochemistry, 34; (2004) p.953-961