Estimation of Joints Performance in Human Running
through Mocap Data
Sajid Ali
1, Mingquan Zhou
1*, Zhongke Wu
1, Usman Muhammad
2, M. Azam Zai
3, Murad Ali Shah
4 1 College of Information Science and Technology, Beijing Normal University, Engineering Research Center of Virtual Reality Application, Ministry of Education (MOE), P.R. C, Beijing, China.2 School of Computer and Control Engineering, Chinese Academy of Sciences, Beijing, China.
3 School of Computer Science and Technology, Bejing University of Posts & Telecommunication, Bejing, China. 4 School of Mathematics, Bejing Normal University, Bejing, China.
* Corresponding author. Email: [email protected]
Manuscript submitted July 15, 2015; accepted November 2, 2015. doi: 10.17706/jcp.11.4.289-299
Abstract: In Human, the lower limb joints attained more importance during the locomotor system, they play a valuable role during different styles of movement. The study of the 3D biomechanics of these joints have significance important for recording the morphological changes allied with the acquisition of a habitual bipedal gait in humans. Human body on any joint has important inference in joint stability and performance. In this paper, we measure the performance of human lower limb joints (hip, knee and ankle) during running based on statistical techniques. The data of joints acquisition from the motion captured system. This data provides plentiful information in human running. For instance, we can determine which joint has more variation in human running gait based on mocap of each joint. Our experimental results indicate that among these joints, the knee joint has a dominant influence in human running gait.
Key words: Joint movement, gait analysis, joints estimation, variation influence.
1.
Introduction
In Human, the lower limb joints attained more importance during the locomotor system, they play a valuable role during different styles of movement. Many applications can be found in human motion synthesis and joint performance measurement in human running. Human motion data has been a popular approach for analyzing, synthesizing and animation of the human joint motion, thanks to the recent improvement of motion capture systems. In particular, there has been a lot of interests in the ways of using and re-using motion capture data [1]-[8]. Gait joints evaluation is a kind of biometrics and clinical science [9], which aims to evaluate individual joint performance. Gait analysis methodology and clinical gait evaluation methods are discussed in [10], [11]. The formal definition of human walk style, kinesiological recording and measurement techniques are discussed in [12]. Data reduction techniques [13] are proposed to determine joints movement and powers based on three dimensional marker position information. Growney et al. [14] described statistical approach for gait evaluations using joints kinematic and kinetic data collected from normal subjects.
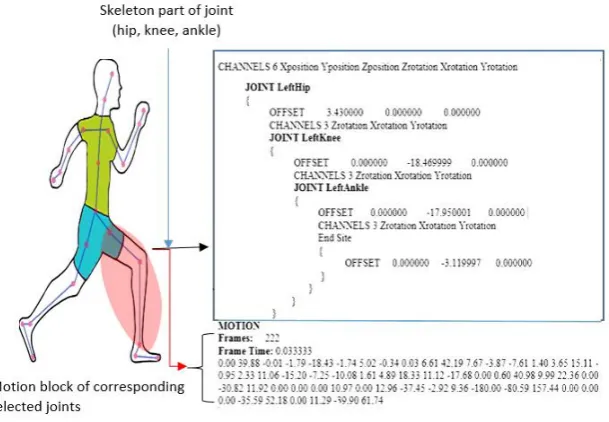
researchers have used motion in different types of applications as gait analysis, synthesis, distinct behaviors, animation and gait recognition of the whole motion of joints [17]-[20]. In this paper, we use statistical moment on mocap to determine which joint has a maximum contribution during running, inspired by the aforementioned research. The motion capture data format files [21], [22] such as Biovision Hierarchical data, is used for it. It includes the position of the root and orientation of other joints only. We use the Biovision Hierarchical data format because it is easy to extract motion data from motion file. This file has two parts, one is the skeleton information and the other is motion data. The data corresponding to these three joints is a rotational data(channel). The selected joints of the human body are highlighted with different color points (see Fig. 1).
Fig. 1.Skeleton joint in running gait.
In this work, we will consider only three joints: hip, knee and ankle. Fig. 2 shows the skeleton structure and its important running joints gait.
Fig. 2. Example of three joints motion data.
variance of the joints, which we believe is the most important performance measure. It shows how much variation occurs during running. The joint with largest variance therefore has maximum participation and consequently is the one that has maximum effect [21]. Based on this concept, more importance is given only to one joint during human running. This will greatly reduce the complexity of the problem of human gait analysis and in physical animation techniques in the future. Note that the BVH file format has been used for animation and daily life activities [23], [24]. Fig. 3 illustrates the mocap applications. here we use mocap data similar type of activity but little different from them. We have used mocap data for analysis to examine the lower limb joint during human running through statistical analysis.
Fig. 3. Applications of mocap data.
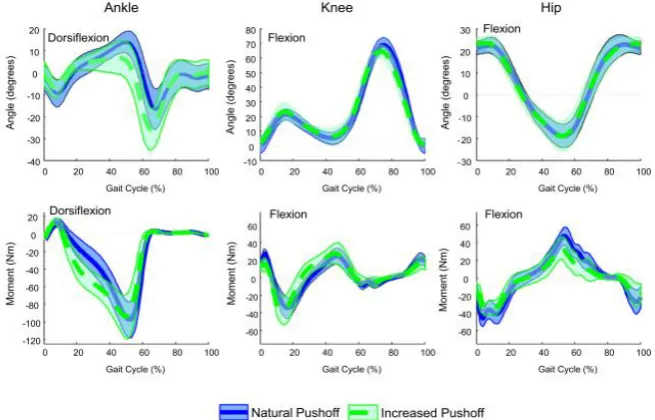
This is a novel technique which will be of great use in the field of biometrics. The importance of the knee joint in running has been established in various studies [25]-[30]. Verron [33] has been evaluated the joints performance by using sensor data. Their results of the lower limb joints movement shown in Fig. 4.
Fig. 4. Joint evaluated performance based on mocap data.
This paper is organized as follows. In Section 2, we will give an overview of our system. We will then describe the construction of the database and present a proposed flowchart in Section 3. The experimental results will be demonstrated in Section 4. The paper ends with a conclusion in Section 5 as well as a brief discussion on future work.
2.
Overview of the System
select important joints: hip, knee and ankle. Statistical techniques are applied to the data obtained from the motion of joints and determine which joint has more variation in generating running gait motion process. Fig. 5 shows the process of constructing the database and Figure 6 illustrates the workflow during the system execution.
2.1.
Proposed Database
The process of constructing the proposed motion database is summarized in Fig. 5. The user provides motion files in ASF/AMC [31] format represented as a pair of skeleton and motion information. The skeleton part consisting of the human skeleton and motion part is related to the joint angular movement, obtained by motion capture systems. However, joint angle representation strictly depends on the skeleton model of humans. These pairs of files are converted into a single file as a BVH file format by using technical script techniques (BVH Converter). The BVH file is populated in Biovision data format with the hierarchical data structure representing the bones of the skeleton structure. The BVH file has section parts: the first section contains the hierarchy of the body joint with initial pose of the skeleton, while the second section has channel data corresponding to each joint. These channels data in different orders like as yzx, zxy and zyx. Here we use the zyx order to generate channel data and is arranged in xyz order.
Run Script convert ASF/AMC into BVH
Applying Dynamic methods to control equal no of frame
and running step
Running Database
ASF/AMC ASF/AMC ASF/AMC
File
ASF/AMC ASF/AMCBVH
Motion capture system
Fig. 5. Architecture of database.
2.2.
Proposed Flowchart
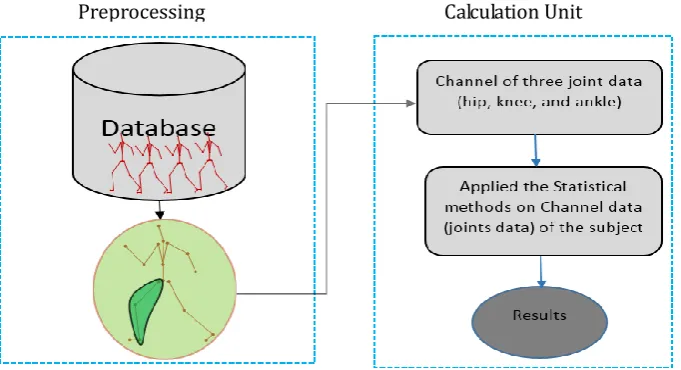
The flowchart is divided into two units as shown in Fig. 6: one is called the preprocessing unit and the other is called the calculation unit.
Fig. 6. Block diagram of proposed method.
Preprocessing Unit
Preprocessing
The preprocessing unit has three steps. In the first step, ASF/AMC files are captured by the motion capture system. The second step is to convert the ASF/AMC file into the BVH file format. Finally, the preprocessing unit store the BVH files in database, having equal number of frames and running steps of the subject. Calculation Unit
The calculation unit also has two steps. The first step is to extract the motion data of the joints from the motion database. The second step is to apply statistical techniques on motion data of the joints and to obtain the evaluation results.
3.
Statistical Approach to Target a Solution
As mentioned in sequel, we are interested in determining the variance of the joints. We use the motion data of one subject that runs 7 times. Every time the subject runs several steps within 130 frames. So the important quantity which would measure joint participation is the mean of the variances of the joints. The calculation was carried out in the following steps.
3.1.
Mean of Joint
First, we computed the hip joint average movement of the x, y, z coordinates, which shows the change in hip joint during running gait. The average movement changes is computed by the following objective functions as
1
1
z N cc i
c x i
Avgh
N
(1)where N is the total number of frames in motion block,
Avgh
cis means of hip joint,
ic denote the valuesof the x, y, z coordinates of the hip joint. Eqs. (1) to comupute the means of other two joints, i.e. knee and ankle. The results of these equations shown in Table 1.
3.2.
Average Mean of Mean Joint
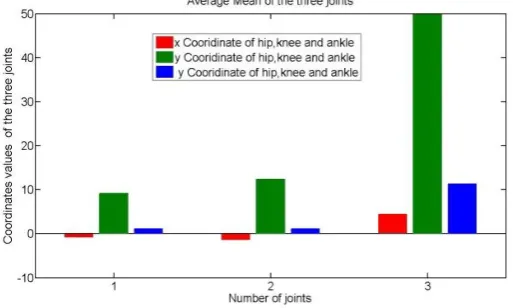
In the next step, we compute overall average of each coordinate of the joints. It is computed by
Hip=
1
of corrdinate
z
x
X
Avgh
No
where
φ
=
x, y, z
andX
Hipoverall average of the hip joint. Similarly, we calculate average mean ofmean of knee and ankle joints and indicated as
X
Knee andX
Ankle. These values can be seen in Fig. 7.3.3.
Variance of Joint
Next, we compute the variance of the x, y and z coordinates of the hip, knee and ankle joints as follows:
2 hip hip 1 2 hip 1 ( ) i N i
x x X
N
(2)2 2
hip hip hip
1 1 ( ) i N y i y Y N
(3)2 2
hip hip hip
1
1
(
)
i N z iz
Z
N
(4)Eqs. (2), (3) and (4) determine the variation in hip joint during human running. Similarly, we compute variances for the other two joints (knee and ankle) by using these equations. The results of this calculation can be shown in Table 1.
Table 1. Means of x, y, z Coordinates for Hip, Knee and Ankle Joints
Subject Hip joint Knee joint Ankle joint
x y z x y z x y z
1 -0.26549 -0.774 3.826603 7.789742 11.90076 45.3789 1.300177 0.010283 12.80141
2 -2.08308 -2.03344 4.972527 8.203482 12.57675 47.53285 1.103887 1.945817 9.455792
3 -0.28199 -2.43422 3.775009 8.886039 11.97486 48.16506 1.58211 4.421688 16.38567
4 0.045963 -1.17084 4.350862 7.342676 12.16152 44.5491 0.598868 -1.95819 5.540112
5 -0.25218 -1.34849 4.73447 12.28904 13.41823 60.44015 0.638362 -0.17656 10.31189
6 -1.37122 -2.02267 4.544908 11.84825 12.72502 58.32145 1.366916 3.268842 15.82832
7 -1.07967 0.697232 4.736118 7.633704 11.5997 44.43967 0.929731 0.479925 8.660778
3.4.
Average Variance of Joints
Based on the results of the Eqs. (2), (3) and (4), we then compute the average variance of the hip joint by
2
Hip hip
1
z i i xVar
(5)where
i = x, y, z
,δ
indicate total number of coordinates andVar
Hip is the mean of average variability of hip joint. Similarly, we can determine the variances of the other two joints (knee and ankle), which are denoted byVar
knee andVar
ankle.3.5.
Total Variance of Joints
Finally, we compute total variance of three joints in the motion block data during running gait. It is computed by
Hip knee Ankle
(
,
,
)
T
Var
Var
Var
(6)Hip
Influence_hip 100
Var T
T
(7)
knee
Influence_knee 100
Var T
T
(8)
ankle
_ankle
Influence 100
Var T
T
(9)
Eqs. (7), (8) and (9) show the total variation in percentage of hip knee and ankle joints in motion block. We have found that the knee joint has a more important role in human movement than. Seven results of the joints are shown in Table 2 and Fig. 8, Fig. 9 in the next section.
Table 2. Variance of the X, Y, and Z Coordinate of the Joint
Subject Hip joint Knee joint Ankle joint
X y z x y z x y z
1 14.79861 8.551304 2.332596 79.655 32.00908 1083.693 1.845016 74.3048 296.4007
2 20.6078 12.43736 3.113513 74.53251 30.48464 1002.54 1.125832 74.6599 288.8297
3 21.59525 28.23605 3.645712 93.95779 41.10571 1322.96 2.36954 72.1062 269.6457
4 20.18089 8.86.148 3.867272 65.97616 28.39296 896.0824 0.913357 52.2715 205.7401
5 24.37842 14.92971 2.30512 125.2273 37.34182 1632.266 08041 75.8587 151.7504
6 25.30926 14.93489 2.785217 134.0311 39.74311 1777.497 1.780475 87.2622 227.5726
7 21.12981 10.13733 6.412555 81.70494 33.17865 1121.651 0.972012 65.2786 250.7709
Average
Variance 148.0001 98.08679 24.4619 655.081 242.256 8836.69 9.81033 501.742 1690.71
Fig. 8. Joint influence during several times walk.
4.
Experimental Results
We have conducted a series of experiments to evaluate the performance of the proposed method. We used motion data of one subject in our experiment runs a couple of times. Each time the subject takes some steps while running in 130 frames. The dataset is available at [32]. Table 1 shows the mean of each joint. Fig. 7 shows the average mean of hip, knee and ankle joint. Table 2 shows the variances of the x, y, and z
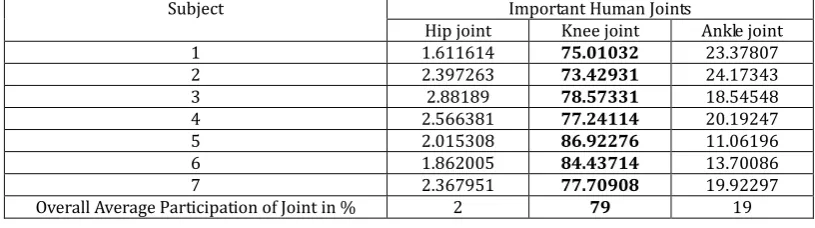
Table 3. Joints Utilization in the Motion
Subject Important Human Joints
Hip joint Knee joint Ankle joint
1 1.611614 75.01032 23.37807
2 2.397263 73.42931 24.17343
3 2.88189 78.57331 18.54548
4 2.566381 77.24114 20.19247
5 2.015308 86.92276 11.06196
6 1.862005 84.43714 13.70086
7 2.367951 77.70908 19.92297
Overall Average Participation of Joint in % 2 79 19
Fig. 9. Average participation of joints in motion.
5.
Conclusion
In this paper, we estimates the joints performance that allows us to identify which joint has the decisive influence among the joints in human running. Our study shows that the knee joint has the maximum influence. Our experimental results also indicate that the hip joint, knee joint and the ankle joint account for 2%, 79% and 19% of influence, respectively, during human running. We are the first to use the BVH file for evaluating the participation of the human joints in running gait. The BVH files are mainly used by researchers in animation, motion retargeting and synthesis, etc. Our approach and results will be useful for sports technology, human motion analysis, human identification and computer animation. In the future, we will further strengthen our approach and results by studying a much larger database. This method can also be extended to investigate which joint has the most significant impact in other types of human motions such as jumping or different styles of walking.
Acknowledgment
The data used in this paper were obtained at [32]. Thanks for their sharing. This research is supported by the National Natural Science Foundation of China under Grant No.61170203, 61170170, The National Key Technology Research and Development Program of China under Grant No.2012BAH33F04, Beijing Key Laboratory Program of China under Grant No.Z111101055311056.
References
[1] Aggarwal, J., & Cai, Q. (1999). Human motion analysis: A review. Computer Vision and Image Understanding, 73(3), 428-440.
[3] Zoran, P., & Andrew, W. (1999, August). Physically based motion transformation. Proceedings of the 26th
annual Conference on Computer Graphics and Interactive Techniques (pp. 11–20).
[4] Victor, B. Z., & Nicholas, C. van der H. (2003). Mapping optical motion capture data to skeletal motion using a physical model. Proceedings ofEurographics /SIGGRAPH Symposium on Computer Animation (pp. 245-250).
[5] Hsieh, M.-K., Chen, B.-Y., & Ming, O. (2005). Motion retargeting and transition in different articulated figures. Proceedings of the Ninth International Conference on Computer Aided Design and Computer Graphics (pp. 7-10).
[6] Lu, W., Liu, Y., Sun, J., & Sun, L. (2009). A motion retargeting method for topologically different characters. Proceedings of Sixth International Conference on Computer Graphics, Imaging and Visualization (pp. 105–108).
[7] Fu, J., Fan, R. K., & Chow, W. R. (2011). MocapRender: Real time animation generation from Mocap data.
JDCTA, 5(8), 179-187.
[8] Cai, M. L., Zou, B. J., & Li, J. F. (2012). An adaptive motion codebook classifier for human capture motion recognition. JCIT, 7(18), 522-531.
[9] Aurelio, C. (1984). Gait analysis methodology. Human Movement Science, 3(1), 27–54.
[10]Aurelio, C. (1983). Considerations on clinical gait evaluation. Journal of Biomechanics, 16(4), 302. [11]Sven, C. (1972). How man moves kinesiological studies and methods. Badgers Books, United Kingdom. [12]Roy, B. D. III, Sylvia, O., Dennis, T., & James, R. G. (1991). A gait analysis data collection and reduction
technique. Human Movement Science, 10(5), 575–587.
[13]Eric, G., Dwight, M., Marjorie, J., Thomas, C., et al. (1997). Repeated measures of adult normal walking using a video tracking system. Gait Posture, 6(2), 147–162.
[14]The range of movement of human body joint: From http://www.brianmac.co.uk/musrom.htm
[15]Giulia, D., Preatoni, E., Renato, R., & Claudio, C. (2007). Principal component analysis of knee angle waveforms during race walking. Proceedings of the 25th International Symposium on Biomechanics in Sports (pp. 63-66).
[16]Schutte, L. M., Narayanan, U., Stout, J. L., Selber, P., Gage, J. R., & Schwartz, M. H. (2000). An index for quantifying deviations from normal gait. Gait and Posture, 11, 25-31.
[17]Jernej, B., Alla, S., Pan, J.-Y., Christos, F., Jessica, K. H., & Nancy, S. P. (2004). Segmenting motion capture data into distinct behaviors. Proceedings of Graphics Interface, 185–194.
[18]Yan, M. C., Jin, C. R., et al. (2006). Automatic gait recognition using dynamic variance features.
Proceedings of the 7th International Conference on Automatic Face and Gesture Recognition (pp.
475-480).
[19]Diedrich, F. J., & Warren, W. H. (1995). Why change gaits? The dynamics of the walk-run transition. J. Exp. Psychol.: Hum. Percep. Perf., 21, 183–202.
[20]Gutemberg, G.-F., & Biswas, A. (2012). A human motion database: The cognitive and parametric sampling of human motion. Image and Vision Computing, 30(3), 261-261.
[21]Mike, M., & Steve, M. (2001). Motion Capture file Formats Explained (Technical Report). Department of Computer Science, University of Sheffield, Sheffield, UK.
[22]Lu, D. V., Annamaria, P., & William, D. S. (2011). Multi-person motion capture dataset for analyzing human interaction. Proceedings of RSS Workshop on Human-Robot Interaction, Los Angeles, California. [23]Vlasic, D., et al. (2007). Practical motion capture in everyday surroundings. ACM Transactions on
Graphics, 26(3).
[25]Saleh, M., & Murdoch, G. (1985). Defense of Gait Analysis Observation and Measurement in Gait
Assessment, 67(2), 237–241.
[26]Ali, S., Wu, Z., Zhou, M., Razzaq, A., Asadi, M. A., & Pervez, M. T. (2013). Weigh up performance of joints in human gait walk with motion block. Advances in Information Sciences and Service Sciences, 5(4), 474. [27]Lavcanska, V., Taylor, N. F., & Schache, A. G. (2005) Familiarization to treadmill running in young
unimpaired adults. Human Movement Science, 24, 544-557.
[28]Weaver, T. D., Wall-Scheffler, C. M., et al. (2007). The evolution of human running: Effects of changes in lower limb length on locomotor economy. J. Hum. Evol., 53, 191–196.
[29]Roach K. E., & Miles, T. P. (1991). Normal hip and knee active range of motion: The relationship to age.
Physical Therapy, 71(9), 656-65.
[30]Chung, H.-S., & Lee, Y. (2004). MCML: Motion capture markup language for integration of heterogeneous motion capture data. Computer Standards & Interfaces, 26, 113–130.
[31]The CMU Graphics Lab Motion Capture Database. From http://mocap.cs.cmu.edu/
[32]Verron, C. (2005). Traitement et Visualisation de Données Gestuelles Captées par Optotrak (Unpublished Report). Input Devices and Music Interaction Laboratory, McGill University.
Sajid Ali received the PhD from Beijing Normal Univeristy, Beijing, China and the MS (CS) and MSc (CS) degrees from the Department of Computer Science, the Agriculture University, Faisalabad, Pakistan, respectively. He is a faculty member of University of Education, Lahore, Pakistan. Currently he is a postdoctoral candidate at College of Information Science and Technology, Beijing Normal University(BNU), Engineering Research Center of Virtual Reality and Application, Ministry of Education, Beijing, China. His current research interests include motion sensor, 3D-human motion, biometrics Technology, animation and Information system, computer network
Mingquan Zhou is a professor and doctoral supervisor at the College of Information Science and Technology, Beijing Normal University and director of Beijing Key Laboratory of Digital Preservation and Virtual Reality for Cultural Heritage. His research interests are computer graphic and virtual reality.
Zhongke Wu is a full professor in the College of information science and technology, Beijing Normal University (BNU), China. Prior to joining in BNU, he worked in Nanyang Technological University (NTU), Singapore, Institute National de Recherche en Informatique et en Automatique (INRIA) in France, Institute of High Performance Computing (IHPC) and Institute of Software, Chinese Academy of Sciences in China from 1995 to 2006. Prof. Wu's current research interests include computer graphics, animation virtual reality, geometric modeling, volume graphics and medical imaging.
Usman Muhammad is a PhD (CS) candidate at the School of Computer and Control Engineering, Chinese Academy of Sciences, Beijing, China. He completed his BS and MS degrees from Harbin Engineering University and Beijing Institute of Technology respectively. His research areas are surveillance systems, digital image processing and data mining. Author’s formal
Muhammad Azam Zia is a Ph.D. candidate in the School of Computer Science and Technology, Bejing University of Posts & Telecommunication, Bejing, China. He received his B.S (CS) and MS (CS) degree from the Department of Computer Science, University of Agriculture, Faisalabad, Pakistan, respectively. He is a faculty member of Computer Science, University of Agriculture, Faisalabad, Pakistan.