Vol. 09, Issue 5 (May. 2019), ||S (XII) || PP 51-61
“A study of factors responsible for purchase decision of consumer
with respect to purchase of shampoo”
Swarda M Gulhane
Master in Business Aministration, Dr Ambedkar Institute of Management and Research,Nagpur,India
Abstract: As India is a developing country after Industrialization came in India number of sectors developed in India, making it a prosper country and also contributing to the growth in Economy. But as many Industries came in India the level of pollution in all kinds also has increased making an adverse effect on human body, and also damaging hairs to lots of extent. Therefore to protect the good health of the hairs and protecting it from the further damage the shampoo industries came into existence and also flourished.In this paper the study explored the major dominating factors which are responsible for making the purchase decision regarding the purchase of the shampoo. Why these factors are important and what are the impact of these factors on the purchase decision of the customers during the purchase of the shampoo is also been studied. The factors taken into account are Price of the shampoo, Brand name, brand image, Availability, its Utility , the Quantities in which it is available in, Frequency of usage, Co-products being purchased with it,
Income group of the customer purchasing it, the influential factors responsible for making purchase decision. The objectives of the study were
1)
To identify factors responsible for the purchase decision of the shampoo of the customers2)
To identify the impact of the factors on the purchase decision of the customers.3)
To study the factors influencing the preference of consumers towards shampoo.This study used the survey method in which a sample of 130 responses from the different customers was recorded. In the questionnaire the questions related to the factors mentioned above were included and also a separate questionnaire for the retailers was prepared and their responses were noted. This study used the percentage scale to measure the responses of the consumers from the questionnaire being designed for it and figure out the factors responsible for the consumer to make the purchase decision.
This study will help understand what are the chief factors responsible for making the purchase decision to the customers and to identify which are not important.This study will help to know the buying behavior of the customer regarding the shampoo so that it will be very useful for the manufacturer also to make the products in that manner so that there could be also an increase in the sales.
I.
Introduction
In the previous couple of years, Indian excellence has involved a noteworthy place in the form of world’s economy. Both men and women have begun offering significance to individual grooming and appearing context. In that capacity Indian cosmetic industry, particularly the hair care showcase has ascended to beneficial market. The market share of hair care fragment in India is consistently expanding step by step. The cleanser market is overwhelmed by HUL and P&G.
Shampoo is a hair care item, starting from the Indian subcontinent, ordinarily as a thick fluid, that is utilized for cleaning hair. Less regularly, cleanser is accessible in bar structure, similar to a bar of cleanser. Shampoo is utilized by applying it to wet hair, rubbing the item into the hair, and afterward flushing it out. A few clients may pursue a shampooing with the utilization of hair conditioner.
The average reason of utilizing cleanser is to evacuate the undesirable develop of sebum in the hair without
stripping out to such an extent as to make hair unmanageable. Cleanser is commonly made by joining a surfactant, regularly sodium laurel sulfate or sodium laureth sulfate, with a co- surfactant, frequently cocamidopropyl betaine in water. Claim to fame shampoos are accessible for individuals with dandruff, shading treated hairs, gluten or wheat sensitivities, an enthusiasm for utilizing a natural item, and babies and youthful youngsters ("infant cleanser" is less aggravating). Therearelike wiseshampoosplanned for creatures that may contain bug sprays or different drugs to treat skin conditions or parasite invasions, for example, insects.
Consumer Behavior
consumer and providing the kind of products that the consumer wants. We place enormous emphasis on our product development area and our marketing area, and on our people knowing the consumer.” The human mind is the most complex entity in the whole universe as it is very unpredictable how a person would behave in or react in a particular situation. A person’s behavior changes from place to place and situation to situation or, says it is very inconsistent. The person when has a need, is willing and able to satisfy the need is called a CONSUMER. The consumer would go different ways to satisfy its needs depending on his social, cultural, family, economic and educational background. Consumer is the principle a prior of business. The efficiency with which a free market system of enterprise operates, depends upon the extent of consumer understanding possessed by the business community. A business community
Significance and Rational of study
FMCG market in India in general and shampoo market in particular is highly competitive and cluttered. Shampoo market is fragmented with brands and variants catering to needs of customers. It is increasingly difficult to cater to customer need with just one variant or a brand. This study will aim at identifying major factors determining consumer behavior while purchasing a shampoo brand.
India is a developing country with lots of industries setting up in India because of which the pollution of the environment increases rapidly. Mostly the air pollution has a very bad impact on the hairs of people so there is a need of the different variants of shampoo in to the market according to the need and problems of hairs in the society.
Due to this study the manufacturer of the shampoo will be benefited as there will be clear definition which shows which variant and which features
Of shampoo is in demand in the market which will ultimately increases there profitability.
Type of research
This study used the exploratory research. The Exploratory research include gathering the information then organizing it, tabulate it and represent it in the form of graphical representation giving the clear picture about the factors impacting the purchase decision of the shampoo.
Objectives
To identify factors responsible for the purchase decision of the shampoo of the customers
To identify the impact of the factors on the purchase decision of the customers.
To study the factors influencing the preference of consumers towards shampoo.Research design including sample design Questionnaire was used as a tool for conducting the survey among the 130 respondent who uses the shampoo. The options in the questionnaire were based on the data collected from content analysis to study the responses of the respondent towards them. Therefore the graphical representation has also been derived from the responses of the consumer in the questionnaire.
For this study the sample size was 200 but the correct and actual responses were 130 from customers, so a sample size of 130 so was chosen.
Data collection
The methods of data collections are of two types' viz., primary data and secondary data. The primary data are those, which are collected afresh and for the first time, and thus happen to be original in nature. The secondary data, on the other hand, are those which have already been collected by someone else and which have been passed through the statistical process. In this study, primary data are used. The
primary data are collected through questionnaire, from the retail shopper and also from the 130 customers etc. The secondary data was collected from Google and Google scholar.that is ignorant of consumer preferences cannot possibly fulfill its obligations in a meaningful and responsive manner
Methodology of Analysis
This study used the percentage scale to measure the responses of the consumers from the questionnaire being designed from it and figure out the factors responsible for the consumer to make the purchase decision.
Limitations of the study
applicable to whole country.
There may be a chance of receiving biased information from the consumer while getting the data through questionnaire method.
Medicated shampoos and Baby shampoos are not taken into account in the study
Analysis of data collected from consumers
Table 1 Distribution of the respondent by Gender bracket
Gender Frequency Percentage
Male 44 34
Female 86 66
Total 130 100
From table 1 it is seen that from the total sample collected 66% are female and remaining 34% respondent are males.
Table 2 Distribution of the respondent by Age bracket
Age Frequency Percentage
18 or Below 18
14 11
Between 19 to 25
67 52
Between 26 to 35
24 18
Between 36 to 45
17 13
Above 46 8 6
Total 130 100
From table 2 it is seen that majority which is 52% respondent are between the age brackets of 19 to 25 years, then 18% are between 26 to 35 years of age, 11% are of
age 18 and below 18 years of age, 13% are between 36 to 45 years and 6% above 46 years of age
Table 3 Distribution rerespondentOccupation
Occupation Frequency Percentage
Service 26 20
Student 74 57
Businessman 6 5
Housewife 24 18
Total 130 100
From and table 3 it is seen that majority of the respondent are students which are 57% , 20% are at service, Housewife’s are 18% and Businessman’s are 5%.
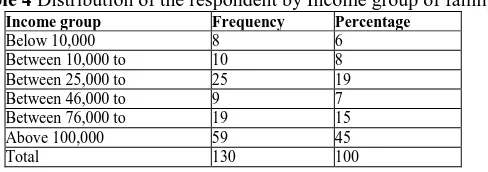
Table 4 Distribution of the respondent by Income group of family
Income group Frequency Percentage
Below 10,000 8 6
Between 10,000 to 10 8
Between 25,000 to 25 19
Between 46,000 to 9 7
Between 76,000 to 19 15
Above 100,000 59 45
Total 130 100
From table 4 it is see that 45% of respondent fall under the income bracket of above Rs 100,000, 19% fall under the income bracket between Rs 25,000 to
Table 5 Distribution of the respondent by Preference of Buying
Preference of
buying
Frequency Percentage
Nearby grocery shop
44 34
Nearby super market
24 18
Big super market
21 16
Random shop 41 32
From table 5 it is seen that 32% customer prefer to buy shampoo from any random shop , 34% by nearby grocery shop , 16% by big super market, and remaining 18% by nearby super market.
Table 6 Distribution of the respondent by Number of family member
No of
family members
Frequency Percentage
3 or below 3 35 27
Between 4 to5 85 65
Between 9 to 15 7 5
Above 15 3 2
Total 130 100
From table 6 it is seen that majority of the customers which is 65% has a family size of 4 to 5 members, 27% has
family size of 3 or below 3, 5% has between 9 to 15 and remaining 2% above 15.
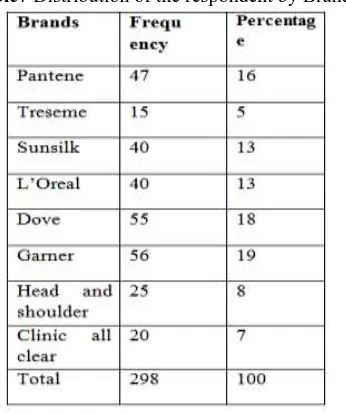
Table7 Distribution of the respondent by Brands
Table 4.4.8 Distribution of the respondent by Influence
From table 8 it is seen that majority that is 24%customers influence to purchase because of the brand ,17% by advertisement, 19 % customers influence to make the purchase decision because of quality, 23% by price, 5%by variant and fragrance, and remaining 11% by word of mouth.
Table 9 Distribution of the respondent Price
Price Frequency Percentage
Between Rs 1 to 5
43 33
Between Rs
10 to 40
29 22
Between Rs
40 to 100
24 18
Between Rs
100 to 200
11 8
Between Rs
200 to 300
8 6
Above 300 15 11
Total 130 100
From table 9 it is seen 33% prefer to buy the shampoo costing Rs 1 to 5, 18% prefers to purchase costing between Rs 40 to 100 and 8% prefers Rs 100 to 200, 22% between Rs 10 to 40, 6% prefers between Rs 200 to 300, and remaining 11% above Rs 300.
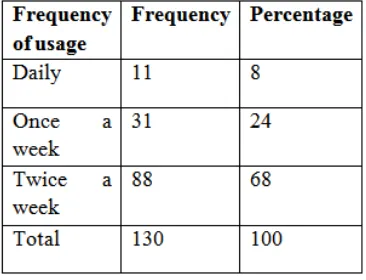
Table 10 Distribution of the respondent by frequency of usage
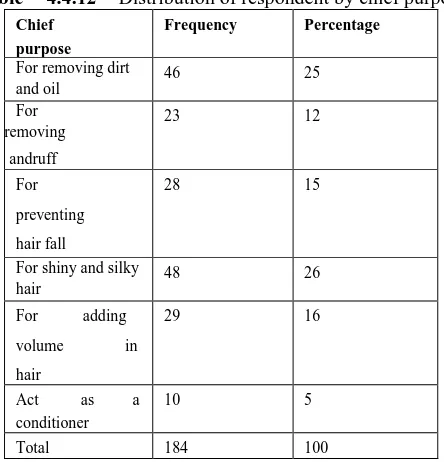
Table 4.4.12 Distribution of respondent by chief purpose Chief
purpose
Frequency Percentage
For removing dirt
and oil 46 25
For removing
andruff
23 12
For
preventing
hair fall
28 15
For shiny and silky hair
48 26
For adding
volume in
hair
29 16
Act as a
conditioner
10 5
Total 184 100
From table 10 it is seen that 68% respondent prefers to use the shampoo twicea week, 24% prefers to use once a week, and remaining 8% prefers to use daily.
Table 11 Distribution of the respondent by Quantities
Quantities Frequency Percentage
200 ml bottle 17 13
100 ml bottle 41 32
50 ml bottle 25 19
Sachet 47 36
Total 130 100
From table 12 it is seen that 26 %customers uses shampoo for shiny and silky hairs, 15% for preventing hair fall, 12% for removing dandruff and 16 % for adding volume to the hairs , and 25% for removing dirt and oil and 5 % for conditioning.
Table 13 Distribution of respondent by Co products used
Co products Frequency Percentage
Conditioners 78 51
Oil 55 36
Serum 20 13
Total 153 100
To 5 to 6 5 12
All leading brands we put to our store
18 43
Total 42 100
Analysis of data collected from retailers
Table 14 Distribution of respondent for Co products
Co products Frequency Percentage
Oil 20 36
Conditioners 20 36
Serum 16 29
Total 56 100
From table 14 it is seen from the responses of the retailers that most take away co product by the retailers are oil and conditioners which is 36 %and serum by 29 %..
Table 15 Distribution of respondent by Number of distributors
No of distributors Frequency Percentage
Group of distributors
12 29
Mostly 10 7 17
From table 15 it is seen from the responses from the retailers that number of distributors they are associated with are 43 % for all leading brands, 29% to group of distributors,17 %to mostly 10 distributors, and 12 %are to 5 to 6 distributors.
Table 16 Distribution of respondent for Monetary and Non monetary benefits Monetary and
Non monetary benefits
Frequency Percenta ge
Free scheme 20 29
Gift vouchers 18 26
Rewards points 17 25
Incentives 13 19
Total 68 100
From table 16 it is seen that 29 %retailers are been given free scheme as the benefit, 26% by gift vouchers, 25 % by reward points and 19% by incentives as monetary and non monetary benefits
Table 17 Distribution of respondent for Credit facility
Credit facility Frequency Percentage
70 to 100 day limit 18 34
50 day limit 16 30
30 day limit 19 36
Total 53 100
From table 17 it is seen that the credit limit maximum is given is 30 days to 36 % retailers ,34 % are been given 70 to 100 days limit and rest 30 %to 50 days.
Table 18 of Distribution of respondent for Shampoo packs available
Shampoo packs Frequency Percentage
Sachets 20 22
Sachets and conditioners
20 22
100 ml bottle 15 17
200 ml bottle 18 20
50 ml bottle 18 20
Total 91 100
Table 19 Distribution of respondent for Shampoo packs take away Shampoo packs Frequency Percentage
Sachets 20 28
Sachets and conditioners
15 21
100 ml bottle
10 14
200 ml bottle 11 15
50 ml bottle 15 21
Total 71 100
From table 19 it is seen that the most take away packs are sachet by response of 28% retailers, 21% of sachet and conditioners and of 50 ml bottle, 15% of 200 ml bottle and 14 %of 100 ml bottle.
Table 20 Distribution of respondent by Brands available
Brands Frequency Percentage
L’Oreal 20 14
Pantene 20 14
Head and shoulder
18 12
Garner 19 13
Sunsilk 15 10
Treseme 17
clinic all clear
16
Dove 20 14
Total 145 100
From table 20 it is seen that the brands of shampoo mostly put by the retailers on their stores are L’Oreal , Dove and Pantene by 14 %retailers, Garner by 13% , Head and shoulder by 12 %, Treseme by 12 % , Clinic all clear by 11% and Sunsilk by 10%.
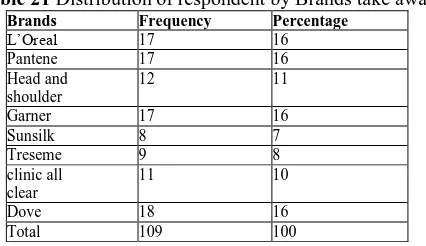
Table 21 Distribution of respondent by Brands take away
Brands Frequency Percentage
L’Oreal 17 16
Pantene 17 16
Head and shoulder
12 11
Garner 17 16
Sunsilk 8 7
Treseme 9 8
clinic all clear
11 10
Dove 18 16
Total 109 100
From table 21 it is seen that the brands of shampoo mostly take away by the retailers customers according to retailers from their stare L’Oreal , Dove and Pantene by 16 % retailers, Garner by 16 % , , Treseme by 8 %, Clinic all clear by 10 % and Sunsilk by 7
Table 22 Distribution of respondent for Reasons for keeping Reasons for
keeping
Frequency Percentage
Demand 20 28
sale out fast 17 24
Availability in quantity
16 23
good profit margins and benefit
18 25
From table 22 it is seen that the retailers kept the shampoo for reasons mostly because of demand of that shampoo by 28 % retailers, good profit margin and benefits by 25 % retailers, sale out fast by 25% retailers, availability in different quantities by 23 %retailers.
Table 23 Distribution of respondent for Shampoo not kept on store
Not kept on store Frequency Percentage
Vatika 13 13
Chick 15 15
Dabur Almond 14 14
Biotic 8 8
Patanjali 9 9
Opal 20 20
Zever 20 20
Total 100 100
From table 23 it is seen that vatika shampoo are not kept in store by 13 retailers, chick by 15 retailers, dabur amla by 14, biotic by 8, patanjali by 9, opal and zevar by 20.
Table 24 Distribution of respondent for Reasons for not keeping shampoo on store Reasons for not
keeping
Frequency Percentage
F
Not in demand 19 38
r Lesser o known to m customer
16 32
Not tadequate
apromotional strategy
15 30
b
Total 50 100
it is seen that the reasons why retailers do not put the shampoo in their stores are not in demand by 19 retailers, lesser known to customers by 16 retailers, not adequate promotional strategy by 15 retailers
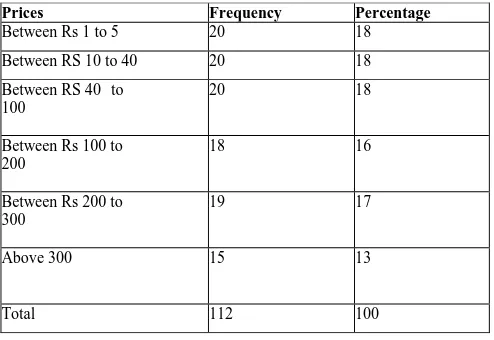
Table 25 Distribution of respondent for Prices
From table 25 it is seen that the according to the retailers the most take away shampoo range in prices as Rs 1 to 5, Rs 10 to 40, Rs 40 to 100 by 20 retailers, between Rs 100
to 200 by 18 retailers, between Rs 200 to 300 by 19 retailers, and above 300 by 15 retailers.
Prices Frequency Percentage
Between Rs 1 to 5 20 18
Between RS 10 to 40 20 18
Between RS 40 to 100
20 18
Between Rs 100 to 200
18 16
Between Rs 200 to 300
19 17
Above 300 15 13
II.
Conclusion
This study found that Pantene is preferred by 16% of the respondents, Sunsilk and Loral by 13%, Dove by 18% and Garner by 19%, Treseme 5%, Head and Shoulder by 8%, and Clinic all Clear by 7%, so all the brands are being chosen and preferred to buy by the customers, so therefore it is clearly seen that there is no only one preferred brand among the customers.
This study also found that there is an impact of Age, Brand, Income, Quantities, and Price on the purchase decision of the shampoo. This is true as the most of the purchaser is between the age group of 19 to 25 which is the group of young customers who take care of their hygiene level mostly and also for the part of their appearance.
Among the factors influencing the purchase decision Brand and Price got the highest value that is 24% and 25% which is highest among all so it can be said as these are the factors which has the highest influence on customers purchase decision.
Higher the income higher will be the spending capacity of the customers so the income group also influences the customer to take the purchase decision, the highest which is 45% among all the other group is given to monthly income of Rs 100,000 which is the highest among all.
The most purchased pack of the shampoo is the small Sachet which is preferred by 36% so the quantity in which it is available is also important as number of different brands are preferred so it is not feasible to buy in to a large amount by many of the customers.
This study also found that there is no impact of Number of family members, Word of mouth, Variance and fragrance, Frequency of usage, Preference of buying, co products use on the purchase decision of the customer, as all these factors are Statistically insignificant factors which does not count much on the purchase decision and not these factors are as important and influential as other factors are.
Number of family members, now let there be any size of the family the requirement of the shampoo is there in the small, medium, or large size family, Now Word of mouth, Variance and fragrance are been given the list value or importance or ranked which is 11% and 5% which is comparatively very small among the rest of the mentioned factors.
According to the situations arise the customer will make his buying decision as it will vary all the time he makes the purchase his preference and the actual buying shop can change.Frequency of usage is also an preferred case but it could vary in the day to day life of the customers and also according to his wish.
From the study it was found that not all factors mentioned in detailed above actually have any impact on the purchase decision of the customer. All factors are not equally important and as impactful as others are.
In the survey it was found that the female respondent was comparatively higher than the male respondents.
From all the brands taken into the consideration the mostly preferred brands by the customers are Dove, Pantene, Sunsilk, Garnear and L’Oreal. And also according to the retailers these are the most take away brands by the customers.
Among the factors like Advertisement, Word of mouth, Quality, Brand, Price, Variants and fragrance which are the influencing factors to make the purchase decision the most important factors are Price, Quality and Brand.
From the study it is found that majority of the customer do purchase the shampoo from the nearby grocery shop. In the study according to the responses of the customers and the retailers it was found that mostly the customers prefers to buy the shampoo between Rs 1 to 5, Rs 10 to 40 and Rs 40 to 100 as other costs are slightly at a high level so customers do not prefers it.
According to the responses of the customers and the retailers the most buyed and take away Quantities are Sachets.
From the study it is found that majority of the customer prefer to wash twice a week there hairs among the options given.
Mostly the customers buy the shampoo for the cleaning purpose for removing dirt and oil from the hair and for the shiny and silky hairs.
According to the responses of the customers and the retailers the co products mostly used and takeaway are Oil and Conditioners.
Most of the retailers are associated with the group of the distributors and a distributor of all the leading brands the put on their store.
References
[1]. www.google.com[2]. www.google scholar. Com [3]. www.marketingland.com
[4]. Consumer Behavior – Schiff man, Kanuk & Kumar [5]. Consumer Behaviour & Branding – Kumar
[6]. Why We Buy: The Science of Shopping – Paco Underhill, Simon & Schuster [7]. Consumer Behavior – Evans, Jamal and Foxall, Wiley India Pvt. Ltd [8]. P. Kotler, “Marketing Management”, - Prentice Hall Inc.