~ 112 ~ WWJMRD 2018; 4(7): 112-128
www.wwjmrd.com International Journal Peer Reviewed Journal Refereed Journal Indexed Journal
Impact Factor MJIF: 4.25 E-ISSN: 2454-6615
T.S Magili
Department of Pure and Applied Chemistry, Adamawa State University, Mubi, Nigeria
I.B Bwatanglang Department of Pure and Applied Chemistry, Adamawa State University, Mubi, Nigeria
Correspondence: T.S Magili
Department of Pure and Applied Chemistry, Adamawa State University, Mubi, Nigeria
Plant-Soil Interaction and Bioaccumulation of
Elements in Anti-diabetic Medicinal Plants Commonly
Used in Adamawa State, Nigeria
T.S Magili, I.B Bwatanglang
Abstract
The induction of root-based transport systems, the availability of soil microorganisms and the variation in plants morphology are all reported to influence the optimal nutrient uptake of variety of plant species. These differences in relation to the plant-soil interactions were hypothesis to have a direct effect in defining the pharmacological properties of individual plants species. Therefore, this present study is conducted to provide a comprehensive relationship between the concentration of elements in the soil and the bioconcentration in anti-diabetic medicinal plants grown on the same soil. Instrumental neutron activation analysis (INAA) were used to analyzed the concentration of 22 elements in 10 anti-diabetic medicinal plants commonly used in Adamawa state, Nigeria for the treatment and management of diabetes mellitus (DM). From the results of the study, the most effective medicinal plants with the highest BCF values was observed to be Ageratum conyzoides, accumulating about 50% of the elements investigated. Furthermore, the overall results shows Ca widely distributed in the all the species with the highest BCF (33.70) recorded in Terminalia avicennioides, expressed in percentage equivalent to be 3370%. Depicting that the magnitude of the accumulations in the roots is more than 3000 times compared to the value recorded in the surrounding soil samples. In addition to their anti-diabetic potential, some of the plants species with higher BCF values could be utilise in phytoremediation for the selective absorption of elements.
Keywords: Anti-diabetic, Medicinal plants, Trace element, Diabetes mellitus, INNA, Radioactive elements, bioconcentration factor
1. Introduction
Plant-soil chemistry is an effective and sustained pathway for nutrient/or mineral enrichment in plant. The enrichment of plants with functional nutrient/or mineral are reported to be fundamental in beefing up specific pharmacological properties in plants. The chemistry, variability and complexity of plant-soil interaction, conceptually defined by several environmental factors are responsible for the variability in nutrient uptake, tissue bioavailability and retention from specie to specie. Understanding this interactions will provides needed information on the selective accumulation of specific elements, which is further hypothesis will define the pharmacological properties of individual plants species. And thus, will further help to identify marching nutrient/or essential mineral with specific potentiating traits towards specific diseases such as DM. Therefore, when comparing medicinal plants in relation to soil-environmental associated factors; species are often found to have suites of related traits that maintain the flux of nutrients/ or essential minerals [1-3] In addition to some specific anti-diabetic phytochemicals in plants, the presence of some minerals and nutrients in the plant tissues are reported to actively participate in potentiating the pharmacological properties of insulin [4, 5]. Thus, understanding the role of these essential mineral components and their relative composition in plants will widen knowledge towards an effective plants tissue selection for the formulation of herbal remedy with the most potent sources of essential macro and micro nutrient.
Despite the fact that plants are non-motile, they utilize a plethora of sophisticated chemistry to retain the supply chain of mineral and nutrients from the soil [6]. While considering the
~ 113 ~
place of water in plants growth and survival, plants relative to its ecological importance required various essential mineral nutrients to complete their full life cycle. The availability of these essential minerals and nutrients depends largely on the soil-water interactions, uptake by the roots, and translocation dynamics within the root branching network to the stems of the plant, upstream [7,8]. Based on these interactions, soil in this context is serving as the natural reservoir for all the essential minerals and nutrients, [7]. Thus, providing the needed platform for nutrient and mineral uptake by plants in the form of dissolved ions [9],
In addition to dissolved nutrient ions, the net negative charges on the surface of soil particles also provided additional binding sites for nutrients ions, thus establishing a kind of equilibrium towards replenishing used up ions. Nutrient ions used up by plants are readily replenished by the stabilizing or buffering effect from the available soil surface bound nutrient ions [10, 11]
The physiological composition of plants determined its nutrient/mineral absorption rate from soil and the bioavailability in plant tissues is not often a reflection of its availability in the soil. Similarly, the availability of nutrient in the soil solution is not a determining factor to its transfer rate and bioaccumulation in plant tissues. Plants roots could displaced nutrients ions bound to soil particles and based on bulk flow or diffusion mechanism could intercept and absorbed the dislodged ions. As plants transpire water, water containing nutrient moves from bulk soil to the roots by mass or convective flow [12]. However, the concentration of nutrient in soil solution and the rate of transpiration may determine the quantity of nutrients absorbed by the root surface and translocation upstream. Therefore, factors such as plants species, climatic conditions, and soil moisture levels among others could interfere with the transport dynamics [12].
A better understanding of the relative contribution of soil nutrient-plant interaction with respect to the overall chemistry is necessary for a better and more complete understanding of plant-mineral homeostasis and for the development of an effective plants-based substrate with potent sources of anti-diabetic supporting minerals or nutrients. Therefore, this present study is conducted to provide a comprehensive relationship between the concentration of elements in the soil and the bioconcentration in the anti-diabetic medicinal plants grown on the same soil. Estimated as the ratio of elemental concentration in the plants tissues to that in the soil [13].
2. Materials and Methods
2.1. Sampling and Sample Preparations
Ethno-botanical characteristics of the selected plants often used traditionally in Nigeria as remedy for the treatment and management of DM informed the choice of the respective plants. The leaf, stem back and root bark samples of the selected medicinal plants collected from Mubi North, Mubi South and Maiha Local Government Areas of Adamawa State, Nigeria were used in the study. The plants used in the study are: Terminalia avicennioides, Hymenocardia acida, Leptadenia hastate, Balamites aegyptiacae, Ageratum conyzoide, Sclerocarya birrea, Anogeissus leiocarpus, Jatropha gossypiifolia, Daniellia oliveri, Sarcocephalus latifolius. Following the sampling,
the respective plants were fully authenticated by Mr. Jarafu U. Mamza, from the Department of Botany, Adamawa State University, Mubi, Nigeria and a voucher specimen samples deposited accordingly [4,5].
The soil samples were collected in the vicinity of each of the selected medicinal plants to investigate the correlation of the micro, macro, and non-essential and radioactive elements in the natural soils and plants samples. Sampling of soils was carried out at the same time with the medicinal plants samples. Soil samples were collected at the depth between 0 – 30 cm around each of the selected medicinal plants. Each soil sample comprised a composite of four (4) samples taken within 4 x 4 m square around each of the selected medicinal plants and mixed thoroughly to obtain a representative portion through conning and quartering method. The dried powdered samples of the plants tissues for each plants species and the disaggregated, dried and dust-free soil were respectively sieved using 2 mm mesh and homogenized prior to the elemental analysis using INAA. For the INAA analysis, about 250 mg to 300 mg of the respective plant samples and about 150 mg to 200 mg of soil samples were heat-sealed and processed following same methods adapted in our previous work [4, 5].
2.2. Elemental Analysis of the Anti-diabetic Medicinal Plants using INAA
The elemental analysis was conducted using the Nigerian Research Reactor-1 (NIRR-1) facility at the center for energy research and training ABU Zaria. For the analysis, reference material SRM NIST-1547 (Peach leaves), NIST- 1515 (Apple Leaves), IAEA Soil-7 and Coal Fly Ash SRM (1633STD) were used for quality control test and quantitative analyses. And the analytical values obtained were equally compared with the actual values in mg/kg according to the method described in our previous study [5]. The protocols for sample irradiation were performed in two irradiations stages. The first irradiation was designed to capture short half-life radionuclide while, the second irradiation was designed to capture the long half-life radionuclide [5]. Following the various irradiation regime, the retrieved irradiated samples were then collected for the identification of various radionuclide concentration using gamma ray spectrum analysis software, a software developed at CIAE, Beijing, China (IAEA, 1996), NIST- 1515 (Apple Leaves), NIST-1547 (Peach leaves), IAEA Soil-7 and Coal Fly Ash SRM (1633STD)
2.3. Statistical Analysis
The obtained results were presented as mean ± SD (standard deviation). All differences are considered significant at p<0.05 using Analyse-it (version 2.3). Significant elemental concentration differences in plants samples were determined by analysis of variance (ANOVA).
3. Results
~ 114 ~
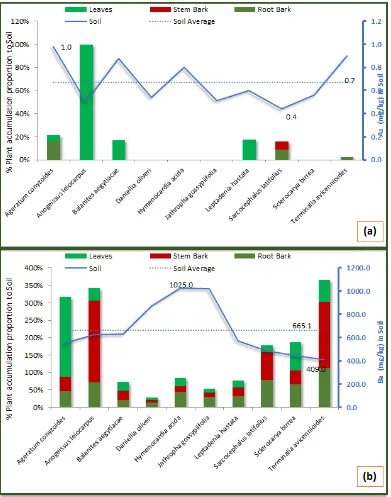
to fall between 1019±16.1 mg/kg and 6121±986 mg/kg, respectively. The result revealed that only about 30% of pair-wise comparison between variations in the 10 soil samples locations are statistically significant (P<0.05). In relation to soil concentration, individual plant tissue accumulation of Ca was highest in the stem bark sample of Anogeissus leiocarpus (4774%), and lowest in the stem bark sample of Sclerocarya birrea (393%). Though, the concentration of Ca was found to be higher in the soil samples collected within the vicinity of Sclerocarya birrea, the cumulative tissues accumulation was observed to be lower in the same plant species, while highest concentration was recorded in Terminalia avicennioides, with soil Ca concentration below average within its vicinity.
Further analysis as presented in Fig. 1b, shows the average concentration of Magnesium (Mg) (1072.4±521.7 mg/kg)
in the soil samples falling between 518.0±54.7 mg/kg and 1956.0±438.0 mg/kg, within the vicinity of Ageratum conyzoides and Leptadenia hastata respectively. The result further revealed that only about 20% of pair-wise comparison between variations in the 10 soil samples locations are statistically significant (P<0.05). In relation to soil concentration, individual plant tissue accumulation of Mg was highest in the leaves sample of Ageratum conyzoides (1043%), and lowest in the stem bark sample of Hymenocardia acida (93%). The cumulative tissues accumulation was observed to be lower in Hymenocardia acida, despite the fact that the concentration in soil was above average within its vicinity. The highest concentration was however, observed in Ageratum conyzoides, which had the lowest concentration of Mg in the soil sample collected within it vicinity.
Fig. 1: Shows the Concentrations of (a) Calcium, and (b) Magnesium in soil and percentage accumulation in tissue samples of anti-diabetes medicinal plants. The results are presented as Mean±SD of three replicate analysis
The average Sodium (Na) (3619.8±2473.1 mg/kg) concentration in the soil samples was obtained between
~ 115 ~
latifolius respectively. As described in Fig. 2a, the pair-wise comparison between variations in the 10 soil samples locations were observed to be statistically significant (P<0.05). In relation to the soil concentration, the individual plant tissue accumulation of Na was observed to be higher in the root bark sample of Ageratum conyzoides (39%), and lowest in the leaves sample of Hymenocardia acida (0.8%). The cumulative tissues accumulation was lowest in Hymenocardia acida, despite the fact that, the concentration in the soil samples collected within its vicinity was observed to be above the average value. Furthermore, within the vicinity of Ageratum conyzoides, Na concentration in the soil sample was below the average, but was highest in cumulative tissues accumulation. The average Potassium (K) (39026.0±13404.3 mg/kg) concentration in the soil samples collected within the
vicinity of Jathropha gossypiifolia and Sarcocephalus latifolius as shown in Fig. 2b falls between 56970.0±740.0 mg/kg and 16780.0±101.0 mg/kg respectively. The result showed that more than 90% of pair-wise comparison between variations in the 10 soil samples locations are a statistically significant (P<0.05). Individual plant tissue accumulation of K, in relation to the soil concentration was highest in the stem bark sample of Ageratum conyzoides (166%), and lowest in the leaves sample of Terminalia avicennioides (3%). The cumulative tissues accumulation was lowest in Terminalia avicennioides, despite the fact that the concentration of K in the soil sample within its vicinity was below the average. In the vicinity of Ageratum conyzoides, K concentration in the soil sample was below the average, but was highest in cumulative tissues accumulation.
~ 116 ~
Figure 3a, shows that the average Iron (Fe) (10161.4±1996.6 mg/kg) concentration in the soil samples falling between 12560.0±237.0 mg/kg and 6427.0±193.0 mg/kg, collected within the vicinity of Ageratum conyzoides and Leptadenia hastata respectively. The result revealed that about 70% of pair-wise comparison between variations in the 10 soil samples locations were statistically significant (P<0.05). In relation to the soil concentration, the individual plant tissue accumulation of Fe was highest in the root bark sample of Ageratum conyzoides (34%), and lowest in the leaves sample of Daniellia oliveri (1.2%). Although, the concentration of Fe in the soil was above average within the vicinity of Hymenocardia acida, the cumulative tissues accumulation was observed to be lowest, while a higher concentration was recorded in Ageratum conyzoides, despite having the same above average concentration of Fewithin it vicinity.
The average concentration of Cobolt (Co) (3.4±1.4 mg/kg) in the soil samples as described in Fig. 3b was obtained between 6.02±0.35 mg/kg and 1.40±0.30 mg/kg, within the vicinity of Leptadenia hastata and Anogeissus leiocarpus respectively. The result revealed that about 50% of pair-wise comparison between variations in the 10 soil samples locations are a statistically significant (P<0.05). In relation to the soil concentration, the individual plant tissue accumulation of Co was highest in the root bark sample of Sarcocephalus latifolius (1645%), and lowest in the leaves sample of Leptadenia hastata (1.3%). Similarly, the cumulative tissues accumulation was lowest in Leptadenia hastata, even though Co concentration in the soil was highest within its vicinity, while cumulative Co was highest in Sarcocephalus latifolius which had soil Co concentration in its vicinity below average.
~ 117 ~
The average Manganese (Mn) (246.5±59.6 mg/kg) concentration in the soil samples was obtained between 349.0±2.0 mg/kg and 138.0±1.0 mg/kg within the vicinity of Sclerocarya birrea and Sarcocephalus latifolius respectively. As shown in Fig 4a, more than 90% of pair-wise comparison between variations in the 10 soil samples locations were statistically significant (P<0.05). The plant tissues accumulation of Mn, in relation to the soil concentration was highest in the leaves sample of Hymenocardia acida (774%), and lowest in the stem bark sample of Sclerocarya birrea (7%). Although, Mn concentration in the soil sample collected within vicinity Sclerocarya birrea was higher, the cumulative tissues accumulation was observed to be lower in the same plant. While, in the vicinity of Hymenocardia acida, the concentration of Mn in the soil sample was slightly (3%) above the average, but was highest in cumulative tissues accumulation.
Further analysis shows no presence of Zinc (Zn) detected in
the soil samples collected within the vicinities of Anogeissus leiocarpus, Leptadenia hastate and Terminalia avicennioides. As presented in Fig. 4b, the average concentration of Zn (32.6±31.7 mg/kg) in soil samples was recorded between the vicinities Sclerocarya birrea (90.0±7.0 mg/kg) and Ageratum conyzoides (22.5±5.2 mg/kg) respectively. The result showed that about 80% of pair-wise comparison between variations in the 10 soil samples locations were statistically significant (P<0.05). In relation to the soil concentration, the concentration of Zn was highest in the leaves sample of Ageratum conyzoides (276%), and lowest in the leaves sample of Sclerocarya birrea (9%). Although, the concentration of Zn was highest in the soil collected within the vicinity Sclerocarya birrea, the cumulative tissues accumulation was observed to be lower in same plant. While, in the vicinity of Ageratum conyzoides, Zn concentration in the soil sample was observed to be the lowest, but recorded the highest cumulative tissues accumulation.
~ 118 ~
The average concentration of Chromium (Cr) (27.1±8.6 mg/kg) in the soil samples was recorded between the vicinities of Hymenocardia acida (42.0±3.0 mg/kg) and Jathropha gossypiifolia (14.0±2.0 mg/kg) respectively. As contained in Fig. 5a, about 60% of the pair-wise comparison between variations in the 10 soil samples locations were statistically significant (P<0.05). In relation to the soil concentration, the highest concentration of Cr was recorded in the root bark sample of Jathropha gossypiifolia (271%), and the lowest value recorded in the stem bark sample of Sarcocephalus latifolius (1%). The cumulative tissues accumulation was lowest in Daniellia oliveri, although Cr concentration in the soil sample collected within its vicinity was above the average. While in the vicinity of Jathropha gossypiifolia, Cr concentration in soil sample was lowest, but the same plant was observed to contain the highest cumulative tissues accumulation. Figure 5b, shows that the average Aluminium (Al)
(52167.0±18068.1 mg/kg) concentration in the soil samples was obtained between 89130.0±1604.0 mg/kg and 29950.0±419.0 mg/kg, within the vicinity of Balanites aegytiacae and Terminalia avicennioides respectively. From the result, more than 90% of pair-wise comparison between variations in the 10 soil samples locations are a statistically significant (P<0.05). In relation to the soil concentration, the respective plant tissues accumulation of Al was highest in the root bark sample of Ageratum conyzoides (33%), and lowest in the leaves sample of Balanites aegytiacae (0.4%). The cumulative tissues accumulation was lowest in Hymenocardia acida, even though the Al concentration in soil sample was observed to be above the average. Similarly, the cumulative concentration of Al observed to be higher in Ageratum conyzoides even though the concentration recorded in the soil sample collected within its vicinity falls below the average value.
~ 119 ~
The average Arsenic (Ac) (0.7±0.2 mg/kg) concentration in soil samples was recorded between the vicinities Sarcocephalus latifolius (0.44±0.07 mg/kg) and Ageratum conyzoides (0.98±0.08 mg/kg). The result in Fig. 6a, showed that only about 20% of pair-wise comparison between variations in the 10 soil samples locations were statistically significant (P<0.05). The plant tissues accumulation of As, in relation to the soil concentration was observed to be higher in the leaves sample of Anogeissus leiocarpus (100%), and lowest in the root bark sample of Terminalia avicennioides (2%). The cumulative tissues accumulation according to results was lowest in Terminalia avicennioides, even though the concentration was observed to be above the average in soil sample collected within its vicinity. Furthermore, in the soil sample collected within the vicinity of Anogeissus leiocarpus, the concentration of As was observed to be below the average value, but the cumulative tissues accumulation was
observed to be higher.
Figure 5b, shows that the average (665.1±227.8 mg/kg) concentration of Barium (Ba) in soil samples was obtained within the vicinity of Hymenocardia acidaand Terminalia avicennioides with a concentration between 1025.0±36.0 mg/kg and 409.0±26.0 mg/kg, respectively. The result further revealed that, about 70% of pair-wise comparison between variations in the 10 soil sample locations are statistically significant (P<0.05). With respect to the soil concentration, the individual plant tissues accumulation of Ba was highest in the stem bark sample of Anogeissus leiocarpus (234%), and lowest in the leaves sample of Daniellia oliveri (7%). The cumulative tissues accumulation was lowest in Daniellia oliveri, even though Ba concentration in soil was above the average within its vicinity; while cumulative Ba was highest in Terminalia avicennioides which had the lowest concentration of Ba in the soil within its vicinity.
~ 120 ~
Figure 7a, shows that the average concentration of Rubidium (Rb) (353.4±54.0 mg/kg) in the soil samples was obtained between 1294.0±54.0 mg/kg and 184.0±6.0 mg/kg, within the vicinity of Terminalia avicennioides and Sarcocephalus latifolius respectively. From the result, about 60% of the pair-wise comparison between variations in the 10 soil samples locations are statistically significant (P<0.05).With respect to the soil concentration, the individual plant tissues accumulation of Rb was highest in the root bark sample of Ageratum conyzoides (43%), and lowest in the root bark sample of Terminalia avicennioides (3%). Similarly, the cumulative tissues accumulation was lowest in Terminalia avicennioides, even though Rb concentration in the soil sample was above the average within its vicinity, while cumulative Rb was highest in Ageratum conyzoides which had concentration of Rb in the soil within its vicinity below the average.
The average concentration of Scandium (Sc) (3.4±0.9
mg/kg) in the soil samples was recorded between the vicinities of Sarcocephalus latifolius (5.12±0.05 mg/kg) and Sclerocarya birrea (2.38±0.04 mg/kg). As described in Fig 7b, only about 20% of pair-wise comparison between variations in the 10 soil samples locations were statistically significant (P<0.05). The plant tissues accumulation in relation to soil concentration was observed to be highest in the leaves sample of Sarcocephalus latifolius (8926%), and lowest in the leaves sample of Daniellia oliveri (2%). Further, the cumulative tissues accumulation was observed to be lowest in Daniellia oliveri, even though the concentration was observed to be above average in soil sample collected within its vicinity. In the soil sample collected within the vicinity of Sarcocephalus latifolius, the concentration of Sc was observed to be highest with a similar highest concentration recorded in the cumulative tissues accumulation.
~ 121 ~
Vanadium (V) was not detected in soil samples within the vicinity of Balanites aegytiacae as well as in the respective plant tissues. The average concentration (24.2±11.0 mg/kg) in soil samples was recorded between the vicinities Hymenocardia acida (39.0±4.0 mg/kg) and Jathropha gossypiifolia (12.0±3.0 mg/kg). As presented in Fig. 8a, only about 60% of pair-wise comparison between variations in the 10 soil samples locations are statistically significant (P<0.05). In relation to the soil concentration, the highest value was recorded in the leaves sample of Sarcocephalus latifolius(114%), and lowest in the leaves sample of Anogeissus leiocarpus (3%). The cumulative tissues accumulation was lowest in Hymenocardia acida, although V concentration was highest in soil within its vicinity. In the vicinity of Sarcocephalus latifolius, V concentration in the soil was above the average, but was highest in cumulative tissues accumulation.
As presented in Fig. 8b, Europium (Eu) was not detected in soil samples within the vicinities of Daniellia oliveri and
Sclerocarya birrea, but was detected in the tissue samples of Sclerocarya birrea. The average concentration (0.8±0.5 mg/kg) in the soil samples was recorded between the vicinities Balanites aegytiacae (1.370±0.16 mg/kg) and Terminalia avicennioides (0.60±0.10 mg/kg). From the result, only about 20% of the pair-wise comparison between variations in the 10 soil samples locations were statistically significant (P<0.05). The plant tissues accumulation, in relation to the soil concentration was found to be highest in the leaves sample of Hymenocardia acida (449%), and lowest in the stem bark sample of Balanites aegytiacae (7%). Similarly, the cumulative tissues accumulation was lowest in Balanites aegytiacae, although Eu concentration was highest in the soil sample collected within its vicinity. In the vicinity of Hymenocardia acida, the concentration in the soil sample was observed to be above the average, and highest in the cumulative tissues accumulation
~ 122 ~
Figure 9a, shows that the average Lanthanum (La) (63.6±24.8 mg/kg) concentration in the soil samples was obtained between 107.90±0.20 mg/kg and 33.54±0.13 mg/kg, within the vicinity of Anogeissus leiocarpus and Ageratum conyzoides respectively. From the result, more than 90% of pair-wise comparison between variations in the 10 soil samples locations were observed to be statistically significant (P<0.05). With respect to the soil concentration, the individual plant tissues accumulation of La was highest in the leaves sample of Daniellia oliveri (2641%), and lowest in the stem bark sample of Anogeissus leiocarpus (2%).
Figure 9b, shows that the average Lutetium (Lu) (0.7±0.2 mg/kg) concentration in the soil samples was obtained between 0.960±0.03 mg/kg and 0.390±0.02 mg/kg, within the vicinity of Hymenocardia acida and Terminalia avicennioides respectively. The result revealed that about 60% of pair-wise comparison between variations in the 10 soil samples locations were statistically significant (P<0.05).With respect to the soil concentration, the individual plant tissues accumulation of Lu was highest in the leaves sample of Hymenocardia acida (286%) and the stem bark tissue sample of Jathropha gossypiifolia (2%) was observed to be the lowest in the accumulation of Lu.
~ 123 ~
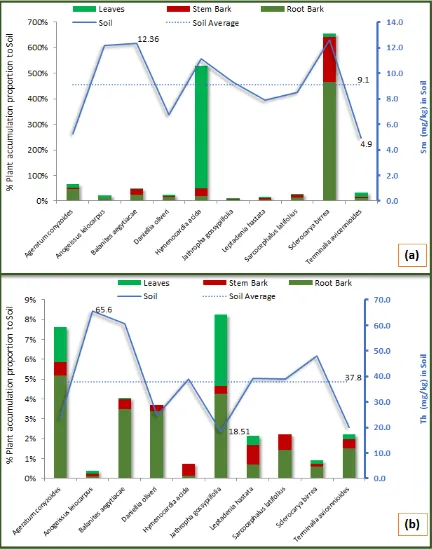
The results in Fig. 10a shows the average (9.1±2.9 mg/kg) concentration of Samarium (Sm) in the soil samples falling between 12.63±0.04 mg/kg and 4.91±0.03 mg/kg, within the vicinity of Sclerocarya birrea and Terminalia avicennioides respectively. From the result, more than 90% of pair-wise comparison between variations in the 10 soil samples locations were statistically significant (P<0.05).With respect to the soil concentration, the individual plant tissues accumulation of Sm was highest in the leaves sample of Hymenocardia acida (480%), and lowest in the stem bark sample of Anogeissus leiocarpus (2%). The cumulative tissues accumulation was lowest in Jathropha gossypiifolia, even though Sm concentration in
the soil was above the average within its vicinity.
Figure 10b, shows that the average concentration (37.8±16.6 mg/kg) of Thorium (Th) in the soil samples was obtained between 65.60±0.40 mg/kg and 18.51±0.24 mg/kg, within the vicinity of Anogeissus leiocarpus and Jathropha gossypiifolia respectively. From the result, about 80% of pair-wise comparison between variations in the 10 soil samples locations were observed to be statistically significant (P<0.05). With respect to the soil concentration, the individual plant tissues accumulation of Th was highest in the root bark sample of Ageratum conyzoides (5%), and lowest in the leaves of Terminalia avicennioides (0.1%).
~ 124 ~
Figure 11a, shows that the average (3.7±0.9 mg/kg) concentration of Uranium (U) in the soil samples was obtained between 5.40±0.30 mg/kg and 2.50±0.30 mg/kg, within the vicinity of Hymenocardia acida and Jathropha gossypiifolia respectively. From the result, about 50% of pair-wise comparison between variations in the 10 soil samples locations were observed to be statistically significant (P<0.05).With respect to the soil concentration, the individual plant tissues accumulation of U was highest in the stem bark sample of Balanites aegytiacae (10%) as well as in their respective cumulative plant tissues accumulation, despite the fact that the soil concentrations within its vicinity is only slightly (2%) higher than the average. Similarly, the cumulative tissues accumulation was observed to be lowest in the stem bark sample of
Terminalia avicennioides (0.1%).
The activity of Ytterbium (Yb) as presented in Fig. 11b, shows the average concentration of Yb (4.6±1.1 mg/kg) in the soil samples falling between 6.17±0.14 mg/kg and 2.60±0.10 mg/kg, within the vicinity of Hymenocardia acida and Terminalia avicennioides respectively. From the result, about 80% of pair-wise comparison between variations in the 10 soil samples locations were observed to be statistically significant (P<0.05). With respect to the soil concentration, the plant tissues accumulation of Yb was observed to be higher in the leaves sample of Hymenocardia acida (705%), while the lowest value was observed in the stem bark sample of Jathropha gossypiifolia
~ 125 ~
Figure 12 shows the summary of the most effective medicinal plants with highest BCF values. From the results, over 50% of the elements investigated are detected in
Ageratum conyzoides, observed to contained the highest BCF for more than half (12) of the elements investigated
E
lem
en
ts
Ca 33.70
Mg 5.81
Na 0.39
K 1.41
Fe 0.34
Co 16.45
Mn 1.25
Zn 1.51
Cr 2.71
Al 0.33
Ba 1.12
Sc 26.48
Rb 0.43
V 0.50
As 0.16
La 0.41
Sm 4.67
Yb 0.65
Eu 0.23
Lu 0.31
Th 0.05
U 0.01
A g era tu m co n yzo id es A n o g eiss u s leio ca rp u s B a la n ites a eg ytia ca e Da n iellia o liveri Hym en o ca rd ia a cid a Ja th ro p h a g o ss yp iifo lia Lep ta d en ia h a sta ta S a rco ce p h a lu s la tifo liu s S clero ca rya b ir rea Ter min a lia a vice n n io id es Plant species
Fig. 12: Bioconcentration factors (BCF) of elementals by most effective anti-debates Medicinal plants
Discussion
The uptake of elements into different tissues with varying absorption structures, the complexity that exist among plants species and the difference in their nutrient requirement and selectivity often left an open question towards understanding the basic chemistry underlining their pharmacological properties. Under normal growing
conditions, plants can potentially accumulate some metal ions in order of magnitude greater than the surrounding medium [14]. This is the general finding from the results in this study, for the 22 elements determined in the soil samples collected within the vicinities of the medicinal plants analyzed.
~ 126 ~
relationship in percentages for all the plant tissues, it is common practices however, when discussing the relationship between elemental contents in soil and the tissues of plants to mention the bioconcentration factor (BCF). The BCF is the ability of plants to accumulate metals from soils, estimated as the ratio of metal concentration in the roots to that in the soil [14, 15]. However, in this study, the BCF was widen to encompass the features of the relationship to root tissues, to the percentage accumulation in other tissues as well. Perhaps this will provide a holistic picture of the entire plant-soil interactions in relation to the uptake of the elements investigated. However, the result in study presented in percentages is similar to the value in ratio multiplied by 100%. Thus for the ease of a comprehensive assessment, Fig. 12 shows the most effective medicinal plants with high BCF values. Consequently, at a glance, Ageratum conyzoides was observed to have the highest BCF, accumulating about 50% of the elements investigated. Overall, Terminalia avicennioides has the highest for Ca, BCF = 33.70. This also expressed in percentage and as expressed on Fig. 1a, the BCF for Ca was equivalent to 3370%. In other words, it depicts the magnitude of accumulations in the roots to be 3000 times more than what is recorded in the surrounding soil sample. The variability of soil to plant transfer ratio is expected as this macroscopic parameter integrates a number of soil chemical, biological, hydrological, physical and plant physiological processes, each of which shows its own variability and in addition may be influenced by external factors such as climate, development, industrialization and human agricultural practices.
The influence of the non-uniform root densities and concentrations of trace substance on the root uptake mechanism can cause significant variation in the transfer factor. These are the likely factors influencing the potential BCFs of Ageratum conyzoides observed in this study. Ageratum conyzoides have been described as an easy to culture plant with high adaptability and high potential for reproduction. Thus agriculturist considers it as a weed because it readily over-shadows other plants with its growth and reduces their yield [16]. These characteristics are very likely to be connected its BCF potentials.
According to Ehlken and Kirchner [17] the concentration of trace elements accumulating in plants may not primarily depend on its absolute concentration in the soil-plant system but on the concentration ratio to other micro and macro nutrients. The higher transfer factor observed for Ca in the plant can be attributed to the redistribution of the element within the soil profile. For deep rooting plants the redistribution of the metals within the soil profile may even cause an increase of the transfer factors with time. Calcium metabolism is essential towards controlling plants growth and development. Its unique disposition is attributed to it being localized outside of the cell, stabilizing the cell walls by cross-linking acidic side groups on adjacent pectic polysaccharide molecules [18, 19]. Plant morphology is endowed with a wide range of cation channels such as voltage-sensitive channels, channels gated by cyclic nucleotides or glutamate, as well as mechanosensitive channels [20, 21]. These channels have been reported to allow entry of Ca [20]. The opening of the ion channels in the plasma membrane for Ca uptake is also reported to allow the permeation of some cations such as Zn, Mg, Cr, V, Mn [18, 19]. Therefore, the high BCF for Ca recorded in the
plants tissue may have paved way for the accumulation of the other elements investigated in this study. Some of these elements as reported in our previous work, are actively involved in potentiating insulin metabolism [4, 5, 22].
The higher BCF value for Ca in the medicinal plants investigated further reiterate its role in potentiation insulin related physiology. The metabolic activity in the pancreatic islet is driven in part by the systemic calcium-mediated cellular signaling action through local increases in the concentration of extracellular Ca2+, co-released with insulin [23]. Glucose-stimulated insulin secretion by sulfonylurea
compounds in type 2 diabetic patients were observed to be in part due to their capacity to raise mitochondrial calcium, essential for the generation of metabolic coupling factors [24]
. Therefore, failure of the body to induce calcium influx could leads to defect in the cellular glucose metabolic related actions [25]. In addition to the role of Ca in potentiating insulin action, the sensitivity of insulin toward Mg are often used as an indicator to monitor and predict the development of type II diabetes [26], observed to modulate the shift of Mg from the extracellular compartments to the intracellular space, thus regulating diabetes mediated mechanism [27]. Manganese deficiency can impair glucose utilization [28-30] and Zn was reported to play an active role in insulin's production in the B-cell [31-33]. Decline in physiological Zn concentration was observed to affects the ability of the islet cell to produce and secrete insulin and further suggested that diabetes may be related to increase in intracellular oxidants and free radicals associated with decreases in intracellular Zn and in Zn-dependent antioxidant enzymes [34, 35].
In a related development, Fe relative to being an essential component of hemoglobin [36], played a role in the management of DM by facilitating the oxidation of carbohydrates, protein and fat leading to control body weight, a very important factor in DM [37]. Furthermore, in contrast to the conventional long-acting insulin preparations, Co3+-insulin injected as a neutral, aqueous solution improves the solubility of Co3+-insulin by >600 µmol/l at physiological pH and ionic strength [38,39]. Other studies providing evidence of Co-insulin potentiation include Sathianathan et al., [40] and Lim et al., [41]. Reversal of functional abnormalities induced by DM were reported to actively cushion up by vanadium [42] and V in the forms of vandyl sulfate (100 mg/day) and sodium metavanadate (125 mg/kg) has been used as a supplement for diabetic patients [43]. Similarly, Studies have shown that Cr potentiate insulin and potentiates the action of insulin by restoring glucose tolerance [44-46]. While, Poor Cr status is a factor contributing to the incidence of impaired glucose tolerance and type II diabetes [47].
Although the focus of this study is on the medicinal characteristics of the plants studied but it is instructive to note that both bioconcentration factor (BCF) and translocation factor (TF) can be used to estimate a plant's medicinal potential in relation to specific soil-elemental concentration. Furthermore, similar study can be used for phytoremediation purposes in which heavy metal-tolerant species with high BCF and low TF can be used for phytostabilisation of contaminated sites [14]
Conclusion
~ 127 ~
elements in the plants. Thus, the availability of these essential elements in the soil in relation to its transport dynamic and bioaccumulation in plants tissues is essential in understanding the anti-diabetic properties of plants. These study on the nutrient value of the 10 medicinal plants using the BCF indicated that the anti-diabetic medicinal plants investigated in this study are excellent source of elements such as Ca, Zn, Mg, Cr, V, Mn. From the results of the study, Ageratum conyzoides was observed to have the highest BCF. While Terminalia avicennioides was observed to contain thehighest BCF value for Ca (3370%). The result further shows that the magnitude of the accumulations in the roots is 3000 times more than in the surrounding soil samples. The influence of the non-uniform root densities and concentrations of trace substance on root uptake can cause significant variation in transfer factor. These are the likely factors influencing the potential BCFs of Ageratum conyzoides observed in this study. Ageratum conyzoides have been described as an easy to culture plant with high adaptability and high potential for reproduction. These characteristics are very likely to be connected with the BCF potentials recoded for Ageratum conyzoides. Therefore, the outcome of the study will provide additional information to the immediate community on which species of anti-diabetic medicinal plants with high BCF that could be grown and cultivated easily to meets their local demands for medicinal herbs. In addition to their anti-diabetic potential, some of the plants species with higher BCF values could be utilise in phytoremediation for the selective absorption of elements.
Reference
1. Chapin FS. III. Functional role of growth forms in ecosystem and global processes. Pages 287–312 in J. R. Ehleringer and C. B. Field, editors. Scaling physiological processes: leaf to globe. Academic Press, San Diego, California. 1993
2. Lavorel S and Garnier E. Predicting changes in community composition and ecosystem functioning from plant traits: revisiting the Holy Grail. Functional Ecology, 2002;16:545–556
3. Eviner VT and Hawkes CV. Embracing Variability in the Application of Plant–Soil Interactions to the Restoration of Communities and Ecosystems. Restoration Ecology, 2008; 16(4):713–729
4. Magili ST, Maina HM, Barminas JT, Maitera ON, Onen AI. Study of some trace and macro elements in selected antidiabetic medicinal plants used in Adamawa State, Nigeria by neutron activation analysis (NAA). Peak Journal of Medical plant research, 2014; 2(2): 13-22
5. Magili TS and Bwatanglang IB. Determination of Macro and Micro Elements in Some
Selected Anti-diabetic Medicinal Plants in Adamawa State, Nigeria Using Instrumental Neutron Analysis. WWJMRD, 2018a; 4(6): 181-190
6. Morgan JB and Connolly EL. Plant-Soil Inter actions: Nutrient Uptake. Nature Education Knowledge, 2013;4(8):2 7. Allaby M. A Dictionary of Plant Sciences. Oxford
University Press, 1998
8. Garba H, Shinggu DY, Bwatanglang IB and Magili TS. The Role of 2, 2-Dichlorovinyl Dimethyl Phosphate and the Dynamics of Heavy Metals Absorption/Translocation in Plants: Emphasis on
Sorrel and Spinach. Int. J. Curr. Res. Biosci. Plant Biol, 2018; 5(6):1-10
9. Barber SA. Soil Nutrient Bioavailability. A Mechanistic Approach. A Wiley-Interscience Publication, New York, 1984
10. Nye PH and Tinker PB. Solute Movement in the Soil-Root System. Blackwell Scientific Publications, 1977 11. Tinker PB and Nye PH. Solute Movement in the
Rhizosphere. Oxford University Press, 2000
12. Adler PR, Cumming JR, Arora R. Nature of Mineral Nutrient Uptake by Plants. Agricultural Sciences, 2009; 1: 355-371.
13. Seeprasert P, Anurakpongsatorn P, Laoharojanaphand S, Busamongko A. Instrumental neutron activation analysis to determine inorganic elements in paddy soil and rice and evaluate bioconcentration factors in rice. Agriculture and Natural Resources, 2017;51:154-157 14. Yoon J, Cao X, Zhou Q, Ma LQ. Accumulation of
Pb,Cu, and Zn in native plants growing on a contaminated Florida site. Sci Total Environ, 2007; 368(2-3): 456-464.
15. Gupta AK, Sinha S. Growth and metal accumulation response of Vigna radiata L. var PDM 54 (Mung bean) grown on fly ash amended soil: Effect on dietary intake. Environmental Geochemistry and Health, 2007; 31(4): 463-73.
16. Singh RP, Tripathi RD, Sinha SK, Maheshwari R, Srivastava HS. Response of higher plants to lead contaminated environment. Chemosphere, 1997; 34:2467-2493.
17. Ehlken S, Kirchner G. Environmental processes affecting plant root uptake of radioactive trace elements and variability of transfer factor data: a review.Journal of Environmental Radioactivity, 2002; 58:97-112
18. Sanders D, Brownlee C, and Harper JF. Communicating with calcium. Plant Cell, 1999;11:691–706
19. Reid R and Hayes J. Mechanisms and Control of Nutrient Uptake in Plants. International Review of Cytology, 2003;Vol 229, Elsevier Inc
20. Demidchik V, Davenport RJ, and Tester M. Nonselective cation channels in plants. Annu. Rev. Plant Biol, 2002; 53:67–107
21. Sentenac H, Bonneaud N, Lacroute F, Salmon J, Gaymard F, and Grignon C. Cloning and expression in yeast of a plant potassium ion transport system. Science, 1992; 256:663–665.
22. Magili TS and Bwatanglang IB. Determination of Natural Radioactive and Trace
elements in Some Selected Anti-diabetic Medicinal Plants in Adamawa State, Nigeria Using Instrumental Neutron Analysis. WWJMRD 2018b; 4(7): 55-66 23. Hodgkin MN, Hills CE, Squires PE. The
calcium-sensing receptor and insulin secretion: a role outside systemic control 15 years on. Journal of Endocrinology, 2008; 199:1-4.
24. Wiederkehr A, Wollheim CB. Impact of mitochondrial calcium on the coupling of metabolism to insulin secretion in the pancreatic β-cell, Cell Calcium, 2008; 44:64—76
~ 128 ~
26. Ma J, Folsom AR, Melnick SL. Association of serum and dietary magnesium with cardiovascular disease, hypertension, diabetes, insulin, and carotid arterial wall thickness: the ARIC study.J Clin Epidemiol, 1995;48:927–40
27. Praveeena S, Sujatha P, Sameera K. Trace Elements in Diabetes Mellitus, Journal of Clinical and Diagnostic Research, 2013; 7(9):1863-1865
28. Djama AAD, Kouassi GMC, Koua AA, Ofosu FG, Aboh IJK. Heavy Metal Analysis of some Anti-Diabetic medicinal plants in Cote-D’Ivoire. Current research journal of Biological Science, 2012; 4 (5):633-637.
29. Hurley, LS, Keen CL. Manganese In: Mertz W. (Ed). Trace Elements in human and Animal Nutrition, 5th Edn. Academic Press, Orlodo, 1987
30. Lee SH,Jouihan HA,Cooksey RC,Jones D,Kim HJ,Winge DR, McClain DA. Manganese supplementation protects against diet-induced diabetes in wild type mice by enhancing insulin secretion. Endocrinolog, 2013; 154(3):1029-1038
31. Kinlaw WA, McClaw L. Abnormal Zinc Metabolism in type II diabetes Mellitus. Am J. Med, 1983; 75 (2):273-237.
32. Hamid AZ, Nissar AS, Shariq RM, Bashir AL, Arshad IW. Cu, Zn, Mg Levels in non-insulin dependent diabetes Mellitus. Postgrad. Med. J, 1998; (74):665-668.
33. Emdin SO, Dodson GG, Cutfield JM, Cutfield SM. Role of zinc in insulin biosynthesis. Some possible zinc-insulin interactions in the pancreatic B-cell. Diabetologia, 1980; 9(3):174-182.
34. Chausmer AB. Zinc, insulin, and diabetes. Journal of American Coll Nutr, 1998; (17):109–115.
35. Rathore JS, Mohit U. Investigation of Zinc Concentration in Some Medicinal Plant Leaves. Research Journal of Pharmaceutical Sciences, 2013;2(1):15-17
36. Ashraf M, Hayat M, Munitaz F. A Study on elemental Contents of Medicinally important species of Artemisia L. (Asterceae) found in Pakistan. Journal of Medicinal Plant Res, 2010; (4):2256-2263
37. Khan, SA, Khan L, Hussaini I, Marwat KB, Ashtray N. Profile of Heavy Metals in selected Medicinal Plants. Pakistan Journal of Weed Science Research, 2008; 14 (1-2):101 -110.
38. Kurtzhals P, Ribel U. Action Profile of Cobalt (III)-Insulin A Novel Principle of Protraction of Potential Use for Basal Insulin Delivery. Diabetes, 1995; 44:1381-1385
39. Kurtzhals P, Kiehr B, Sørensen AR. The cobalt (III)-insulin hexamer is a prolonged-acting (III)-insulin prodrug. Journal of Pharmaceutical Sciences, 1995; 84(10):1164-1168.
40. Sathianathan V, Avelino A, Charrua A, Santha P, Matesz K, Cruz F, Nagy I. Insulin induces cobalt uptake in a subpopulation of rat cultured primary sensory neurons. Eur. Journal Neurosci, 2003; 18(9):2477-2486.
41. Lim S, Jang MH, Kim DJ, Bae SM, Kwon SC. Cobalt(III)-induced hexamerization of PEGylated insulin. International Journal of Biological Macromolecules, 2011; 49 (4):832-837
42. Heyliger CE, Tahiliani AG and McNeill JH. Effect of vanadate on elevated blood glucose and depressed cardiac performance of diabetic rats, Science, 1985; 227:1474-1477
43. Boden G, Chen X, Ruiz J, Rossum GD, Tanco S. (1996). Effect of Vanadyl sulphate on carbohydrate and lipid metabolism in Patients with non-insulin dependent diabetes mellitus. Metabolism, 1996; 45:1130 – 1135
44. Khan A, Bryden NA, Polasky MN, Anderson RA. Insulin- potentiating factor and chromium content of selected spices. Biol. Trace Elem. Res, 1990; 24:183-188
45. Abraham AS, Brooks BA, Eylath U. The effects of chromium supplementation on serum glucose and lipids in patients with and without non-insulin dependent diabetes. Metabolism, 1992; 41:768-771 46. Olabanji SO, Adebajo AC, Omobuwajo OR, Ceccato
D, Buoso MC, Moschini G. PIXE analysis of some Nigerian anti-diabetic medicinal plants (II) Nuclear Instruments and Methods. Physics Research Section B: Beam Interactions with Materials and Atoms, 2014;318:187-190