A Measuring Method for Angular Displacement
Based on Correlation Algorithm
Ping Yan
State Key Laboratory of Mechanical Transmission/Chongqing University, Chongqing, China Email: [email protected]
Yan He
State Key Laboratory of Mechanical Transmission/Chongqing University, Chongqing, China Email: [email protected]
Runzhong Yi
State Key Laboratory of Mechanical Transmission/Chongqing University, Chongqing, China Email: [email protected]
Fei Liu
State Key Laboratory of Mechanical Transmission/Chongqing University, Chongqing, China Email: [email protected]
Guorong Chen
School of Electronic & Information Engineering/Chongqing University of Science and Technology, Chongqing, China Email: [email protected]
Abstract—The existing angular displacement measurement methods rely on the manufacturing precision of the fixed-plate and moving-fixed-plate with high manufacturing cost, and it is difficult to overcome a static error and drift for the static measurement method. A kind of angular displacement measuring method based on correlation algorithm is presented with the characteristics of a low manufacturing cost, high precision, anti-noise and anti-partially damaged properties and so on. The method is that firstly full circle broadband or white noise, random data is a pre-prepared coaxially in a rotating body, then the periodic random signal is continuously formed using pickup head reads this data in the basic uniform rotation process of the rotating body. The instantaneous angular displacement of the pickup head relative to the rotating body is obtained by means of the correlation operations between the periodic random signal and the signal sequence of pre-stored data. The angular displacement among the different pickup heads is gained by subtraction for the instantaneous angular displacement of different pickup heads relative to the rotating body at the same instant. The functional relationship between the relative angular displacement of the different pickup heads and the measured angular displacement is determined by linkage equations, which is used to calculate the measured
angular displacement. Furthermore, the schematics of detective devices and the principle of the signal processing are developed to implement the method.
Index Terms—angular disposition, signal processing, correlation algorithm, measurement
I. INTRODUCTION
The existing angular displacement measurement methods are essentially classified into two categories: static measuring method and counting method. Give two examples for the former, one is that the angular displacement is read directly from mechanical indexing plate in which there are marked lines in the sub-degree angle plate, and the pointer on the base[1]. Another example is the capacitive angular position sensor, which transforms angular displacement into the variance in capacitance value[2-5]. For the latter, radial grating angular displacement sensor is most typical one. This kind of sensor can turn angular displacement into grating rotating angular, and the angular displacement value is obtained by measuring the number of the counting pulse that the grating outputs in the course of the relative rotation between the fixed plate and the moving plate on the radial grating[6-7]. Some literature has reported the current angular displacement measurement methods. Reference [8] introduced the determination of angular Manuscript received July 10, 2011; revised December 20, 2011;
accepted January, 2012.
position of rotary device by means of plate freely placed on the rotating part and the laser scanning instrument is presented together with some experimental results of such layout application. Reference [9] proposed a displacement and angular drift simultaneous measurement technique based on a defocus grating. The displacement and angular drift of the incident beam can be detected by monitoring the movements of +/- 1 diffraction order spots of the defocus grating. The relationship between drift of the incident beam and movements of +/- 1 diffraction order spots was studied in detail. Reference [10] presented an optical approach of attenuated total reflection. As a laser beam is incident upon a planar optical waveguide, an m line is obtained by scanning the incident angle. Theoretical analysis showed that the m line sharply shifts with a tiny variation of the thickness of the wave guided layer. And the specific schemes for ADM are analyzed, which are based on the angular interrogation and the intensity measurement. The calculated result of sensitivity demonstrates that the intensity measurement is more efficient than the angular interrogation. Reference [11] proposed a high-accuracy angular displacement measurement using sinusoidal phase-modulating Fabry-Perot interferometer. A CCD image sensor is used for measuring the distance between the transmitted beams from the two faces of the Fabry-Perot plate. From the distance, the initial angle of incidence is calculated. The sinusoidal phase-modulating interferometry is used for improving the measurement accuracy. It is insensitive to the external disturbance. Numerical calculation and experimental results make it clear that the interferometer allows high-accuracy measurements of angular displacements. Reference [12] provided an optical pickup head applied in angular measurement, which uses a 45 DEG plate glass to generate an astigmatic optical pickup head that is used in combination with an atomic microscope to precede angular measurement. The device of optical pickup head includes a laser diode, a 45 DEG plate glass, a collimating lens, a reflector, an object lens, a tracking starter and a quadrant detector (PDIC), wherein the quadrant detector is employed to detect signals, and the offset relation between the signals and the surface under test is determined to confirm the relation between the displacement/angle and the change of the signals. Reference [13] presented a small in-plane angular displacement by adopting two matched moire fringes and frequency analysis method. Reference [14] showed the use of path-entangled states of photons, having nonzero orbital angular momentum (OAM), increased the resolution and sensitivity of angular-displacement measurements performed using an interferometer.
However, for the above existing method, the accuracy deeply depends on the manufacture accuracy of fixed plate and the moving plate, and the manufacturing cost of instrument is relatively high. Additionally, it is difficult to avoid static errors and drift for the static measuring method. Therefore, a new method of angular displacement measurement based on correlation
algorithm is proposed to resolve these problems in the paper.
II. PRINCIPLE OF ANGULAR DISPLACEMENT MEASUREMENT BASED ON CORRELATION ALGORITHM
Full circle sequence is etched or recorded in advance by the optical, electrical, magnetic or mechanical methods on a plate or a drum body rotating around its central axis (which is called as rotation body). The sequence is located in one or more of the circular track around the same central axis, so that it forms one or more circular information orbits. The etched or recorded sequence is broadband, or white noise random, or pseudorandom sequence which has sufficient broadband random signal characteristics. The pickup head aims at the circular information orbits and continuously reads the pre-recorded random signal while the plate or a drum body rotating around its central axis. The output of the pickup head is the continuous loop random signal which has the period of the body rotational cycle along with its rotation.
The relationship between the measured angular and the angular of two pickup heads relative to the rotation axis is determined using arbitrary linkage methods. Thus the measured angular is calculated by the following formula based on the angular of two pickup heads relative to the rotation axis.
( )
f
ω= θ . (1)
Where, ω is the measured angular, θ is the angular of two pickup heads relative to the rotation axis, f(θ) is the function according to the linking method.
The function is determined by the linking method. The measurement of the measured angular displacement ω is transformed into the measurement of the angular of two pickup heads relative to the rotation axisθ with respect to (1).
There are two processing methods after the output of the pickup head is sent into Signal Processing Unit (simplified as SPU):
1) SPU stores previously the same random sequence as the etched or recorded one on the plate or a drum body. The sequence of correlation function value is obtained, which is the result of cross-correlation operation between the output sequence of pickup head and the pre-stored sequence in SPU at any time. Let τ be the time among two near maximums in the sequence of correlation function value. And also, τ is the time lapse a between the output sequence of pickup head and the pre-stored sequence. Then the instantaneous angular displacement
α between the start position of the body data track and the position of the pickup head is calculated by the following the formula:
0
360
a T
α = °. (2)
Where, T0 is time corresponds to the body rotating one
The angular value θ between two pickup heads is calculated by subtraction operation between the instantaneous angular displacement of the two pickup heads and by eliminating the zero error. θ is calculated as follows:
1 2
θ α α= − −ϕ. (3)
Where, α1,α2 are individual instantaneous angular
dispositions of the two pickup heads, ϕ is the zero error. At last, the measured angular displacement can be calculated by (1).
2) If the two pickup heads read the same information orbits, the time lapse is obtained directly by correlation operation between their output sequences of the two pickup head. Their relative angular displacement a is calculated by (2), then the measured angular displacement calculated by (1).
Furthermore, the random data sequences recorded in different tracks may be the same or completely different. In addition, these sequences may also include clock information.
The number of pickup heads is optional according to the number of measured angular displacements. The orbit which the pickup heads read may be the same, or not. If some of the pickup heads is fixed on the base as benchmark, the absolute angular displacement for the other pickup heads relative to the benchmark can be obtained. On the other hand, the relative angular displacement between any two pickup heads can be directly measured without a benchmark.
III. IMPLEMENTATION OF METHOD
The apparatus implementing the above method consists of Detector Unit (simplified as DU) and Signal Processing Unit (simplified as SPU).
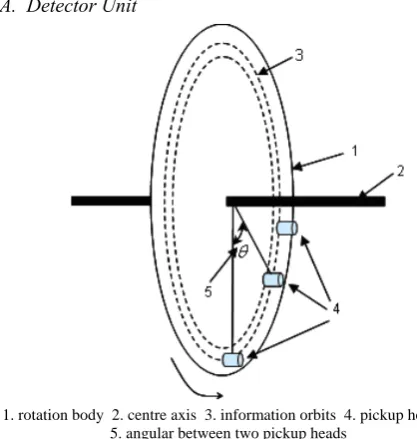
A. Detector Unit
DU is composed of one centre axis, one rotation body and one or more pickup heads (see as Figure 1). The centre line of the axis must be coincided with that of measured object rotating. The rotation body is a plate or a drum body as 2. There are many implementing methods for the rotation body and the pickup head, as follow:
(1) Using optical disk as a rotation body, pickup head is laser pickup head. In this case, the information orbits of rotation body are the circular ones which are made by pressing from a stamper or by recording using CD/DVD writer. The optical disk rotates in uniform speed driven by the spindle motor which is controlled by servo system in order to make sure the reliability of the output of the pickup heads. The optical disk manufacture, the optical disk recording, the laser pickup heads, and the servo-controlling systems is implemented by the existing components of CD, DVD, blue ray DVD, so the cost is low.
(2) Using hard magnetic disk as a rotation body, the pickup head is magnetic head. The information orbits of rotation body are circular magnetic ones. The relative parts are implemented by the existing components of magnetic disk.
(3) Using metal plate as a rotation body, the pickup head is metal electrode. The data is gained by the capacitance value between the plate and the electrode.
The recorded information sequence is analog signals or digital signals as mentioned above. If it is digital signal, the recovered data is processed directly by high-speed correlation operation and the angular displacement is calculated after being sent into SPU. If it is analog signals, the output of the pickup heads should be converted into digital signal before being sent to SPU, then post-processed signal is post-processed by high-speed correlation operation and the angular displacement is calculated. In order to facilitate signal recovery, recorded signal can be modulated, and also include clock information.
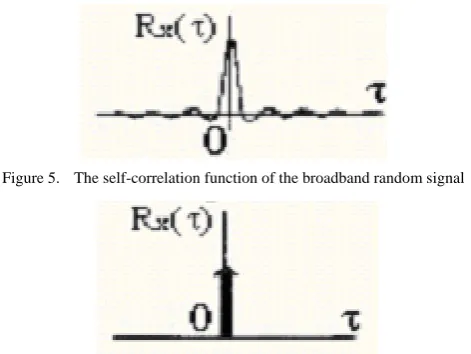
The pickup head aims at the circular information orbits and continuously reads the pre-recorded random signal while the rotation body is rotating. The output of the pickup heads is continuous periodic random data sequences. The autocorrelation function of the output satisfies the property shown in Figure 2.
B. Signal Processing Unit (SPU)
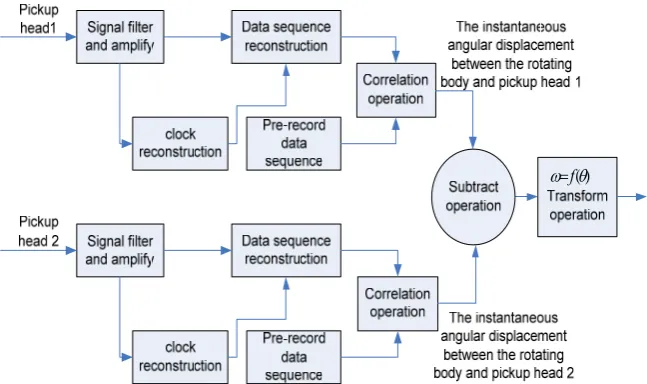
The Flow of Signal Processing: One flow of signal processing in SPU is shown in Figure 3. The signal should be pre-processed though filtering, amplification and sampling, then recovered the data sequence and clock when the output of the read pickup is analog signal. After pre-processing and recovering, continuous data flow is formed. The data flow repeats continuously pre-record 1. rotation body 2. centre axis 3. information orbits 4. pickup head(s)
5. angular between two pickup heads
Figure 1. Note how the caption is centered in the column.
random sequence when the rotation body rotating. The same sequence is also pre-stored in SPU. The sequences of the correlation function value are obtained by cross-correlation calculation between the data flow and the sequence stored in SPU at any time point. The τ value corresponding to the first maximum value in the sequences of the correlation function value is time delay between the data flow and the sequence stored in SPU. The a value is corresponding to instantaneous angular displacement between the current data start position on tracks in the rotation body and the pickup head, according to (2).
The angular displacement between the two pickup heads is obtained by subtraction operation between the instantaneous angular displacements of two pickup heads
respectively corresponding to the data start position on tracks in the rotation body. If the data tracks on which the two pickup heads read data and their start position are different, the measured value of the angular displacement between the two pickup heads is obtained by the value of the subtraction operation subtracting a zero-error (the included angle between the start positions of the two tracks). Then the measured angular displacement is gotten by (3).
The signal processing also adopts the flow shown in Figure 4 instead of Figure 3, if the two pickup heads read data on the same track. The time delay a is obtained by the direct correlation operation between the output of the two pickup heads according to (2). Then measured angular displacement is calculated by (1).
) (θ
ω=f
Figure 4. Another Flow Chart of Signal Processing in SPU ) (θ ω=f
The function relationship between the relative angular displacement of pickup heads and the measured angle displacement: The conversion formula (see in (1)) between the relative angular displacement of the pickup heads and the measured angle only depends on the inking geometrical relationship of the pickup heads and the measured angle.
For example, the relationship is ω θ= when the pickup heads are directly fixed at the two sides of the measured angle, and the rotary axis of the rotation body is vertical to the measured angle and through the angular vertex.
For another example, the relationship is ω=kθ when the measured angle links with the pickup head by a speed reduction set for gear transmission. Here, k is the transmission ratio of gear.
The calculation method of time delay between two signal based on correlation algorithm: If x t( ) is a sample function of ergodic random processes, and
( )
x t+τ is a sample that is time shifted by τ from x t( ), the Rx( )τ which represents a self-correlation function of
( )
x t is defined as follows [15-18] :
0
1
( ) lim T ( ) ( )
x T
R x t x t dt
T
τ τ
→∞
=
∫
+ . (4)For different properties x t( ) , the self-correlation functions have following characteristics: For signal that has the periodic elements, the self-correlation function does not even attenuate when the τ is very large and has obvious periodicity. For the signal that has not periodic elements attenuates quickly and tends to zero with the τ increasing. Especially, the value of the self-correlation functions for broadband random noises is maximum at
0
τ = and quickly attenuate to zero shown in Figure 5, while that for narrowband random noise has a slow attenuation property. The self-correlation function for white noises (whose frequency band is limitless) is a δ function (a pulse function) at τ=0 shown in Figure 6.
In this method, long enough information sequence (T0)
is intercepted from the broadband random noise or the white noise as pre-recorded information sequence. Repeating this information sequence forms a pseudo random signal with period T0 . The figure of
self-correlation function of this signal is shown in Figure 2. This figure has sharp features with period T0 . It reaches
to its maximum (sharp peak value) at τ =0 , ±T0 ,
0
2T
± , … , ±nT0. If the signal is digital signal, the
maximums only appear at τ=0 , ±T0 , ±2T0 , … ,
0 nT
± .
For ergodicity random process, the cross-correlation function Rxy( )τ of two random signal x t( ) and y t( ) is:
0
1
( ) lim T ( ) ( )
xy T
R x t y t dt T
τ τ
→∞
=
∫
+ . (5)Especially, if y t( )=x t a( − ), in other words y t( ) is a time delay signal of x t( ), according to the definition above about the self-correlation function and the cross-correlation function, it is easy to derive out:
( ) ( )
xy x
R τ =R τ−a . (6)
So the figure of cross-correlation function for x t( ) and y t( ) is the same as that of self-correlation function for x t( ), only with a time shift which is equal to the time delay from y t( ) to x t( ).
Consequently, if x t( ) and y t( ) both are broadband random noise or the white noise with period T0, and
( ) ( )
y t =x t a− , the cross-correlation function Rxy( )τ is shown as Figure 7. It reaches its maximum at τ =0 ,
0
T
± , ±2T0 , … , ±nT0. Otherwise, it attenuates very
quickly at other positions.
If a few noises or errors are introduced to the signal during the transmission or reading, it means that x t( ) and y t( ) are not only different in time, but also in shape. It can be proved by simple derivation that if these noises and errors are not very serious, the figure of correlation function is similar to Figure 7, but its peak is lower than that in Figure 7. The connotation of a is shown in Figure 7. This result can ensure that this measurement method possesses the strong anti-noise and anti-destruction properties.
Figure 5. The self-correlation function of the broadband random signal
IV. CASE STUDY
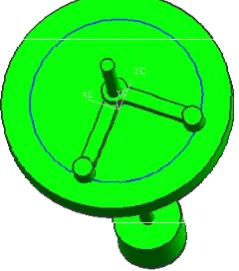
An experimental setup for angular displacement measurement is designed to apply the method as shown in Figure 8. A 2.5-inch micro disc of hard disk is used as rotation body in this setup. The disc is fixed on the rotation axis through its center and driven at constant rotation speed by a micro-DC servo motor. Two magnetic heads are installed in one end of two branch arms as read-write heads, and the other end of the arms is installed on the rotation axis through the bearing. The measured angular displacement is the angel between the two lines connecting two heads and the center of the rotation axis. The distance between the two heads and the center of the rotation axis is the same. The two heads read the same information. So the measured angular displacement is calculated only by related operation between the signals of the two heads.
The first step of experiment is recording random data on the disc of the magnetic disk. After the disc achieves uniform rotation driven by motor, the signals, which is modulated by the completely random binary white noise data generated by a white noise signal generator, is added to one magnetic head. After a period of time, the signal is revoked. So the random data is recorded on the disc. While the disc is rotating in uniform manner, the output of the two magnetic heads is amplified and demodulated to regain the binary data stream. Then the two signals are processed by synchronization and related operation. The method is described as the following steps:
Firstly, completely record long enough sequence (two or more laps complete data) according to the output data of any head. This sequence is processed by
autocorrelation operation. So a full circle of data sequence can be cut accurately. And calculate the size of this data sequence and store the size. Each data represented the value of angular displacement is gained by 3600 divided by the size.
Next,the sequence delay (number of binary bit) between the magnetic head is gained by correlation operation between the output of the heads. And the angular displacement between the two heads related to the rotation axis is obtained by multiplying the number of binary with the angular displacement per bit.
In the experiment, the disc rotates uniformly at the speed of 50 laps per second, the white noise data is record on the disc at the speed of 100Mbps, so that 2Mbit information orbit per lap is gained and per bit represents 0.648 arc-sec. The experiment shows that the measurement resolution can reach 0.648 arc-sec. The experiment also proves that the measurement accuracy is slightly affected when the data on the disc is damaged partly (less than 20% of the non-continuous trauma).
V. CONCLUSIONS
A new method of measuring angular displacement based on correlation algorithm is put forward in the paper. Comparing with the existing methods, the proposed method has strong anti-noise and anti-part-data-destruction properties. And also, the measurement set based on this method has many advantages such as high measuring accuracy, low manufacturing cost, etc. Since this method makes full use of the existing record methods and parts in the optical disk or magnetic disk field, it can widely apply in many measuring angular displacement fields.
ACKNOWLEDGMENT
This work was supported in part by a grant from National Natural Science Foundation of China (51105394), “Five-second” National Science and Technology Support Program of China(No, 2011BAF11B10), and Doctoral Fund of Ministry of Education of China (20100191120004)
REFERENCES
[1] T. W. Eom, C. S. Kang, J. A. Kim, J. W. Kim, G. J. Sik, K. J. Wan, et al. “System for simultaneous measurement of linear and angular displacement,” KR Patent 2009121885-A. Dec. 26, 2009.
[2] G. Brasseur, “A Robust Capacitive Angular Position Sensor,” Proceedings of IEEE Instrumentation and Measurement Technology Conference, Brussels, Belgium, June 04-06,1996.
[3] C. Gerard, M. Meijer, MeijerM, “A contactless capacitive angular disposition sensor,” IEEE Sensors Journal, vol. 3, no. 5(2003), pp.607 – 614.
[4] C. Liang, K. Yan, “Capacitive angular-disposition detective system based on single chip processor,” Transducer and Microsystem, vol. 8, no. 25(2006), pp.52-54.
[5] A. H Falkner, “The Use of Capacitance in the Measurement of Angular and Linear Displacement,” IEEE Figure 7. The correlation function between y t( ) and x t( ) if
( ) ( )
y t =x t a− and x t( ) is the broadband random signal of the
repeating period T0
Transactions on Instrumentation and Measurement, vol. 43, no. 6(December1994), pp.939-942.
[6] Ouyang, Wangli, “The principle and setting of the cylindrical grating angular disposition sensors,” Chinese Journal of Scientific Instrument, vol. 2, no. 11(1990), pp.102-106.
[7] S.Qin, M. Zhang, D. Luo, “The Principle and Technology of Mechanical Engineering,” Chongqing University Press, Chongqing , 2002.
[8] D. Brucas, V. Giniotis, “Measurement of angular displacement by means of laser scanner,” Journal of Vibroengineering, vol. 12, iss. 2 (2010), pp. 177-184. [9] H. T. Ma, F. J.Xi, X. L.Wang, L. A. Liu, Y. X. Ma, X. J.
Xu, et al. Applied Optics, 49, 4420(2010).
[10]F. Chen, Z. Q. Cao, Q. S. Shen, Y. J. Feng, “Optical approach to angular displacement measurement based on attenuated total reflection,” Applied Optics, vol. 44, Issue 26(2005), pp. 5393-5397.
[11]C. Zhang, X. Wang, Acta Optica Sinica. 24, 1141 (2004). [12]D. Hsieh, W. Sun, J. Yang, “Optical pickup head applied
in angular measurement,” TW Patent 200905675-A, Feb. 1 2009.
[13]J Y Shao, H Z Liu, Y C Ding, L Wang. “Determination of small in-plane angular displacement in machine tool alignment using two matched moire fringes”. Proceedings of the Insitution of Mechanical Engineers Part B-Journal Engineering Manufacture, vol. 225, no. B4(2011),pp.495-504
[14]A. K. Jha, G. S. Agarwal, R. W. Boyd. “Supersensitive measurement of angular displacements using entangled photons”. Phys. Rev., Vol. 83, no 5(2011),pp. 053829-1-5 [15]V. O. Alan, S. Alan, S. Willsky, N. Hamid, “Signals &
Systems (2nd),” Prentice Hall.USA ,1997.
[16]P. H. Hwei (L. Luo, J. Hu, Z. Li), “The signal and system,” Science Press, China ,2002.
[17]G. Hu, “Digital signal processing theory algorithm realization,” Tsinghua Publishing House, China ,2003. [18]P. Q. Cheng, “Course of Digital Signal Processing,”
Tsinghua University Press, China ,2001.
Ping Yan, Borned in Sichuan Province of China, earned Ph.D degree in electrical engineering and automation of Chongqing university of China in 1997.
She is a professor in College of Mechanical Engineering in Chongqing university, China. She has published more than 100 papers. Her research area focuses on Mechatronics and Intelligence manufacturing.
Prof. Yan is member of Standing Committee in Chinese Mechanical Engineering Society.
Yan He, Borned in Chongqing of China, earned Ph.D degree in mechanical engineering of Chongqing university of China in 2007.
She is an associated professor in College of Mechanical Engineering in Chongqing university, China. She has published more than 20 papers. Her research area focuses on sustainable manufacturing and Intelligence manufacturing.
Runzhong Yi, Borned in Sichuan Province of China, earned master degree in mechanical engineering of Chongqing university of China in 1997.
He is a senior engineer in HTK system integrated Co. LTD in Chongqing, China. He has published more than 10 papers. His research area focuses on embedded system and measurement technology.
Fei Liu, Borned in Sichuan Province of China, earned Ph.D degree in mechanical engineering of Chongqing university of China in 1987
He is a professor in College of Mechanical Engineering in Chongqing university, China. He has published more than 100 papers. His research area focuses on systems engineering and Intelligence manufacturing.
Prof. Liu is member of ASME , member of editorial board of robotics and computer integrated manufacturing and concurrent engineering:research and applications
Chen Guorong, Borned in Sichuan Province of China, earned Ph.D degree in mechanical engineering of Chongqing university of China in 2010