Page 222 www.ijiras.com | Email: [email protected]
Crop Concentration Through Geospatial Analysis: A Case Study
Of Srikakulam District, Andhra Pradesh, India
Ramamohana Rao, P.
Suneetha, P.
Sachi Devi, S
Department of Geography, Andhra University, Visakhapatnam, A.P. India
I. INTRODUCTIONS
Crop concentration means the variations in the density of any crop in an area/region at a given point of time (Chouhan, 1987). The concentration of a crop in an area largely depends on its terrain, temperature, moisture and pedagogical conditions. Each crop has a maximum, minimum and opti-mum temperature. It has a tendency to have high concentration in the areas of ideal agro-climatic conditions and the density declines as the geographical conditions become less conducive. The geographers pioneer work of Florence (1948), Chisholm (1962), Bhatia (1965), Jasbir Singh (1976) these are the contributors to mark the agricultural region with the help of the quotient method. Florence (1948) compared the share of a region with that of the entire nation with help of a quotient method. Chisholm (1962) made an attempt of a quotient to measure the relative regional concentration with the help of coefficient of localization where comparisons are made between enterprises by calculating the differences between regional and national
proportions. Therefore, crop concentration do not only provide the idea of a region dominated by particular crop but also play a role of guide to strengthen agricultural economy and land use planning. The cropping patterns of a region are closely influenced by the geo-climatic, socio-economic, historical and political factors (Hussain, M. 1996) patterns of crop land use of a region are manifestation of combined influence of physical and human environment. Differences in attitude towards the rural land in the level of prosperity and technology have produced changes in emphasis. Their effects on both landscape and land use studies are likely to be far reaching (Coppock, 1968). Weather plays a decisive role in determining the existing cropping pattern. Cropping pattern is also depending on terrain, topography, slope, soils and availability of water for irrigation use of pesticides, fertilizers and mechanization. In the simple word cropping pattern means the production of area under various crops at a point of time. It is dynamic concept because no cropping pattern can be said to be ideal for all times to a particular region. It changes in space and time with a view to meet requirements and is governed Abstract: In the present paper the cropping pattern in Srikakulam district is outlined, followed by the discussion on the area under individual crops. Bhatia’s method is used for concentration of selected crops. There has been a significant variation in the area patterns of the crop concentration in the study region. The indices of crop concentration area calculated from district statistical handbook 2010, the crop concentration indices for all mandals of the district have been calculated for crops like Paddy, Maize, Ragi, Greengram, Blacegram, Hoursegram, Chilles, Sugarcane, Mesta, Groundnut, Sesamum, Sunflower, Coconut, Fruits, Vegetables. The spatial variations in the degree of crop concentration area are found to be the result of the different interaction such as physiographic, climatic, hydrological, socio-economic and technological factors in organizational of an area.
Page 223 www.ijiras.com | Email: [email protected] largely by the physical as well as cultural and technological
factors. The change in cropping pattern in particular span of time clearly indicates the changes that have taken place in the agricultural development. These changes are brought about by socioeconomic influence.
II. STUDY AREA
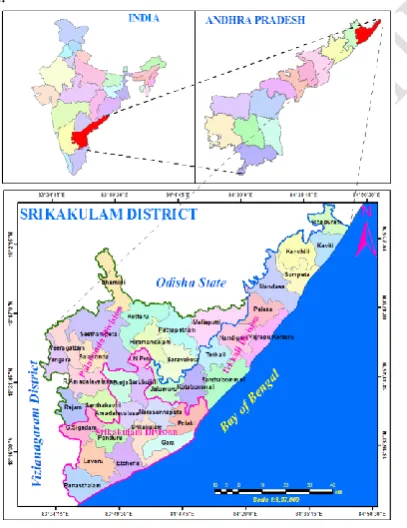
Srikakulam district is the extreme north eastern district of Andhra Pradesh and situated within the geographical co-ordinates of 1804’43’’ and 1909’59’’ of the northern latitude and 83030’57’’ and 84046’2’’ of eastern longitude (Fig-1). It was carved out of Visakhapatnam district and constituted into a separate district in the year 1950. It is bounded on the north by Odisha State and on the west by Vizianagaram district. Bay of Bengal forms the eastern boundary of the district and extends over a length of 193 Kms. The district may be divided into two natural regions, namely the hilly region called the Agency area in the northwestern part of the district and the plains which are mostly sandy on account of its proximity to the sea. The total geographical area of the district is 5,837 sq.km and has a population of 26,99,471 persons according to 2011 census. The district is divided into three revenue divisions and 38 mandals (Fig-1).
OBJECTIVES
The objective of the present study is to explain the spatial variation and concentration of selected crops in Srikakulam district.
Figure 1: Location Map of the Study Area
III. DATABASE AND METHODOLOGY
Crop concentration refers to the density or aerial occupancy of a crop in a region. The occupancy of a
particular crop (high, medium or low) is determined largely by the terrain and climate including temperature, humidity, transport facilities and demand of the crop. Each crop has tendency to have high concentration in the areas of ideal agro-climatic conditions. Delineation of crop concentration regions helps in understanding the complex agricultural landscape of a region and in ascertaining the areas where a particular crop grows well even with minimum inputs and thus has great significance for agricultural development and planning.
Both qualitative and quantitative approaches have been used to explain the degree of crop concentration. Of these the latter is more precise and accurate. The general concentration of a crop can be measured by using location quotient or coefficient of localization for which a number of stastical techniques have been evolved and applied for the demarcation of crop concentration regions. S.S.Bhatia (1965) has developed the following method to determine the regional concentration of crops in Uttar Pradesh.
Where
The higher index values represent high concentration and lower values represent low concentration or in other words the index values are directly proportional to the concentration levels. Using Bhatia’s method, the crop concentration indices for all mandals of Srikakulam district are calculated for major crops of the district. Based on the range of these values the interval value is fixed and five concentration levels namely Very high, High, Medium, Low and Very Low have been derived. This classification reveals the relative variations of concentration within the district.
Table 1: Crop Concentration Indices
Page 224 www.ijiras.com | Email: [email protected] mandals viz. Veeraghattam, Burja, Palakonda, Bhamini,
Amadalavalasa, Srikakulam, Polaki, Narasannapeta, Jalumuru, Kotabommali, Santhabommali, Palasa, Mandasa, Kanchili. Moderate concentration (0.69 – 1.01) of the crop is limited to only few mandals viz. Vangara, R.Amadalavalasa, Santhakaviti, Gara and low concentration (0.36 – 0.68) of the crop is identified in seven mandals. Very low concentration (less than 0.35) of Paddy is noticed in only two mandals.
RAGI: Ragi is the second preferable food crop of the study area and cultivated in 35 mandals. In general very high concentration (above 6.16) is obseraved in seethampeta mandal (Fig-2). Moderate concentration (3.08 – 4.61) is in only one mandal namely Etcherla and Low concentration (1.54 – 3.07) is in five mandals such as Laveru, Bhamini, Kotabommali, Santhabommali, Nandigam. Very low concentration (< 1.53) is observed in 28 mandals and it is completely absent in three mandals. During the past 30 years cropped area has drastically reduced.
BLACKGRAM: Blackgram is the second dominant crop in the district and accounts for 11.50 percent of the total croped area. Fig- 3 shows the concentration of Blackgram and Greengram in the study area. This crop is cultivated in all mandals. Very high concentration (above 1.77) is observed in Polaki and Narasannapeta mandals. High concentration (1.35 – 1.76) is found in nine mandals viz. Veeraghattam, Vangara, Santhakaviti, Burja, Palakonda, Sarubujjili, Amadalavalasa, Santhabommali, L.N Peta and Moderate concentration (0.93 – 1.34) in seven mandals viz. R.Amadalavalasa, Ponduru, Srikakulam, Gara, Jalumuru, Pathapatnam and Tekkali are identified. Low concentration (0.51 – 0.92) is found in eight mandals and Very low concentration (< 0.50) in twelve mandals observed.
Figure 2: Srikakulam district – Concentration of Paddy and Ragi
GREENGRAM: It is grown in 334.17 Sq.Km and accounts for 8.3 percent of the total croped area. Very high concentration (above 1.86) is exhibited in Gara and Jalumuru mandals and High concentration (1.42 – 1.85) is displayed in G.Sigadam, Amadalavalasa, Palakonda, Tekkali and Santhabommali (Fig- 3). Moderate concentration (0.98 – 1.41) is observed in nine mandals and Low concentration (0.54 – 0.97) is marked in 12 mandals. Very low concentration (< 0.53) is identified in 10 mandals only.
GROUNDNUT: It is cultivated principally as an oil seed, but considerable quantities are consumed directly as food. It is also a good rotation crop having good soil recuperative value and also serves as an efficent cover against soil erosion, besides being good forage for cattle. Fig -4 shows the concentration of Groundnut and Sesamum in the study area. Very high concentration (above 3.96) in Rajam and G.Sigadam mandals and Moderate concentration (2.97 – 3.95) in Laveru, Ranastalm, Ponduru and Santhakaviti mandals and Low concentration (0.99 – 1.97) in R.Amadalavalasa and Kotabommali mandals and Very Low concentration (< 0.98) is identified in 30 mandals.
SESAMUM: This crop is grown in a very limited extent in the district, being cultivated in 73.03 Sq.Km and accounts for 1.8 percent of total croped area. Very high concentration (above 2.55) in Etcherla, Palasa and Sompeta mandals, High concentration (1.93 – 2.54) in Kanchili, Laveru, Bhamini, Veeragattam and Mandasa mandals (Fig – 4), Moderate concentration (1.31 – 1.92) in G.Sigadam, Rajam, Hiramandalam and Saravakota mandals and Low concentration (0.69 – 1.30) in Kotturu, Jalumuru, Pathapatnam and Meliaputti mandals. 25 mandals shows very low concentration (< 0.68). Sesamum is cultivated during both Kharif as well as Rabi seasons in the district.
Page 225 www.ijiras.com | Email: [email protected]
Figure 4: Srikakulam district – Concentration of Groundnut and Sesamum
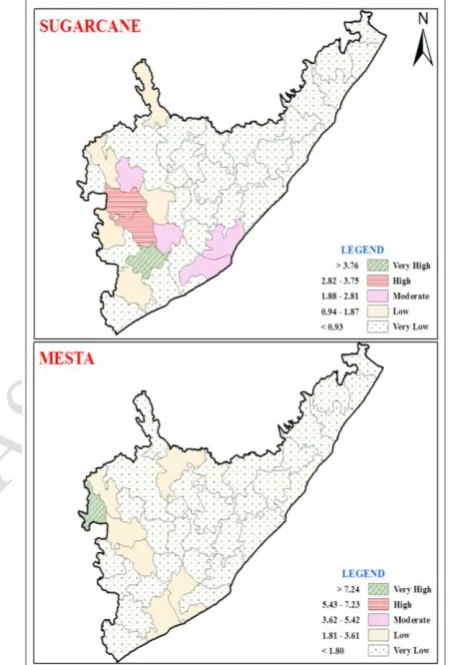
SUGARCANE: It is an important commercial crop highly concentrated in the western part of the district. Fig – 5 shows the concentration of Sugarcane and Mesta in the study area. Very high concentration (above 3.76) is found only in Ponduru mandal. High concentration (2.82 – 3.75) in R.Amadalavalasa and Santhakaviti mandals, Moderate concentration (1.88 – 2.81) in Gara, Amadalavalasa, Palakonda and Polaki mandals, Low concentration (0.94 – 1.87) in Laveru, Bhamini, Rajam, Burja and Veeragattam mandals, Very low concentration (< 0.93) in 14 mandals and absent in the remaining 12 mandals.
MESTA: It is an important commercial crop of the study area. Very high concentration (above 7.24) is observed only in Vangara mandal. Low concentration (1.81 – 3.61) in six mandal viz. Etcherla, Srikakulam, R.Amadalavalasa, Santhakaviti, Veeragattam, and Kotturu mandls. Very low concentration (< 1.80) is in 18 mandals and absent in the remaining 13 mandals. Most of the district has low to very low concentration of Mesta (Fig- 5).
MAIZE: It is also an important crop among food crops of the study area, being cultivated in 50.07 Sq.Km and accounts for 1.2 percent of total cropped area. Though the crop is grown in both the seasons it is mainly cultivated during kharif season under rainfed conditions. Very high concentration is observed in only two mandals and High concentration in 2 mandals. Very low concentration is in 11 mandals and completely absent in 23 mandals.
HORSEGRAM: Horesgram is cultivated in 79.98 Sq.Km and accounts for 2.0 percent of the total cropped area. Very high concentration is found in two mandals, Moderate
concentration is marked in two mandals. Low concentration is observed in 3 mandals and very low concentration is identified in 30 mandals.
FRUITS: Fruits are cultivated in 349.45 Sq.Km hectares and accounts for 8.6 percent of total cropped area of the district. Very high concentration is in 2 mandals Seethampeta and Vajrapukotturu. and Moderate concentration is in Mandasa and Palasa mandals. Very low concentration is found in 33 mandals of the district.
Figure 5: Srikakulam district – Concentration of Sugarcane and Mesta
IV. CONCLUSIONS
From the above study it is observed that Paddy is the widely cultivated crop followed by Black and Green grams in Srikakulam district. The concentration of all other crops are limited to a few mandals only.
REFERENCES
[1] Bhaha S. S. (1965), “Patterns of crop concentration and diversification in India” Economic Geography pp. 40, 41, 53, 55.
Page 226 www.ijiras.com | Email: [email protected] [3] Chouhan T. S. (1987) “Agriculture Geography – A Case
Study of Rajasthan State, Academic Publication, Jaipur. P. 261.
[4] Coppock, J. T. (1968) Changes in Landuse in Great Britain, in Landuse and Resources Studies in Applied Geography. London, Institute of British Geographers Special Publication no. 1p. 111.
[5] District Statistical Handbook (2010). Srikakulam District, Directorate of Economics and Statistics, Govt. of Andhra Pradesh.
[6] Florence P. S. (1948) “Investment Location and size of plant”. (Quoted from, Agricultural Geography of Jasbir Singh and S. S. Dhillon) p. 217.
[7] Gibs J and Martin W. (1962) Americal Sociological Review. 27.
[8] Jasbir Singh (1976) Agricultural Geography, Tata McGraw Hill Publishing Co. Ltd. New Delhi, p. 221.
[9] Majid Husain (1996) Systematic Agricultural Geography, Reprented 2004, Rawat Publication, Jaipur and new Delhi, pp. 217, 218.
[10]Mali N. G. (2004) A Critical Study of Agricultural Productivity in Parbhani District (M. S.) thesis submitted to Swami Ramanand Teerth Marath wada University, Nanded p. 155.
[11]Shinde S. D. (1980) Agriculture in an under developed Region A Geographical Survey. Himalaya Publishing Houses, Bombay, pp.53.
[12]Singh Jasbir (1974) An agricultural Atlas at India, - A Geographical analysis, Kurukshetra, Vishal Publication, p. 299.