Open Access
Research
Practice characteristics and prescribing of cardiovascular drugs in
areas with higher risk of CHD in Scotland: cross-sectional study
Gary McLean
Address: Research Fellow, General Practice & Primary Care, Community Based Sciences, University of Glasgow, 1 Horselethill Road, G12 9LX, Glasgow, UK
Email: Gary McLean - gml17y@clinmed.gla.ac.uk
Abstract
Background: We examine whether practices in areas with higher risks of CHD prescribe different levels of cardiovascular drugs and describe how they differ in GP and practice characteristics.
Methods: Propensity score matching was used to identify two groups of practices in Scotland. The cases were in areas with 5% or more of the population in South Asian ethnic groups. The controls were in areas with less than 1% of the population in South Asian ethnic groups and were matched for other population characteristics.
Results: The 39 case practices have lower prescribing rates than the matched controls for all heart disease drugs Significant different are found for six drugs (statins, ace Inhibitors, clopidogrel, thiazides, warfarin and digoxin. The differences range from 12.8% less for amlodipine to 43.9% for clopidogrel. The case practices also have lower prescribing costs than the unmatched group with the exception of ace inhibitors and aspirin. The highest prescribing costs for all drugs are found in the matched control group. The case practices are smaller than the controls, and have fewer GPs per 1,000 patients. Case practices have fewer quality markers and receive less in total resources, but have higher sums reimbursed to cover their employed staff costs.
Conclusion: Patients with higher risk of CHD tend to live in areas served by practices with lower prescribing rates and poorer structural characteristics. The scale of the differences in prescribing suggests that health care system factors rather than individual treatment decisions cause inequity in care. Identifying whether South Asian individuals are less likely to receive heart disease drugs than non South Asians requires individual-level prescribing data, which is currently not available in the UK.
Background
In 2003 CHD was second only to cancer as the major cause of mortality in Scotland. [1] Although CHD mortal-ity has fallen in recent years death rates from CHD are amongst the highest in the world and the second highest in Western Europe. [2] There is a strong correlation
between increasing incidence and mortality from CHD and deprivation. CHD is also the major cause of morbid-ity and mortalmorbid-ity in the South Asian population in the United Kingdom. [3] South Asians have been found to be at increased risk compared to the rest of the population of England and Wales [4] by at least 40 percent. [5-7] Published: 15 July 2008
International Journal for Equity in Health 2008, 7:18 doi:10.1186/1475-9276-7-18
Received: 17 August 2007 Accepted: 15 July 2008
This article is available from: http://www.equityhealthj.com/content/7/1/18
© 2008 McLean; licensee BioMed Central Ltd.
Though Scotland has one of the worst incidences of heart disease in Europe [8] only one of the 19 studies identified in Bhopal's review was based in Scotland. [4,9]
The concept of equity is a central objective of most health care systems in the developed world. While governments from across the political spectrum, both in the UK and internationally, have attempted to tackle perceived ineq-uities in health care the concept of equity remains some-what elusive. [10,11] A theoretical framework has been set out which examines equity through three domains: equal access to health care for people in equal need; equal treat-ment for people in equal need; and equal outcomes for people in equal need. [11] This simple framework has been used as a basis to examine the equity of GP prescrib-ing rates for statins and five major CHD drug groups focused around the equal treatment in equal need domain. [12,13] These papers are amongst a growing body of work in the UK, which have focused on equity of prescribing. However, these studies have largely been con-fined to England and Wales. The purpose of this paper is to explore the equity of prescribing for a range of heart dis-ease drugs in Scotland. Having established prescribing dif-ferences, the analysis then considers structural differences in GP and practice provision. Using a matching tech-nique, we use examine the notion of equal treatment for people in equal need and how this relates to differences in equal access to health care.
Many patients do not receive the appropriate treatment for CHD. Research has found that prescribing rates of stat-ins and lipid lowering drugs were negatively correlated with deprivation. [9,14] The Acheson report highlighted the need for studies of ethnic inequalities. [15] Several studies have highlighted ethnic variations in access to and provision of hospital interventions. [16,17] Although a more recent study found no evidence that South Asian ethnicity was associated with lower use of cardiac proce-dures or drugs independent of clinical need, [18] there has been little research conducted on the equity of prescribing in the community.
One US study based on individual data discovered that black and minority ethnic group patients were less likely to be prescribed a beta-blocker. [19] There are no studies based on individual level data from the UK. Two studies in England have shown negative correlations between pre-scribing of lipid-lowering drugs [14] and beta-blockers [20] with the estimated proportion of patients from South Asian ethnic groups. Members of ethnic minorities tend to be situated in deprived areas and deprived areas have been shown to have lower quality and fewer general practi-tioner services than more affluent areas. [21-23] While a study in Scotland has found under the new GMS contract that achievement levels for the taking of beta blockers for
patients with CHD, was found to be negatively associated with deprivation [24].
Since ethnicity data are not available on individual pre-scriptions, we compare prescribing rates for practices serv-ing areas with higher proportions of South Asian patients to those serving areas with lower proportions of South Asian patients. Thus, we can use higher proportions of South Asian patients as a proxy for higher risk of CHD and then assess whether practices with populations associated with higher CHD prevalence have higher prescribing rates. We use a statistical matching process since practices differ in a range of other dimensions that may influence prescribing. Propensity score matching is a method for matching members of different groups based on a range of characteristics. Comparisons of the matched groups reveal the impact of the stratifying variable. The use of a match-ing process allows for the formation of groups based on their risk of having CHD, which can be assessed from their ethnicity, deprivation, social factors such as health and education and demographic factors. Comparisons are made in prescribing rates of a wide range of drugs used in the treatment of heart disease.
Methods
National data are used to give 100% coverage of practices. Collection of characteristics of persons receiving prescrip-tions has only recently started to be piloted in the Scottish prescribing information system. It is therefore possible only to analyse variations in prescribing between practices (or higher organisational units). Ethnic compositions of practice populations are also not collected, so these must be estimated based on the ethnic compositions of the areas from which practices draw their populations.
The most recent and comprehensive information on the ethnicity of the Scottish population comes from the 2001 Census. Figures are produced for output areas (N = 42,604; average population = 117 persons) using the fol-lowing ethnic groups: White (97.9%); Indian (0.3%); Pakistani and Other South Asian (0.9%); Chinese (0.3%); Other (0.6%).
We analysed the characteristics of patients and practices that were associated with the estimated South Asian pro-portion. We used a binomial logit multiple regression model [25] to identify the significant population charac-teristic predictors used to match the GP practices. [26-28] As well as providing an epidemiological analysis of the geographical distribution of South Asians in Scotland, this allowed us to generate a propensity score for each practice, representing the expected South Asian proportion given the other population factors with which it is significantly correlated. [29]
We compared the prescribing rates for the cases (practices with South Asian proportions over 5%) with figures for matched controls and unmatched controls. These figures are weighted averages where the weights represent the propensity of each control to match the cases. The pro-pensity score matching results were estimated using STATA v8.2. We used the Kernel matching method [30], though the results are similar with other options. We esti-mated standard errors via bootstrapping with 100 replica-tions.
We analysed data for a wide range of drugs used in the treatment of heart disease, including: statins, beta block-ers, aspirin, warfarin, ACE inhibitors, clopidogrel, thi-azide, digoxin, spironolactone and amlodipine. Prescribing rates were measured by age and sex standardi-sation of total Gross Ingredient Costs in 2001/2 by Spe-cific Therapeutic group age-sex weightings related prescribing units (Star_PUs) for cardiovascular drugs, with the exception of lipid-lowering drugs for which we had Defined Daily Doses.
We also obtained a set of GP and practice characteristics from the General Medical Practitioner Database for Octo-ber 2002 and GMS payments made to practices in the 2002/3 financial year. The Royal College of General Prac-titioners (RCGP) supplied lists of practices that had received Practice Accreditation (PA) or the Quality Prac-tice Award (QPA) by the end of 2002.
Five variables were used in the matching equation cover-ing deprivation, health rurality and number of temporary residents. Deprivation was measured by the Carstairs score, derived at output level. The Carstairs score is an unweighted sum of z-scores for four variables representing car ownership, male unemployment, social class and overcrowding. For health, two indirectly standardised var-iables taken from the Census representing the age sex standardised ratio for limiting long term illness and not good health were used. Variables representing the propor-tion of temporary residents and number of patients qual-ifying for a road mileage payment were also used.
Results
Table 1 lists the variables used for matching and the matching equation. The table shows that the matching equation indicates that the cases group is significantly dif-ferent from practices with less than 1% of the population with South Asian patients for all the variables with the exception of the number of temporary residents. Table 1 also shows that the matching process leaves us with a matched control group of 140 practices. The matched control group has higher deprivation and morbidity scores but the differences are not statistically significant. Both the cases and matched control group have higher
Table 1: Population characteristics and the matching equation
Variable Mean Values Coefficient P-value Mean Value Matched
Controls (SA<1%)
Difference Between Cases And Matched
Control P value
Mean Value Unmatched Controls
(SA<1%)
All Cases (SA>5%)
Number of Practices 702 39 140 523
Proportion of South Asian patients
0.01 0.10 - - 0 <0.001
Carstairs -0.17 2.3 0.45 <0.001 2.6 0.22 -0.7
Census not good health
98.9 122 0.11 <0.001 134 0.12 91.4
Census limiting long term illness
98.8 107 -0.2 <0.001 121 0.09 95.2
Temporary residents/ practice list size
0.03 0.01 -3.23 0.22 0 0.31 0.05
Proportion of list eligible for road mileage payments
0.11 0 -2.88 <0.001 0.01 0.15 0.19
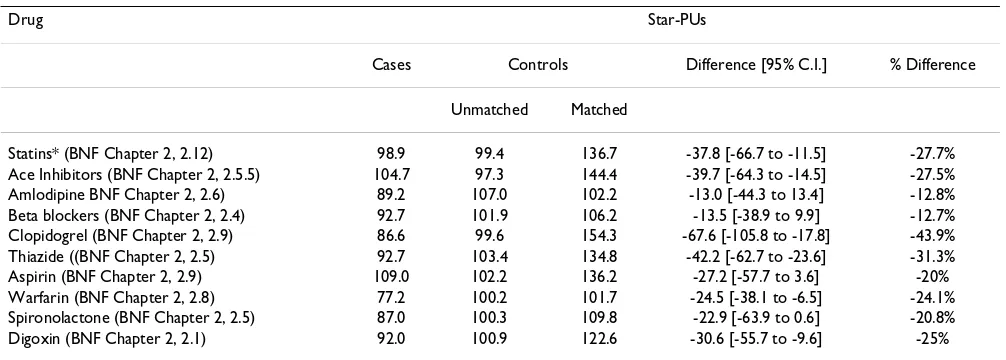
Table 2: Prescribing rates for CHD drugs
Drug Star-PUs
Cases Controls Difference [95% C.I.] % Difference
Unmatched Matched
Statins* (BNF Chapter 2, 2.12) 98.9 99.4 136.7 -37.8 [-66.7 to -11.5] -27.7%
Ace Inhibitors (BNF Chapter 2, 2.5.5) 104.7 97.3 144.4 -39.7 [-64.3 to -14.5] -27.5%
Amlodipine BNF Chapter 2, 2.6) 89.2 107.0 102.2 -13.0 [-44.3 to 13.4] -12.8%
Beta blockers (BNF Chapter 2, 2.4) 92.7 101.9 106.2 -13.5 [-38.9 to 9.9] -12.7%
Clopidogrel (BNF Chapter 2, 2.9) 86.6 99.6 154.3 -67.6 [-105.8 to -17.8] -43.9%
Thiazide ((BNF Chapter 2, 2.5) 92.7 103.4 134.8 -42.2 [-62.7 to -23.6] -31.3%
Aspirin (BNF Chapter 2, 2.9) 109.0 102.2 136.2 -27.2 [-57.7 to 3.6] -20%
Warfarin (BNF Chapter 2, 2.8) 77.2 100.2 101.7 -24.5 [-38.1 to -6.5] -24.1%
Spironolactone (BNF Chapter 2, 2.5) 87.0 100.3 109.8 -22.9 [-63.9 to 0.6] -20.8%
Digoxin (BNF Chapter 2, 2.1) 92.0 100.9 122.6 -30.6 [-55.7 to -9.6] -25%
Notes: * measured in Defined Daily Doses
deprivation and morbidity scores than the unmatched control group.
For all CHD drugs, case practices have lower prescribing costs than the matched controls. Significant different are found for six drugs (statins, ace Inhibitors, clopidogrel, thiazides, warfarin and digoxin. The differences range from 12.8% less for amlodipine to 43.9% for clopidogrel. The case practices also have lower prescribing costs than the unmatched group with the exception of ace inhibitors and aspirin. The highest prescribing costs for all drugs are found in the matched control group. However, this does not account for differences in deprivation and morbidity between the matched and unmatched controls group.
Table 3 shows that the cases group has nearly double the proportion of GPs over 55 than the matched control. Prac-tices in the case group have significantly fewer GPs per practice (2.9 to 3.9) and receive less through performing minor surgery. There are no QPA or PMS practices in the cases group. The cases group have significantly fewer GPs (0.57 to 0.66) and WTE GPs (0.58 to 0.73) per 1000 of the population than the matched controls group. The cases group also receive significantly lower GMS payments (47.9 to 53.4)
The unmatched control group has the highest number of GPs per practice and higher number of GP and WTE per 100 of the population. They are more likely to be a train-ing, PA or QPA practice. Practices in the unmatched con-trol group also receive more through minor surgery and GMS payments than the other two groups.
Discussion
This paper has examined equity of prescribing for a range of heart disease drugs in Scotland. We have found notable differences between practices serving areas with more than 5% of the population in South Asian ethnic groups and those with similar characteristics, but serving popula-tions with less than 1%.
Previous research has consistently found that patients from South Asian ethnic groups have higher levels of CHD and consequently a greater need for provision and quality of health care. Thus, the findings of this study would suggest that prescribing rates and provision of care in Scotland are inequitable and that the inverse care law still applies. [10,23]
Possible explanations and implications
Scotland has higher overall rates of CHD than the rest of the UK and most European countries as evidenced by available mortality and morbidity statistics. [2,31] South Asian populations in the UK have a younger age profile than average leading to lower CHD rates and lower expected rates of prescribing. [32,33] However, our case practices are concentrated in one Scottish NHS Board and this Board has the highest recorded rates of CHD in Scot-land. [34,35] Moreover the cases group has higher levels of deprivation than the unmatched control group. Thus prescribing should be higher in the cases group if depriva-tion is related to CHD prevalence. But we found higher prescribing for all drug groups in the unmatched control group for all but two of the indicators.
Table 3: Practice and GP characteristics
Variable Cases Controls Difference [95% Confidence Interval] Difference %
Unmatched Matched
GP characteristics
Proportion of female GPs 0.37 0.34 0.35 0.02 [-0.06 to 0.12] 5.7%
Average age of GPs 46.2 45.5 44.1 2.1 [-1.6 to 3.5] 4.7%
Proportion of GPs over 55 years 0.19 0.12 0.10 0.09 [0.03 to 0.16] 90%
Practice size
Numbers of GPs per practice 2.9 4.9 3.9 -1.0 [-1.7 to -0.4] -25.7%
Single-handed practice 0.23 0.11 0.11 0.12 [-0.07 to 0.21] 109%
One or two partner practice 0.44 0.35 0.27 0.17 [-0.07 to 0.31] 62.9%
Services offered
Practice does not offer minor surgery 0.18 0.04 0.08 0.10 [-0.04 to 0.19] 125%
Minor surgery payments (£ per capita) 0.67 0.92 0.82 -0.25 [-0.42 to -0.09] -18.3%
Night visit claims per capita 0.03 0.03 0.03 -0.00 [-0.002,0.004] 0.0%
Quality markers
Training practice 0.18 0.25 0.21 -0.03 [-0.2, to 0.01] -14.3%
Practice Accreditation 0.19 0.25 0.24 -0.05 [-0.16 to 0.14] -20.9%
Quality Practice Award 0.00 0.06 0.04 -0.04 [-0.06 to -0.01] 100%
Personal Medical Services 0.00 0.03 0.06 -0.06 [-0.10 to -0.02] 100%
Resources/workload
GPs per 1000 population 0.57 0.88 0.66 -0.09 [-0.14 to,-0.03] -15.7%
WTE GPs per 1000 population 0.58 0.90 0.73 -0.15 [-0.29 to -0.02] -21.6%
Total GMS payments 47.9 57.8 53.4 -4.5 [-6.1 to -2.2] -10.3
hours than those in the matched control group. This is of concern since South Asian patients have higher than aver-age consultation rates. [36] Consequently a greater work-load is placed on a fewer number of doctors within the cases group and lower prescribing rates have been found to be positively associated with lower ratios of GPs to patients. [37] Moreover, research into aspects of quality of care have emphasised the importance of adequate time for consultations with the view that GPs require greater time to be allowed to treat complex diseases such as CHD in the proper manner. [36,38] There is little evidence with regard to the impact on prescribing rates for practices with accreditation. However, there is some evidence that train-ing practices, of which there are far fewer in the cases group, have lower prescribing rates than non-training practices. [39,40]
Strengths and weaknesses of the study
of prescribing of practices in more deprived areas. We have estimated more than 20% differences in prescribing rates, yet South Asians represent only 9% of the popula-tion in the cases group. Taking account of the higher prev-alence rate in South Asians suggests that no more than 11% of heart disease patients are South Asian. Even if no South Asian patients receive treatment and all non-South Asian patients receive treatment, this cannot account for the 20% difference in prescribing. Our results must there-fore reflect, at least in part, contextual influences rather than compositional characteristics alone. [37] Our compar-ison of structural factors suggests that there are considera-ble differences in the structure of care delivery that may constitute part of these contextual influences.
Conclusion
This study shows that South Asians tend to be registered with practices with lower prescribing rates, but it would appear that all patients in these practices are at greater risk of having lower prescribing rates. Moreover, patients in these practices also suffer from poorer access to and lower quality GP services. Understanding the structural, attitudi-nal or behavioural reasons for lower prescribing in these practices and how these are affected by GP and practice provision is a challenge for future work. Identifying whether South Asian individuals are less likely to receive heart disease drugs than non South Asians will require individual-level prescribing analysis. Our results suggest that it will be important to identify the role of practice-related factors.
Competing interests
The author declares that he has no competing interests.
Acknowledgements
GM conceptualised the study with Prof Matt Sutton from the University of Manchester. GM conducted the data analysis, wrote and revised the manu-script. GM is the guarantor. The author would like to thank Prof Matt Sut-ton for his role in conceptualising the paper and advice on conducting the analysis.
GM was funded by the Platform Project when this analysis was undertaken. The Platform Project is a Scottish School of Primary Care collaborative venture between the Universities of Aberdeen, Dundee, Edinburgh and Glasgow, with ISDScotland and the Royal College of General Practitioners. It is jointly-funded by the Chief Scientist Office (Award No: RDG HR01012) and the Scottish Higher Education Funding Council (Award No: OOB/3/ 67).
The views expressed are the sole responsibility of the authors and not the funders.
References
1. [http://www.gro-scotland.gov.uk/grosweb/grosweb.nsf/pages/file12/ $file/03t6-4.pdf].
2. Scottish Health Executive Department: CHD/Stroke Task force Report. Scottish Executive; 2000.
3. Wild S, McKiegue PM: Cross sectional analysis of mortality by country of birth in England and Wales. BMJ 1997, 314:705-710.
4. Bhopal R: What is the risk of coronary heart disease in South Asians? A review of UK research. Journal of Public Health Medicine
2000, 22:375-385.
5. Shaukat N, de Bono DP: Are Indo-origin people especially sus-ceptible to coronary heart disease? Postgraduate Medical Journal
1994, 70:315-318.
6. McKiegue PM, Marmot MG: Mortality from coronary heart dis-ease in Asian communities in London. BMJ 1998, 297:903. 7. Balarajan R: Ethnicity and variations in mortality from CHD.
Health Trends 1996, 28:45-51.
8. Scottish Intercollegiate Guidelines Network: Lipids and the Pri-mary Prevention of Coronary Heart Disease. Sign Publication Number 40 1999.
9. Primatesta P, Poulter NR: Lipid concentrations and the use of lipid lowering drugs: evidence from a national cross sectional survey. BMJ 2000, 321:1322-1325.
10. Hart JT: The inverse care law. Lancet 1971, 1:405-12.
11. Goddard M, Smith P: Equity of access to health care services: theory and evidence from the UK. Soc Sci Med 2001,
53:1149-1162.
12. Ward P, Noyce P, Leger A: How equitable are GP prescribing rates for statins?: an ecological study in four primary care trusts in North West England. International Journal for equity in Health 2007, 6:2.
13. Ward PR, Noyce PR, St Leger AS: Exploring the equity of GP practice prescribing rates for selected coronary heart dis-ease drugs: a multiple regression analysis with proxies of healthcare need. International Journal for Equity in Health 2005, 4:3. 14. Patel MG, Wright DJ, Gill PS: Prescribing of lipid lowering drugs to South Asian patients: ecological study. BMJ 2002, 325:25-6. 15. Acheson D: Independent report into inequalities in health.
London: HMSO; 1998.
16. Majeed FA, Chaturvedi N, Reading R: Equity in the NHS. Monitor-ing and promotMonitor-ing equity and secondary care. BMJ 1994,
308:1426-9.
17. Majeed FA, Eliahoo J, Bardsley M: Variation in coronary artery bypass grafting, angioplasty, cataract surgery, and hip replacement rates among primary care groups in London: association with population and practice characteristics.
Journal of Public Health Medicine 2002, 24:21-26.
18. Britton A, Shipley M, Marmot M, Hemingway H: Does Access to cardiac investigation and treatment contribute to social and ethnic differences in coronary heart disease? Whitehall II prospective cohort study. BMJ 2004, 329:318-321.
19. Gottlieb S, McCarter R, Vogel R: Effect of beta-blockade on mor-tality among high-risk and low-risk patients after myocardial infarction. New England Journal of Medicine 1998, 339:489-497. 20. Ward P, Noyce P, Leger A: Are GP practice prescribing rates
for coronary heart disease drugs equitable? A cross sectional analysis in four primary care trusts in England. Journal of Epi-demiology and Community Health 2004, 58:89-96.
21. Baker R: General practice in Gloucestershire, Avon and Som-erset; explaining variations in standards. British Journal of Gen-eral Practice 1992, 42:415-8.
22. Gilliam S: Provision of health clinics in relation to population need: another example of the inverse care law. British Journal of General Practice 1992, 42:54-6.
23. Watt G: The inverse care law today. The Lancet 2002,
360:252-254.
24. McLean G, Sutton M, Guthrie B: Deprivation and quality of pri-mary care services: evidence for the persistence of the inverse care law from the UK Quality and Outcomes Frame-work. Journal of Epidemiology and Community Health 2006,
60:917-922.
25. Maddala GS: Limited Dependent and Qualitative Variables in Econometrics. In Econometric Society Monographs No.3 Cambridge University Press: New York; 1983.
26. Scottish Health Executive Department: Fair Shares for All: Final Report. In The National Review of Resources Allocation for the NHS in Scotland Scottish Executive; 2000.
27. Social Disadvantage Research Centre: Scottish Indices of Depriva-tion 2003. Department of Social Policy and Research Work Univer-sity of Oxford; 2003.
Publish with BioMed Central and every scientist can read your work free of charge
"BioMed Central will be the most significant development for disseminating the results of biomedical researc h in our lifetime."
Sir Paul Nurse, Cancer Research UK
Your research papers will be:
available free of charge to the entire biomedical community
peer reviewed and published immediately upon acceptance
cited in PubMed and archived on PubMed Central
yours — you keep the copyright
Submit your manuscript here:
http://www.biomedcentral.com/info/publishing_adv.asp
BioMedcentral
Scotland From 1 April 1990. 1990 [http://www.sfa.scot.nhs.uk/]. Edinburgh: Scottish Executive accessed October 2005
29. Foster EM: Propensity score matching: an illustrative analysis of dose response. Medical Care 2003, 41(1):1183-1192.
30. Deeks JJ, Dinnes J, D'Amico R, Sowden AJ, Sakovitch C, Song F, Pet-ticrew M, Altman DG: Evaluating non-randomised intervention studies. Health Technology Assessment 2003, 7(27):1-173.
31. General Registrar Office for Scotland Vital events reference tables
2002 [http://www.groscotland.gov.uk/files/02t1-7.pdf]. (accessed 2 October 2005)
32. Pears E, Hannaford PC, Taylor MW: Gender, age and deprivation differences in the primary care management of hyperten-sion in Scotland: a cross sectional database study. Family Prac-tice 2003, 20(1):22-31.
33. Watt GCM, Hart CL, Hole DJ, Smith GD, Gillis CR, Hawthorne VM:
Risk Factors for cardio respiratory and all cause mortality in men and women in Urban Scotland: 15-year follow up. Scot-tish Medical Journal 1995, 40(4):108-112.
34. Information and Statistics Division: Scottish Health Statistics 1999. NHS Scotland 2000.
35. Public Health Institute of Scotland: Health and well-being profiles for Scottish constituencies. NHS Scotland 2004.
36. Gilliam S, Jarman B, White P, Law R: Ethnic differences in consul-tation rates in urban general practice. BMJ 1989, 299:953-7. 37. Baker D, Klein R: Explaining outputs of primary health care:
population and practice factors. BMJ 1991, 303:225-229. 38. Rice N, Dixon P, Lloyd DCEF, Roberts D: Derivation of a needs
based capitation formula for allocating prescribing budgets to health authorities and primary care groups in England: regression analysis. BMJ 2000, 320:284-8.
39. Sutton M, Gravelle H, Morris S, Leyland A, Windmeijer F, Dibben C, Muirhead M: Allocation of Resources to English Areas: Individ-ual and small area determinants of morbidity and use of healthcare resources. Report to the Department of Health in Eng-land. Edinburgh: Information and Statistics Division 2002.
40. Steinke D, Bain D, McDonald T, Davey P: Practice factors that influence antibiotic prescribing in general practice in Tay-side. Journal of Antimicrobial Chemotherapy 2000, 46:509-512. 41. Ward P, Noyce P, Leger A: Developing prevalence-based
pre-scribing units for analysing variations in general practitioner prescribing: a case study using statins. J Clin Pharm Ther 2003,
28:23-29.
42. Diez-Roux A: Bringing context back into epidemiology: varia-bles and fallacies in multi-level analysis. Am J Public Health 1998,