R E S E A R C H
Open Access
Quality of life among tuberculosis (TB), TB
retreatment and/or TB-HIV co-infected primary
public health care patients in three districts
in South Africa
Julia Louw
1, Karl Peltzer
1,2*, Pamela Naidoo
1,3, Gladys Matseke
1, Gugu Mchunu
1and Bomkazi Tutshana
1Abstract
Introduction:TB and HIV co-morbidity amount to a massive burden on healthcare systems in many countries. This study investigates health related quality of life among tuberculosis (TB), TB retreatment and TB-HIV co-infected public primary health care patients in three districts in South Africa.
Methods:A cross sectional study was conducted among 4900 TB patients who were in the first month of anti-TB treatment in primary public health care clinics in three districts in South Africa. Quality of life was assessed using the social functioning (SF)-12 Health Survey through face to face interviews. Associations of physical health (Physical health Component Summary = PCS) and mental health (Mental health Component Summary = MCS) were identified using logistic regression analyses.
Results:The overall physical and mental health scores were 42.5 and 40.7, respectively. Emotional role, general health and bodily pain had the lowest sub-scale scores, while energy and fatigue and mental health had the highest domain scores. Independent Kruskal–Wallis tests found significant positive effects of being TB-HIV co-infected on the domains of mental health functioning, emotional role, energy and fatigue, social function and physical role, while significant negative effects were observed on general health, bodily pain and physical function. In multivariable analysis higher educational, lower psychological distress, having fewer chronic conditions and being HIV negative were significantly positively associated with PCS, and low poverty, low psychological distress and being HIV positive were positively significantly associated with MCS.
Conclusion:TB and HIV weaken patients’physical functioning and impair their quality of life.It is imperative that TB control programmes at public health clinics design strategies to improve the quality of health of TB and HIV co-infected patients.
Keywords:Social functioning, Tuberculosis patients, HIV and AIDS, Quality of life, South Africa
Introduction
Tuberculosis (TB) and HIV co-infection comprise an enormous burden on health care systems, particularly in heavily infected countries such as South Africa (SA) [1,2]. SA alone has 28% of the world’s population of HIV and TB co-infected individuals [2]. Particularly physical
and mental distress is found to be common in TB patients leading to poor disease outcome or poor treat-ment outcome [3]. Physical health was found to be more affected than mental health when comparing between people with active TB in China and the general popula-tion [4]. In the same study using the Social Funcpopula-tioning (SF)-36 scale, significantly lower scores were found on Physical Function (PF), Physical Role (RP), General Health (GH), Bodily Pain (BP) and Vitality (VT) sub-scales and no significant differences on Emotional Role (RE), Social Function (SF) and Mental Health (MH) sub-scales [4]. In a study conducted among people living * Correspondence:kpeltzer@hsrc.ac.za
1
HIV/STI and TB (HAST) Research Programme, Human Sciences Research Council, Pretoria, Durban and Cape Town, South Africa
2
Department of Psychology, University of the Free State, Bloemfontein, South Africa
Full list of author information is available at the end of the article
Table 1 Socio-demographics and health variables sample characteristics
Total Men Women P
(n = 4900) (n = 2671) (54.5%) (n = 2229) (45.5%)
N % N % N %
Age(range 18–93) 36.2 11.5 37.2 11.5 34.8 11.4 0.000
18–24 643 13.3 276 10.6 358 16.5 0.000
25–34 1841 38.1 928 35.7 899 41.4
35–44 13 27.1 780 30.0 515 23.7
45–54 671 13.9 399 15.3 259 11.9
55–64 265 5.5 161 6.2 95 4.4
65 or more 104 2.2 58 2.2 45 2.1
Marital status
Never married 3323 72.7 1734 70.2 1589 75.6 0.000
Married/cohabitating 982 21.5 594 24.1 388 18.5 0.000
Separated/divorced/widowed 265 5.8 141 5.7 124 5.9 0.783
Education
Grade 7 or less 1269 26.3 745 28.8 502 23.2 0.000
Grade 8–11 2213 45.9 1126 47.4 960 44.3 0.031
Grade 12 or more 1336 27.7 613 23.7 704 32.5 0.000
Poverty index (5–20)
Low (5) 1592 35.0 882 35.2 710 34.4 0.329
Medium (6–12) 2195 48.2 1117 47.2 1018 49.3
High (13–20) 768 16.9 433 17.4 335 16.2
Geolocality
Urban residence 3151 66.2 1691 65.4 1460 67.2 0.212
Rural residence 877 18.4 480 18.6 397 18.3 0.780
Informal settlement 730 15.3 413 16.0 317 14.6 0.181
Health variables
New TB patient 3650 76.6 1946 75.2 1704 78.4 0.009
Retreatment TB patient 1113 23.4 643 24.8 470 21.6
HIV positive 2585 59.9 1222 53.4 1363 67.4 0.000
HIV negative 1728 40.1 1068 46.6 660 32.6
Other chronic illnesses
Zero 3042 72.7 1681 75.1 1361 70.0 0.001
One 680 16.3 335 15.0 345 17.7
Two 293 7.0 151 6.7 142 7.3
Three or more 167 4.0 71 3.2 96 4.9
Partner HIV positive 1192 27.2 600 25.0 592 29.8 0.020
Partner HIV negative or unknown status 3194 72.8 1800 75.0 1394 70.2
Tobacco use (daily or almost daily) 964 20.0 777 29.5 187 8.5 0.000
Hazardous or harmful alcohol use 1120 23.3 820 31.8 280 13.0 0.000
Psychological distress (K>15) 3913 81.1 2127 80.8 1786 81.4 0.245
Had sex in the past 3 months 2318 51.3 1336 54.1 982 48.0 0.000
On antiretroviral therapy 899 22.1 401 18.8 498 25.8 0.000
Adherence to TB treatment 2191 61.1 1153 64.1 1038 68.6 0.007
with HIV and AIDS the mean physical summary scores of 49.0 and mean mental summary scores of 45.6 were found using the Social Functioning questionnaire (SF-12) [5]. Significantly higher physical health and mental health summary scores were reported for patients in Uganda who completed eight months TB therapy com-pared to patients who only started their treatment [3]. Further, another study found that active TB patients reported lower scores across all SF-36 subscales com-pared to those individuals not infected by TB [6]. In addition, lower mean scores were reported on all domains of the SF-36 when comparing people with ac-tive TB to people with latent TB infection [7].
A number of factors have been identified as being associated with better health-related quality of life in tu-berculosis and/or HIV patients including younger age [3,8], higher household income [8], low stigma [9], low depression and family support [1,10]. Even though there has been an increasing interest in the area of health-related quality of life (HRQoL), there still seems to be a lack of research especially among TB and HIV co-infected patients. This study investigates health related quality of life among tuberculosis (TB), TB retreatment and/or TB-HIV co-infected public primary health care patients in three districts in South Africa.
Method
Study design
This is a cross-sectional study among tuberculosis patients in public primary care clinics in SA.
Study participants and sampling procedures
Three provinces in SA with the highest TB caseload were selected for inclusion in the study. One district in each province with the highest TB caseloads was ultimately
included. The National Department of Health (NDoH) determined the districts with the highest TB caseloads based on District Health Information System (DHIS) in-formation. These districts were Siyanda in the Northern Cape Province, Nelson Mandela Metro in the Eastern Cape Province and eThekwini in KwaZulu-Natal Province. Within each of these three study districts 14 public pri-mary health care facilities were selected on the basis of the highest TB caseloads per clinic (N = 42). This was estab-lished through record review of TB cases in all clinics of the study districts over a six months period prior to the study. The type of health facilities were primary health care clinic or community health centre. All new TB and new retreatment patients were consecutively interviewed within one month of anti-tuberculosis treatment. The interviews were conducted by trained external research assistants for a period of 6 months from mid April to mid October in all 42 clinics in 2011. A health care provider who identified a new TB treatment or retreatment patient (within one month on TB treatment) of 18 years or older informed the patient about the study and referred the pa-tient for participation if interested. This was irrespective if the patient was co-infected with HIV or not. A research assistant asked for permission/consent from patients attending the primary care facility to participate in the interview. Ethical approval from the Human Sciences Re-search Council ReRe-search Ethics Committee (Protocol REC No.1/16/02/11) was received. The Department of Health in South Africa has also provided approval for this study.
Measures
Socioeconomic characteristics
A researcher-designed questionnaire was used to record information on participants’ age, gender, educational level, marital status, income, employment status,
Table 2 SF-12 health survey scale means for patients with active TB infected with HIV and without HIV
SF-12 Subscales TB-HIV infection TB without HIV P-value Total sample
M (SD) M (SD) M (SD)
General health (GH) 35.5 (12.6) 42.6 (13.4) 0.000 38.5 (13.4)
Bodily Pain (BP) 38.5 (11.8) 40.2 (11.8) 0.000 39.2 (11.9)
Physical Function (PF) 40.5 (11.2) 41.4 (10.7) 0.027 40.9 (11.1)
Physical Role (RP) 40.9 (9.2) 39.8 (9.6) 0.000 40.5 (9.4)
Social Function (SF) 41.0 (11.7) 39.3 (13.0) 0.000 40.5 (12.2)
Mental Health (MH) 43.1 (9.5) 40.6 (10.5) 0.000 42.2 (10.0)
Energy and Fatigue (Vitality) (VT) 49.8 (10.7) 46.3 (11.3) 0.000 48.3 (11.1)
Emotional role (RE) 37.6 (11.1) 36.3 (12.1) 0.000 37.3 (11.5)
SF-12
Physical Health (PCS) 39.6 (9.2) 42.5 (8.4) 0.000 40.7 (9.1)
dwelling characteristics and residential status. Poverty was assessed with 5 items on the availability or non-availability of shelter, fuel or electricity, clean water, food
and cash income in the past week. Response options ranged from 1 =“Not one day” to 4 =“Every day of the week”. Poverty was defined as higher scores on non-availability of essential items. The total score ranged from 5 to 20 with 20 indicative of the ‘highest level of poverty’. The categories of poverty, therefore, are as fol-lows: 5 = low, 6–12 = medium and 13–20 = high. Cron-bach alpha for the poverty index in this study was 0.89.
The 10-itemKessler Psychological Distress Scale(K-10) was used to measure global psychological distress, in-cluding significant pathology which does not meet for-mal criteria for a psychiatric illness [11,12]. This scale measures the following symptoms over the preceding 30 days by asking: “In the past 30 days, how often did you feel: nervous; so nervous that nothing could calm you down; hopeless; restless or fidgety; so restless that you could not sit still; depressed; that everything was an ef-fort; so sad that nothing could cheer you up; worthless; tired out for no good reason?”The frequency with which each of these items was experienced was recorded using a five-point Likert scale ranging from“none of the time” to “all the time”. This score was then summed with in-creasing scores reflecting an inin-creasing degree of psy-chological distress. The K-10 has been shown to capture variability related to non-specific depression, anxiety and substance abuse, but does not measure suicidality or psychoses [13]. This scale serves to identify individuals who are likely to meet formal definitions for anxiety and/or depressive disorders, as well as to identify indivi-duals with sub-clinical illness who may not meet formal definitions for a specific disorder [11]. This scale is in-creasingly used in population mental health research and has been validated in multiple settings [14] includ-ing HIV positive individuals in South Africa [15]. There was significant agreement between the K-10 and the MINI-defined depressive and anxiety disorders. A re-ceiver operating characteristic (ROC) curve analysis indicated that the K-10 showed agreeable sensitivity and specificity in detecting depression (area under the ROC curve, 0.77), generalized anxiety disorder (0.78), and posttraumatic stress disorder (PTSD) (0.77) [15]. Fur-ther, the K10 demonstrated moderate discriminating ability in detecting depression and anxiety disorders in the general population in South Africa; evidenced by area under the receiver operating curves of 0.73 and 0.72 respectively, with a cut off of 16 [16]. We examined the K-10 scale used as a binary variable, comparing scores of 10–15 versus 16 or more. The internal reli-ability coefficient for the K-10 in this study was alpha = 0.92.
Alcohol consumption
The 10-item Alcohol Disorder Identification Test (AUDIT) [17] assesses alcohol consumption level (3
Table 3 Predictors of Physical Health (PCS)
Unadjusted Odds Ratio (95% CI)
Adjusted Odds Ratio (95% CI)a,b
Sociodemographics
Age 0.98 (0.97–0.99)*** 0.99 (0.97–1.02)
Female 1.00 1.00
Male 0.94 (0.83–1.07) 0.85 (0.55–1.31)
Education
Grade 7 or less 1.00 1.00
Grade 8–11 1.41 (1.21–1.65)*** 1.08 (0.53–1.99)
Grade 12 or more 1.70 (1.43–2.01)*** 1.70 (1.01–2.85)*
Marital status
Never married 1.00 1.00
Married/cohabitating 0.92 (0.79–1.07) 0.91 (0.52–1.59)
Divorced/separated/widowed 0.73 (0.56–0.95)* 0.74 (0.35–1.58)
Poverty index
Low 1.00 1.00
Medium 0.77 (0.67–0.89)*** 0.84 (0.52–1.38)
High 1.43 (1.17–1.74)*** 1.10 (0.55–2.20)
Health variables
New TB patient 1.00 1.00
TB retreatment patient 0.78 (0.68–0.90)*** 0.70 (0.45–1.09)
HIV negative 1.00 1.00
HIV positive 0.55 (0.48–0.63)*** 0.25 (0.11–0.61)**
Chronic conditions
Zero 1.00 1.00
One 0.92 (0.77–1.10) 0.63 (0.36–1.13)
Two 0.85 (0.65–1.10) 0.88 (0.41–1.91)
Three or more 0.65 (0.46–0.91)* 0.36 (0.13–0.99)*
Psychological distress (K>15) 0.37 (0.31–0.44)*** 0.27 (0.14–0.52)***
Alcohol: low risk (AUDIT 0–7) 1.00 —
Medium (AUDIT 8–19) 0.99 (0.83–1.07)
High (AUDIT 20–40) 0.83 (0.65–1.06)
Tobacco use (daily or almost daily)
1.07 (0.92–1.26) —
Had sex in past 3 months 1.50 1.32–1.71)*** 1.38 (0.89–2.14)
On ART 0.80 (0.68–0.94)** 0.56 (0.27–1.13)
TB medication adherence 0.63 (0.54–0.74)*** 0.76 (0.46–1.25)
ART adherence 0.41 (0.30–0.56)*** 0.79 (0.41–1.52)
Partner HIV negative/unknown 1.00 1.00
Partner HIV positive 0.71 (0.62–0.82)*** 0.99 (0.63–1.56)
a
Using“enter”LR selection of variables.
b
Hosmer and Lemeshow Chi-square 6.10, df 8, 0.637; Cox and Snell R2
0.18;
Nagelkerke R2
0.25.
items), symptoms of alcohol dependence (3 items), and problems associated with alcohol use (4 items). Heavy episodic drinking is defined as the consumption of six standard drinks (10 g alcohol) or more on a single
occasion [17]. In South Africa a standard drink is 12 g alcohol. Because AUDIT is reported to be less sensitive at identifying risk drinking in women [18], the cut-off points of binge drinking for women (4 units) were
Table 4 Predictors of Mental Health (MCS)
Unadjusted Odds Ratio (95% CI) Adjusted Odds Ratio (95% CI)a,b
Sociodemographics
Age 1.00 (0.99–1.00) 1.02 (1.00–1.03)
Gender
Female 1.00 1.00
Male 1.11 (0.98–1.00) 1.21 (0.83–1.77)
Education
Grade 7 or less 1.00 1.00
Grade 8–11 1.16 (0.99–1.35) 0.75 (0.48–1.17)
Grade 12 or more 1.42 (1.20–1.68)*** 1.02 (0.59–1.74)
Marital status
Never married 1.00 —
Married/cohabitating 1.13 (0.97–1.32)
Divorced/separated/widowed 0.80 (0.61–1.04)
Poverty index
Low 1.00 1.00
Medium 0.98 (0.85–1.13) 0.98 (0.65–1.48)
High 0.31 (0.25–0.38)*** 0.48 (0.26–0.90)*
Health variables
New TB patient 1.00 —
TB retreatment patient 0.93 (0.80–1.07)
HIV negative 1.00 1.00
HIV positive 1.58 (1.38–1.80)*** 2.99 (1.61–5.57)***
Chronic conditions —
Zero 1.00
One 1.05 (0.87–1.26)
Two 1.20 (0.93–1.56)
Three or more 1.13 (0.80–1.59)
Psychological distress (K>15) 0.28 (0.23–0.33)*** 0.09 (0.05–0.17)***
Alcohol: low risk (AUDIT 0–7) 1.00 —
Medium (AUDIT 8–19) 0.92 (0.78–1.09)
High (AUDIT 20–40) 1.00 (0.78–1.27)
Tobacco use (daily or almost daily) 0.81 (0.69–0.94)** 0.85 (0.50–1.45)
Had sex in past 3 months 0.75 (0.66–0.85)*** 0.77 (0.53–1.11)
On ART 1.05 (0.89–1.23) —
TB medication adherence 1.11 (0.95–1.30) —
ART adherence 1.98 (1.48–2.67)*** 1.19 (0.78–1.87)
Partner HIV negative/unknown 1.00 1.00
Partner HIV positive 1.31 (1.13–1.51)*** 1.45 (0.99–2.16)
a
Using“enter”LR selection of variables.
b
Hosmer and Lemeshow Chi-square 14.39 df 8, 0.072; Cox and Snell R2
0.21; Nagelkerke R2
reduced by one unit as compared with men (5 units), as recommended by [18]. Responses to items on the AUDIT are rated on a 4-point Likert scale from 0 to 4, for a maximum score of 40 points. Higher AUDIT scores indicate more severe levels of risk; scores 8 indicate a tendency to problematic drinking. The Alcohol Use Dis-orders Identification Test (AUDIT) was developed by the World Health Organization as an effective screening instrument for alcohol use problems among patients seeking primary care for other medical problems in international settings including African countries (Kenya and Zimbabwe) [17,19] and has been validated in HIV patients in South Africa showing excellent sensitivity and specificity in detecting MINI-defined dependence/ abuse (area under the receiver-operating characteristic curve, 0.96) [20] and among TB and HIV patients in pri-mary care in Zambia demonstrating good discriminatory ability in detecting MINI-defined current AUDs (AUDIT = 0.98 for women and 0.75 for men) [21]. Cron-bach alpha for the AUDIT in this sample was 0.92, indi-cating excellent reliability. Hazardous drinking is defined as a quantity or pattern of alcohol consumption that places patients at risk for adverse health events, while harmful drinking is defined as alcohol consumption that results in adverse events (e.g., physical or psychological harm) [22].
Tobacco use
Two questions were asked about the use of tobacco pro-ducts. (a) Do you currently use one or more of the follow-ing tobacco products (cigarettes, snuff, chewfollow-ing tobacco, cigars, etc.)? Response options were‘yes’or‘no’. (b) In the past month, how often have you used one or more of the following tobacco products (cigarettes, snuff, chewing tobacco, cigars, etc.) Response options were once or twice, weekly, almost daily and daily.
Social functioning (SF-12)
The social functioning (SF)-12 is a measure of general health functioning. The 12 items reflect the following eight sub-domains: self-perceived general health (1 item); bodily pain (1 item); physical functioning (2 items); physical role (2 items); vitality (1 item); general health (1 item); social functioning (1 item); mental health (2 items) and emotional role (2 items); Cronbach alpha was 0.80 in this study. For each respondent, the SF-12 scoring algorithm gener-ates a Physical health Component Summary (PCS-12) score and A Mental health Component Summary (MCS-12) score. These scores are created by weight-ing and then summweight-ing the SF-12 item responses using two separate sets of weights (a physical weight and a mental weight) and then by normalizing the weighted sums to be comparable with a population mean score of 50 with a standard deviation of 10
[23]. The lower the physical health score (PCS-12) or mental health score (MCS-12), the more activity lim-itations a person has.
TB treatment status, HIV status and antiretroviral treat-ment was assessed by self-report and from medical infor-mation. HIV testing status was assessed by self-report. Anti TB medication adherence was assessed with the question “In your tuberculosis treatment in the past 3–4 weeks how many percent were you taking your anti-tuberculosis medication?” using a Visual Analogue Scale (VAS). TB medication non-adherence was defined as hav-ing taken less than 90 percent their anti-tuberculosis medication. ART adherence was assessed with the ques-tion “How many percent of your HIV medication did to take in the past 4 weeks?” using a Visual Analogue Scale (VAS). ART non-adherence was defined as having taken less than 90 percent of ART. Patients were also asked about a list of 10 chronic illness conditions they had been diagnosed with including hypertension, diabetes, depres-sion, stomach ulcer, migraine headache, cancer, arthritis, asthma, diabetes, cholesterol.
Data analysis
Data were analyzed using Statistical Package for the So-cial Sciences (SPSS) for Windows software application programme version 19.0. Frequencies, means, standard deviations, were calculated to describe the sample. Data were checked for normality distribution and outliers. For non-normal distribution non-parametric tests were used. Associations of PCS and MCS were identified using lo-gistic regression analyses. By taking the median of the dependent variables (PCS and MCS) as a cut-off point, PCS and MCS were dichotomized as poor = 0 or good = 1. Following each univariate regression, multivariable lo-gistic regression models were constructed. Independ-ent variables from the univariate analyses were entered into the multivariable model if significant at P<0.05 level. For each model, the R2 are presented to describe the amount of variance explained by the multivariable model. Probability below 0.05 was regarded as statistically significant.
Results
Social demographic characteristics
were re-treatment TB patients. From those who had tested for HIV, 76.3% had been tested within the last year and another 16.4% within the last three years, 59.9% were HIV positive, 22.1% of the HIV positive patients were on antiretroviral therapy. Twenty percent reported tobacco use daily or almost daily, and 23.3% were hazardous or harmful alcohol users (AUDIT 8 or more). Regarding adherence to TB medication, 61.1% indicated that they had not missed at least on one day in the past 10 days their medication. From those who were on antiretroviral treatment, 58.2% reported that they had not at least once missed their ARVs in the last seven days. A large proportion (81%) reported psychological distress and 16.3% had been diagnosed with at least one chronic illness condition (see Table 1).
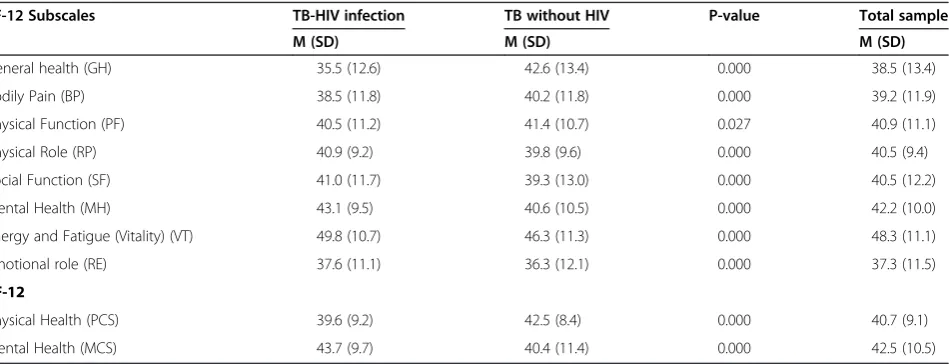
Comparison of SF-12 health survey scale means
The overall physical and mental health scores were 42.5 and 40.7, respectively. Emotional role, general health and bodily pain had the lowest sub-scale scores, while energy and fatigue and mental health had the highest domain scores. Independent Kruskal–Wallis tests found significant positive effects of being TB-HIV co-infected on the domains of mental health functioning, emotional role, energy and fatigue, social function and physical role, while significant negative effects were observed on general health, bodily pain and physical function (see Table 2).
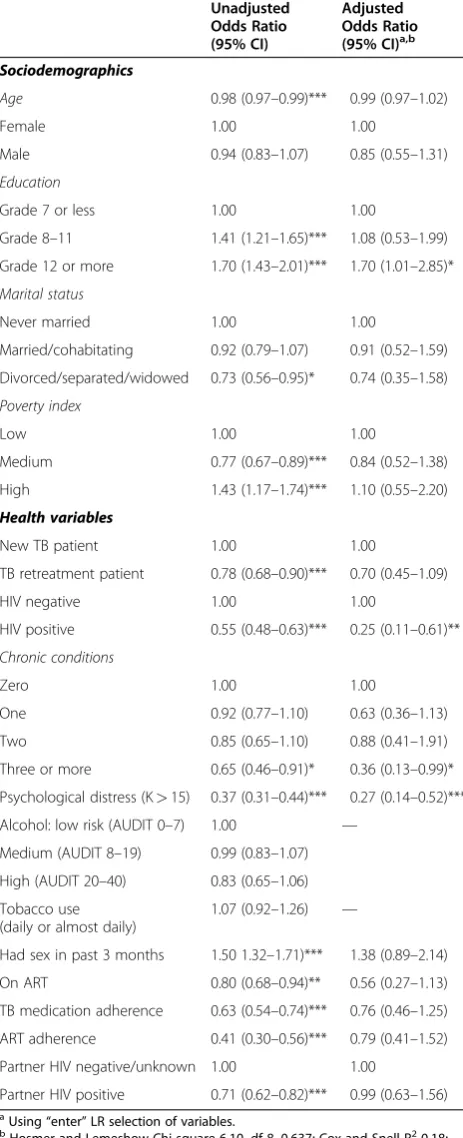
Predictors of physical health (PCS)
In multivariable analysis higher educational level (Grade 12 or more) (OR = 1.70, 95% CI = 1.01–2.85), lower psy-chological distress (OR = 0.27, 95% CI = 0.14–0.52), diag-nosed with less than three or more chronic conditions (OR = 0.36, 95% CI = 0.13–0.99) and being HIV negative (OR = 0.25, 95% CI = 0.11–0.61) were significantly posi-tively associated with PCS (see Table 3).
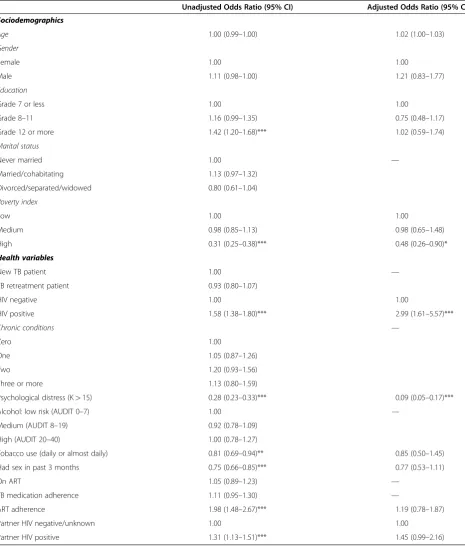
Predictors of mental health (MCS)
In multivariable analysis low poverty (OR = 0.48, 95% CI = 0.26–0.90), scoring low on the psychological distress scale (OR = 0.09, 95% CI = 0.05–0.17) and being HIV positive (OR = 2.99, 95% CI = 1.61–5.57) were positively significantly associated with MCS (see Table 4).
Discussion
The study found among a large sample of tuberculosis public primary care patients in South Africa overall low physical and mental health QoL scores (42.5 and 40.7 on the SF-12, respectively) at the beginning of TB treat-ment. This finding seems significantly lower than found in TB patients in China [6] and among people living with HIV and AIDS [5]. Further, in the present study sig-nificant positive effects of being TB-HIV co-infected on
mental health QoL and significant negative effects were observed on physical function QoL. In contrast with the present study, Deribew’s [1] study included HIV positive individuals with and without TB. They found lower mean scores on all domains for people co-infected with HIV and TB compared to people living with HIV with-out TB. Overall, according to a systematic review done in 2009, findings indicate that anti-TB treatment had a positive effect on improving health-related QoL, more so on the physical health of patients than the mental health [24]. So it could be that physical health improves with anti-TB medication greater in TB only patients than in TB-HIV co-infected patients. Kittikraisak et al. [8] found improved health utility after TB treatment was more evident in HIV-infected patients than those unin-fected in almost all domains. This they report may be a result of the relief of some TB symptoms and adverse events from TB and HIV drug interactions [8] or after dealing with the effect of HIV disease severity [3].
In multivariable analysis higher educational, lower psy-chological distress, having fewer chronic conditions and being HIV negative were significantly positively asso-ciated with physical health QoL, and low poverty, low psychological distress and being HIV positive were posi-tively significantly associated with mental health QoL. Other studies [1,10] also found that low psychological distress (depression) was associated with higher QoL in TB patients. Being diagnosed with several chronic condi-tions and scoring high on the psychological distress scale, may further increase levels of anxiety and depres-sion given the rigorous treatment regimen. The finding that indicators of higher socio-economic status (educa-tion, low poverty) in this study were associated with bet-ter QoL in TB patients is in agreement with a number of studies [1,8,25]. Unlike in some other studies [3,4,26-29], this study did not find age and gender differences in relation to health-related QoL in TB patients.
Study limitations
not included in the analysis, although this would have been important as they could have been related to QoL.
Conclusion
TB and HIV cause deterioration in patients’ health-related quality of life. Even though progress in scaling up interventions to address the co-epidemics of TB and HIV has continued [30,31], new ways to strengthen in-fection control is needed. Thus, it is imperative that TB control programmes at public health clinics design strat-egies to improve the quality of health of TB and/or HIV co-infected patients.
Competing interests
The authors declare that they have no competing interests.
Acknowledgements
The Department of Health in South Africa funded this study through a tender“NDOH: 21/2010-2011 Implementation and monitoring of Screening and Brief Intervention for alcohol use disorders among Tuberculosis patients” that was awarded the HSRC.
Author details
1HIV/STI and TB (HAST) Research Programme, Human Sciences Research
Council, Pretoria, Durban and Cape Town, South Africa.2Department of Psychology, University of the Free State, Bloemfontein, South Africa.
3
Department of Psychology, University of the Western Cape, Cape Town, South Africa.
Authors’contributions
JL, KP, PN and GM were the main contributors to the conceptualization of the study. JL, KP contributed significantly to the first draft of the paper and all authors contributed to the subsequent drafts and finalization. All authors read and approved the final manuscript.
Received: 21 April 2012 Accepted: 28 June 2012 Published: 28 June 2012
References
1. Deribew A, Tesfaye M, Hailmichael Y, Negussu N, Daba S, Wogi A, Belachew T, Apers L, Colebunders R:Tuberculosis and HIV co-infection: its impact on quality of life.Health Qual Life Outcomes2009,7:105.
2. World Health Organisation (WHO):Global TB control report 2010. Geneva: WHO; 2010.
3. Babikako HM, Neuhauser D, Katamba A, Mupere E:Feasibility, reliability and validity of health-related quality of life questionnaire among adult pulmonary tuberculosis patients in urban Uganda: cross-sectional study. Health Qual Life Outcomes2010,8:93.
4. Chamla D:The assessment of patients’health-related quality of life during tuberculosis in Wahan, China.Int J Turberc Lung Dis2004, 8:1100–1106.
5. Chariyalertsak S, Wansom T, Kawichai S, Ruangyuttikarna C, Kemerer VF, Wu AW:Reliability and validity of Thai versions of the MOS-HIV and SF 12 quality of life questionnaires in people living with HIV/AIDS.Health Qual Life Outcomes2011,9:15.
6. Wang Y, Lii J, Lu F:Measuring and assessing the quality of life of patients with pulmonary tuberculosis.Zhonghua Jie He He Hu Xi Za Zhi 1998,21(12):720–723.
7. Marra CA, Marra F, Cox VC, Palepu A, Fitzgerald M:Factors influencing quality of life in patients with active tuberculosis.Health Qual Life Outcomes2004,20:58.
8. Kittikraisak W, Kingkaew P, Teerawattananon Y, Yothasamut J, Natesuwan S, Manosuthi W, Chongsuvivatwong V, Whitehead SJ:Health related quality of life among patients with tuberculosis and HIV in Thailand 2012.PLoS One2012,7:1 e29775.
9. Hansel NN, Albert W, Wu AW, Chang, Diette:Quality of life in tuberculosis: patient and provider perspectives.Qual Life Res2004,13:639–652.
10. Wig N, Lekshmi R, Pal H, Ahuja V, Mittal CM, Agarwa SK:The impact of HIV/ AIDS on the quality of life: a cross sectional study in North India.Indian J of Medical Sciences2006,60(1):3–11.
11. Kessler R, Andrews G, Colpe LJ, Hiripi E, Mroczek DK, Normand ST, Walters EE, Zaslavsky AM:Short screening scales to monitor population prevalences and trends in nonspecific psychological distress.Psychol Med 2002,32:959–976.
12. Kessler RC, Barker PR, Colpe LJ, Epstein JF, Gfroerer JC, Hiripi E, Howes MJ, Normand SL, Manderscheid RW, Walters EE, Zaslavsky AM:Screening for serious mental illness in the general population.Arch Gen Psychiatry2003, 60(2):184–189.
13. Brooks RT, Beard J, Steel Z:Factor structure and interpretation of the K10. Psychol Assess2006,18(1):62e70.
14. Andrews G, Slade T:Interpreting scores on the Kessler Psychological Distress Scale (K10).Aust N Z J Public Health2001,25:494–497. 15. Spies G, Kader K, Kidd M, Smit J, Myer L, Stein DJ, Seedat S:Validity of the
K-10 in detecting DSM-IV-defined depression and anxiety disorders among HIV-infected individuals.AIDS Care2009,21(9):1163–1168. 16. Andersen LS, Grimsrud A, Myer L, Williams DR, Stein DJ, Seedat S:The
psychometric properties of the K10 and K6 scales in screening for mood and anxiety disorders in the South African Stress and Health study.Int J Methods Psychiatr Res2011,20(4):215–223.
17. Babor TF, Higgins-Biddle JC:Brief intervention for hazardous and harmful drinking a manual for use in primary care. Geneva: World Health Organziation Department of Mental Health and Substance Dependence; 2001.
18. Freeborn DK, Polen MR, Hollis JF, Senft RA:Screening and brief intervention for hazardous drinking in an HMO: effects on medical care utilization.J of Behavioral Health Services and Research2000,27(4):446–453. 19. Saunders JB, Aasland OG, Amundsen A, Grant M:Alcohol consumption and
related problems among primary health care patients: WHO
collaborative project on early detection of persons with harmful alcohol consumption–I.Addiction1993,88(3):349–362.
20. Myer L, Smit J, Roux LL, Parker S, Stein DJ, Seedat S:Common mental disorders among HIV-infected individuals in South Africa: prevalence, predictors, and validation of brief psychiatric rating scales.AIDS Patient Care STDS2008,22(2):147–158.
21. Chishinga N, Kinyanda E, Weiss HA, Patel V, Ayles H, Seedat S:Validation of brief screening tools for depressive and alcohol use disorders among TB and HIV patients in primary care in Zambia.BMC Psychiatry2011,11:75. 22. Reid MC, Fiellin DA, O’Connor PG:Harzardous and harmful alcohol
consumption in primary care.Arch Intern Med1999,159(15):1681. 23. Ware JE, Kosinski M, Keller SD:How to Score the SF-12 Physical and Mental
Health Summary Scales, 2nd end. Boston: Health Institute, New England Medical Center; 1995.
24. Guo N, Marra F, Marra CA:Measuring health-related quality of life in tuberculosis: a systematic review.Health Qual Life Outcomes2009,7(14):1–10. 25. Duyan V, Kurt B, Aktas Z, Duyan GC, Kulkul DO:Relationship between
quality of life and characteristics of patients hospitalised with tuberculosis.Int J Tuberc Lung Dis2005,9(12):1361–1366.
26. Yang L, Wu DL, Guo HG, Liu JW:A study of the psychological and social factors in patients with pulmonary tuberculosis.Zhonghua Jie He He Hu Xi Za Zhi2003,26:704–707.
27. Nyamathi A, Berg J, Jones T, Leake B:Predictors of perceived health status of tuberculosis-infected homeless.West J Nurs Res2005,27:896–910. 28. Guo N, Marra CA, Marra F, Moadebi S, Elwood RK, Fitzgerald JM:Health
state utilities in latent and active tuberculosis.Value Health2008, 11:1154–1161.
29. Chamla D:The assessment of patients’health-related quality of life during tuberculosis treatment in Wuhan, China.Int J Tuberc Lung Dis 2004,8:1100–1106.
30. Department of Health:Tuberculosis strategic plan for South Africa 2007–2011. Pretoria: Government Printers; 2007.
31. World Health Organisation (WHO):Global TB control report 2011. Geneva: WHO; 2011.
doi:10.1186/1477-7525-10-77