Person-Organisational Fit:
A Revised Structural Configuration
Anton Grobler, Ph.D., University of South Africa (UNISA), South AfricaABSTRACT
An empirical study was conducted into the structural configuration of person -organisational fit (P-O fit), me a su re d by the P-O fit questionnaire. The data from three independent studies (a total of 4 388 respondents) was analysed and consistent results across the three studies were reported. The exploratory factor analysis yielded a two factor model with acceptable psychometric properties. The factors names were based on previous literature, namely Supplementary fit (person-organisational fit, indirect fit and value congruence) and Complementary fit (combination of demands-ability and needs-supply fit) perceptions. The two factor model was further tested for construct validity (discriminant and convergent validity) and was found to be valid. The findings could be used a s a foundation for future studies as they provide an empirically refined conceptualisation and measurement of fit perceptions which is theoretically supported. An accurate measure of P -O fit could be used to mak e better predictions of individual’s work attitudes and behaviour.
Keywor ds: Person-Organisational Fit; Need-Supply Fit; Value Congruence; Complementary Fit; Supplementary Fit
INTRODUCTION
“Happiness does not come from a job. It comes from knowing what you truly value, and behaving in a way that’s consistent with those beliefs.” Mike Rowe
“Your work is going to fill a large part of your life, and the only way to be truly satisfied is to do what you believe is great work. And the only way to do great work is to love what you do.” Steve Jobs
ottinghaus and Van Esbroeck (2011) postulate that behaviour is determined by the interaction between the individual and the situation. Person -organisational fit (P-O fit) is a typically interactionist concept, describing as it does the interaction between the individual and the work or organisation concerned. Human beings possess the unique psychological ability to self-reflect – that is, they have the capacity fo r introspection or reflexive consciousness (Hartung & Subich 2011; Vondracek & Porfeli 2007) – and they are also able to apply this in respect of their work and of the fit that exists between the individual and the organisation. Based on this “fit perception”, individuals choose a specific organisation to work for, or they use it as a determinant fo r their decisions to remain in their existing organisations. Lee and Mitchell (1994:58) refer to value image (as well as strategic and trajectory image) as a very important component of fit in an organisation. They describe value image as “a set of general values, standards and individual principles that defines a person”. They further emphasise that an individual constantly screens his or her environment (in this case the work or organisation concerned) to evaluate the kind of dissimilarity (incompatibility) between the characteristics of the environment and the private criteria of the individual. This is consistent with Hartung and Subich (2011), Rottinghaus and Van Esbroeck (2011) as well as Vondracek and Porfeli’s (2007) view that human beings possess the unique psychological capacity to self-reflect (through introspection or reflexive consciousness) based on their continuous and conscious scanning of their environment, including their work environment.
variables (person-organisation), or congruence between the individual and the equivalent characteristics of t he organisation, will, to a large extent, determine the individual’s reaction or behaviour in the workplace.
The purpose and contribution of this research is to refine the conceptualisation and measurement of P -O fit perception(s), by linking it to existing theory and literature and to test the concept empirically in order to make better predictions of employees’ work attitudes and behaviour.
This research is necessitated by the uncertainty about the structural configuration of the P -O fit construct, as some scholars view it as a two dimensional construct (with different structural permutations) and some as a three dimensional construct. As this research is concentrated mainly on the conceptualisation and measurement of P -O fit, it does not focus on the relationship that P-O fit has with individual work attitudes and behaviour. Some of these attitudinal and behavioural constructs are, however, incorporated into the research to determine the construct validity of the instrument. A discussion on the different configurations of fit perceptions and opinions by the respective scholars will follow.
THE CONSTRUCT “PERSON-ORGANISATIONAL FIT”
Defining P-O fit
Kristof-Brown (1996) compiled much of the pre-1996 P-O fit literature in an attempt to make sense of this elusive construct. Based on the literature review, Kristof-Brown (1996) proposed an integrated definition of fit that encompasses both complementary/supplementary and demands abilities/ need -supplies fit theories to create a more comprehensive conceptualisation of overall P-O fit. Kristof-Brown’s (1996) definition was unquestionably a necessary first step to fully understanding the relation, or fit, between the organisation and its employees (Ambrose, Arnaud & Schminke 2008). The overarching and most straightforward definition of overall P-O fit provided by Kristof-Brown (1996:4–5) is ‘‘the compatibility between people (employees) and organisations that occurs when (a) at least one entity provides what the other needs, or (b) they share similar fundamental characteristics, or (c) both’’. This definition is echoed by Kristof-Brown, Zimmerman and Johnson (2005), while Mitchell, Holtom, Lee, Sablynski, and Erez (2001:1 104) summarise it by defining overall P-O fit as “an employee’s perceived compatibility or comfort with an organisation”.
In order to establish and enhance perceived fit between the organisation and the employee, an employee’s personal values, career goals and plans for the future must converge with the larger corporate culture and the demands of his or her job. Person-organisation perceived fit (sub-dimension - on subjective level) thus takes place when the organisation fulfils the employee’s needs in terms of congruence between the employee’s personal values and those of the organisation. On the other hand, according to Kristof-Brown (1996) and from an abilities -demands perspective, there is congruence between person and organisation when the employee possesses and demonstrates the abilities necessary to meet organisational demands. Edward s (1991) brings these two perspectives together, suggesting that needs and abilities compose the “person” angle, and supplies and demands the “job” angle of overall P-O fit research. He describes “needs” in terms of employee’s desires, goals, values, interests and preferences, and “abilities” in terms of aptitudes, experience and education.
Further to that, Liu, Liu and Hu (2010:616) also add that, based on the widely -accepted definition by Kristof-Brown (1996), there are three components of overall P-O fit. The first is similarity between employees’ personalities and the characteristics of the organisation, the second is compatibility of goals between employees and the organisation and the third is consistency between employees’ values and the organisation al culture.
Structural Configuration of P-O Fit
subjective fit (e.g. value congruence) will most probably be more associated with the supplementary fit of Cable and Edwards (2004) and person-organisational fit (sub-dimension, on subjective level or indirect fit) as suggested by Cable and DeRue (2002) in the development of the P-O fit scale. Cable and DeRue (2002:876) state that person-organisational fit (sub-dimension - on subjective level) occurs when “employees believe that their values match an organisation’s values and the values of other employees in the organisation, they should feel involved with the broader mission of the organisation”. Similarly, Ruiz-Palomino, Martinez-Cañas and Fontrodona (2013:175) define person-organisational fit (sub-dimension - on subjective level) as “the degree of congruence between employee and organisational beliefs, norms, values and goals”.
Objective fit, on the other hand, would be associated with the compleme ntary fit (e.g. congruence of skills confirmed through performance assessments, adherence to the employment contract in terms of remuneration and rewards received for services rendered by the employee, etc.) (Grobler 2014). It seems thus that this fit perc eption type consists of two components, namely person -job fit (which is basically the congruence between the individual’s skills and abilities and the demands of the job or the organisation) and needs -supply fit (the perceived congruence between the rewards individuals receive for their services and contribution).
It seems, therefore, that overall P-O fit comprises of two or three broad fit perceptions (structural configurations). The three fit perception configuration would include the person -organisational fit perception (sub-dimension), also referred to as value congruence, indirect fit and subjective fit by scholars like Cable and Judge (1996), Cable and DeRue (2002), Grobler (2014) as well as Kristof-Brown and Jansen (2007). The second fit perception o f the three fit perception configuration is that of person-job fit or demand-ability fit (Cable & Judge, 1996; Kristof-Brown, 2000) and is followed by the third fit perception of needs -supplies fit or direct fit (Cable & DeRue 2002).
The initial two fit perception configuration of Muchinsky and Monahan (1987), supported by Cable and Edwards (2004), includes all three of the above-mentioned fit perceptions, with supplementary fit being exactly the same as person-organisational fit (sub-dimension - on subjective level), but with complementary fit being a combination of person-job fit and needs -supplies fit or direct fit. Cable and Edwards (2004) combine thus the three P-O fit perceptions into complementary and supplementary fit. They articulate the theoretic al underpinnings of the two traditions, using psychological need fulfilment and value congruence as prototypes of each tradition.
Supplementary fit occurs when a person "supplements, embellishes, or possesses characteristics which are similar to other individuals" in an environment (Muchinsky & Monahan 1987:269; Zepp & Kleinert 2014:2). It further occurs “when a person and an organisation possess similar or matching fundamental characteristics” (Arbour, Kwantes, Kraft & Boglarsky (2014:43). They argue that supplementary fit would be high if both the individual employee and the organisation possessed and endorsed the same values, such as autonomy or creativity.
Contrariwise, complementary fit “occurs when a person's characteristics ‘make whole’ the enviro nment or add to it what is missing” (Muchinsky & Monahan 1987:271). In addition, complementary fit exists when “one entity possesses characteristics that the other wants or needs” Arbour et al (2014:43). It further refers “to an environment as either being deficient in or requiring a certain type of person in order to be effective” (Zepp & Kleinert 2014:2).
To summarise, regardless of the structural configuration of overall P-O fit, it can be defined as “the compatibility (congruence) between individuals and organisations” Clercq, Fontaine and Anseel (2008:277). It is cued by the perceptions of the individual (employee) and not necessarily the situation (reality) itself, as explained by the fluid, bidirectional and interactionist nature of P-O fit (Grobler 2014). This congruence between the employee and the organisation (on all fit perception levels) is evaluated on a continuous basis through the scanning of the environment, self-reflection and self-exploration.
Outcomes of P-O Fit
performance, career satisfaction, turnover intention and contextual perfo rmance) has been researched extensively by a number of scholars, including Arthur, Bell, Villado and Doverspike (2006), Cable and DeRue (2002), Cable and Judge (1996,1997), Garavan (2007), Judge and Cable (1997), Kristof-Brown (2000) Kristof-Brown et al (2005), Meyer, Hecht and Toplonytsky (2010) and Saks and Ashforth (1997). All the studies report strong relationships between P-O fit (and its components/dimensions) and these organisational behaviour and work attitudinal constructs.
MEASUREMENT OF PERSON-ORGANISATIONAL FIT
A scale developed by Cable and DeRue (2002), consisting of a three fit perception configuration and nine items was used. The three constructs (fit perceptions) measured are indirect fit (person -organisation fit as values congruence), direct fit (needs-supplies fit) and person-job fit (demands -abilities fit). The instrument uses a five-point Likert scale, ranging from “strongly disagree” (1) to “strongly agree” (5). The maximum score is 45 and the minimum nine. A high score presents a very high level of person-organisation fit on all three elements and a low score represents an individual who strongly feels that there is a low level of fit between him or her and the organisation.
The measure of perceived fit was based on conceptualisations of past research (Cable & Judge, 1996, 1997; Chatman, 1991; Lauver & Kristof-Brown, 2001) that has defined indirect fit (person–organisation fit) as values congruence. The three items of indirect fit are: [PoF1] “The things that I value in life are very s imilar to the things that my organisation values”; [PoF2] “My personal values match my organisation’s values and culture”, and [PoF3] “My organisation’s values and culture provide a good fit with the things that I value in life”. The Cronbach alpha reliability coefficient of this dimension (indirect fit or person –organisation fit) of the scale was .91 in a single organisation sample and .92 in a multiple organisational sample.
The direct fit (needs –supplies fit) measure was based on the conceptualisations offered by Kristof-Brown (1996) and Edwards (1991). The items associated with direct fit are: [PoF4] “There is a good fit between what my job offers me and what I am looking for in a job”; [PoF5] “The attributes that I look for in a job are fulfilled very well by my present job”, and [PoF6] “The job that I currently hold gives me just about everything that I want from a job”. The Cronbach alpha reliability coefficient of direct fit (needs –supplies fit) was .89 in a single organisation sample and .93 in a multiple organisational sample.
The person-job fit (demands –abilities fit) measure was based on conceptualisations of past research by Cable and Judge (1996). The items of person-job fit are: [PoF7] “The match is very good between the demands of my job and my personal skills”; [PoF8] “My abilities and training are a good fit with the requirements of my job”, and [PoF9] “My personal abilities and education provide a good match with the demands that my job places on me”. The Cronbach alpha reliability coefficient of person -job fit (demands –abilities fit) was .89 in a single organisation sample and .84 in a multiple organisational sample.
RESEARCH DESIGN
Research Approach
This study employed a typical empirical paradigm using a cross -sectional design and quantitative analysis. Surveys were used as data generation technique. Leedy and Ormrod (2014) highlight the fact that a cross -sectional design involves sampling and enables the researcher to collect the required data at the same time.
climate (institutional health) measurement mandated by the Management Committee of the institution. It was carried out in collaboration with the UNISA Bureau of Market Research (BMR), and ethical clearance was obtained from the BMR Research Ethics Review Committee on 11 May 2015 (reference number: IR089).
Research Participants
The population (N) of studies 1 and 2 consisted of employees of 34 and 21 organisations respectively, with 60 employees per organisation selected randomly by the participating co -researchers. The population of study 3 was the total workforce (±4 200 employees) of the Higher Education institution. The characteristics of the participants in terms of the three relevant demographical variables, namely sector, race and gender, are reported in Table 1(i).
Table 1 (i). Frequencies of the characteristics of the sample (n = 4 388)
S tudy 1 S tudy 2 S tudy 3 Combined
Category n % n % n % n %
Sector (N=4 388)
Private 1 436 70.6 1 020 81.0 - - 2 456 55.97 Public 419 20.6 240 19.0 - - 659 15.02 SOE 179 8.8 - - - - 179 4.08 Academic - - - - 1 094 100.0 1 094 24.93 Race
(N=3 954)
African 1 070 53.3 603 50.2 369 49.66 2 042 51.64 Coloured 175 8.6 96 8.0 27 3.63 298 7.54 White 481 23.6 374 31.1 315 42.40 1 170 29.59 Indian 283 13.9 129 10.7 32 4.31 444 11.23 Gender
(N=3 911)
M ale 1 051 52.1 704 58.1 272 38.3 2 026 51.80 Female 939 47.9 507 41.9 438 61.7 1 884 48.17
With Study 1: Leadership research project; Study 2: Ethics research project, and Study 3: Research project in a Higher Education institution
The total sample consists of 4 388 participants, with the Leadership research project with the largest representation of 2 034 in 34 companies (46.35% of the total sample), followed by the Ethics research project (1 260 respondents in 21 companies) with 28.71%, and the research project in the Higher Education institution (1 094 respondents) with 24.93% of the total sample.
With regard to the multi-organisational studies (studies 1 and 2), close to 56% (2 456) of the respondents were from the private sector, with 15% (659) from the public sector and 4% from state -owned enterprises (SOE). In terms of the racial distribution, the majority of the participants were African (51.64%), followed by White (29.59%), Indian (11.23%) and Coloured (7.54%). The representation of the gender groups was slightly higher for males at 51.8% compared to 48.17% for females. The racial and gender distribution of the sample seems to be representative of the South African workforce in general.
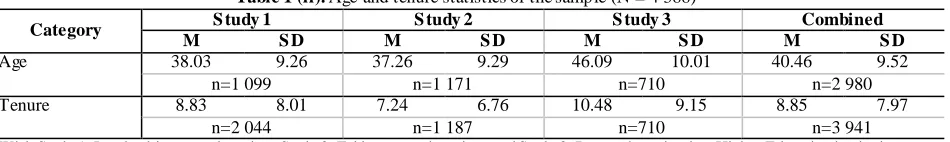
The characteristics of the participants in terms of the mean age as well as the mean tenure, both in years, are reported in Table 1(ii).
Table 1 (ii). Age and tenure statistics of the sample (N = 4 388)
Category S tudy 1 S tudy 2 S tudy 3 Combined
M S D M S D M S D M S D
Age 38.03 9.26 37.26 9.29 46.09 10.01 40.46 9.52 n=1 099 n=1 171 n=710 n=2 980 Tenure 8.83 8.01 7.24 6.76 10.48 9.15 8.85 7.97
n=2 044 n=1 187 n=710 n=3 941
With Study 1: Leadership research project; Study 2: Ethics research project, and Study 3: Research project in a Higher Education institution
Statistical Analysis
The statistical analysis was conducted with the use of Statistical Package for the Social Sciences (SPSS), version 23. To determine the most appropriate factor structure for the P-O fit scale, exploratory factor analysis was conducted, which is a common technique used for scale or test development and evaluation. The intention with the factor analysis was to reduce the number of variables to a smaller subset of variables based on variability in the patterns of correlations (Pallant 2013). To aid in the interpretation of the initial results, an oblique rotation – specifically Promax rotation – was performed. The decision regarding the number of variables (factors) to be retained was based on the Guttman-Kaiser eigenvalue greater-than-one rule (K1 rule), together with the scree plot (with specific reference to the shape of the curve) and lastly the Monte Carlo PCA for parallel analysis.
A very important criterion when deciding on the use of factor analysis is the number of respondent s as well as the ratio between items and respondents (Hair, Black, Babin & Anderson 2010). The general opinion of Meyers, Gamst and Guarino (2013) is that the number of respondents should not be fewer than 200. Hair et al. (2010) regard five items per respondent as the lower limit. Both Hair et al. (2010) and Meyers et al. (2013) indicate that the decision on the cut-off value of the factor loading should also be based on sample size, with minimum loading of .4 to .5.
Cronbach’s alpha coefficients were used to determine the reliability of the constructs measured in the P-O fit scale. Cronbach’s alpha determines the internal consistency of a test or scale and is articulated as a number between 0 and 1 with adequate measuring values ranging from .70 to .95 (Tabachnick & Fidel, 2007).
The validity of the P-O fit scale was also established provided the various definitions and types of validity. Cohen, Swerdlik and Sturman (2013) are of the opinion that validity is, in short, an estimation of how well a test mea sures what it is intended to measure. For the purposes of this paper, the main focus will be on construct validity which is an estimate of how the construct (which is intended to be measured), behaves in relation to other constructs and related measures (DeVellis, 2012). Thus, “to evaluate the construct validity of a test, we must amass a variety of evidence from numerous sources” (Gregory 2011:119). An additional rigorous test of construct validity is the so -called factorial validity which is based on the results of factor analysis, with the primary purpose of defining the underlying structure among the variables included in the analysis (Hair et al 2010). When the instrument internally displays the expected structure, this could be indicative of construct validity (Moerdyk, 2015) and, specifically, factorial validity.
A further test of construct validity, namely convergent and discriminant validity, was used to determine the correlation between the constructs measured by the target instrument and those of other, similar, tests or measures (Cohen et al 2013:199). Information on convergent validity was created by calculating the correlation between the P-O fit scale (and its components/factors) and several other measures. It was hypothesised (supported by pr evious studies and literature) that P-O fit would correlate significantly with employee engagement, job satisfaction, psychological contract, organisational citizenship behaviour, trust, compensation, perceived leadership effectiveness and, lastly, turnover intention. A correlation of .5 would be seen as a clear sign of convergence, following Gregory’s (2011) example, and a non-significant correlation as evidence of discriminate validity, relying on Cohen et al (2013). However, for the purposes of this study, discriminate validity was not the concern.
A similar approach to that of Cable and De Rue (2002) was followed to determine discriminant validity, namely by means of multiple regression. The identified factors (P-O fit perceptions) will be used as independent (or predictor) variables, with the work attitudinal and organisational behaviour constructs, such as employee engagement, organisational commitment, turnover intention and so on as dependant variables. The rationale is to inspect the beta values, and to determine whether discriminant validity exists through the unique contribution of the P -O fit factors (perceptions) when the beta values are inspected.
RESULTS
univariate and multivariate assumption violations. From the initial assessment, all variables were found to be interval-like, variable pairs appeared to be bivariate, were normally distributed, and all cases were independent of one another.
The relatively large sample sizes contributed to adequate variable-to-case ratios (226:1; 140:1 and 122:1 respectively). As part of the process to determine factorial validity, the Kaiser-Meyer-Olkin measure of sampling adequacy and the Bartlett’s test of sphericity were performed on the data of all three studies. The rationale for this procedure was to determine the suitability of performing a factor analysis; the results are reported in Table 2.
Table 2. Kaiser-M eyer-Olkin measure of sampling adequacy and Bartlett’s test of sphericity
S tudy 1 S tudy 2 S tudy 3 Kaiser-Meyer-Olkin Measure of S ampling Adequacy .88 .86 .86
Bartlett's Test of Sphericity
Approx. Chi-square 12 841.85 7 148.23 7 365.75
df 36 36 36
Sig. <.001 <.001 <.001
With Study 1: Leadership research project; Study 2: Ethics research project, and Study 3: Research project in a Higher Education institution
The Kaiser-Meyer-Olkin measure of sampling adequacy was performed and the values were .88 for study 1 and .86 for studies 2 and 3 respectively, exceeding the critical value of .6 (Tabachnick & Fidell, 2007) and thus supporting the strategy to perform an exploratory factor analysis. The Bartlett's test of sphericity was also conducted a nd the approximate chi-square values of 12 841.85, 7 148.23 and 7 365.75 were reported respectively (degrees of freedom = 36). All Chi-square values were significant at a level smaller than .001, indicating sufficient correlation between the variables to proceed with the exploratory factor analysis.
The Guttman-Kaiser eigenvalue greater-than-one rule (K1 rule) was used in conjunction with the scree plot to determine the number of factors (fit perceptions). The results of the Kaiser’s criterion for each of the studies independently are reported in Table 3.
Table 3. Eigenvalues larger than one and explanation of variance
# Initial Eigen Values Extraction sums of squared loadings Rotation sums of squared loadings S tudy1: Leadership research project
Total % of Variance Cumulative % Total % of Variance Cumulative % Total
1 5.20 57.82 57.82 5.20 57.82 57.82 4.65 2 1.39 15.43 73.24 1.39 15.43 73.24 4.01
S tudy2: Ethics research project
Total % of Variance Cumulative % Total % of Variance Cumulative % Total
1 4.86 54.02 54.02 4.86 54.02 54.02 4.35 2 1.46 16.20 70.22 1.46 16.20 70.22 3.68
S tudy3: Research project in a Higher Education institution
Total % of Variance Cumulative % Total % of Variance Cumulative % Total
1 5.08 56.44 56.44 5.08 56.44 56.44 4.52 2 1.80 19.98 76.42 1.80 19.98 76.42 3.80
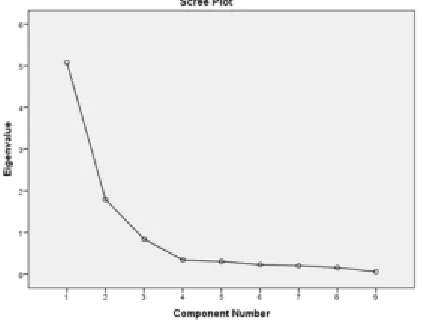
Figure 1. Cattell’s scree plots
It is evident in all three figures that the elbow flattens off after the fourth component (factor). Pallant (2013) indicates that the scree plot as well as the K1 rule are often regarded as being too conservative as measures to determine the exact number of factors. Subsequently, a further technique, namely the Monte Carlo parallel analysis simulation technique, was performed. The purpose of the Monte Carlo parallel analysis is to determine the number of factors that account for more variance than the components derived from random data. The eigenvalues obtained from the actual data are compared to the eigenvalues obtained from the random data. If the actual eigenvalues from the principal component analysis of the actual data are greater than the eigenvalues from the random data, the component (factor) is retained. Four components (although only two components reported eigenvalues larger than one) were included in the Monte Carlo parallel analysis to test the assumption of a four component (factor) solution, as suggested by the interpretation of the shape of the scree plots. The results are reported in Table 4.
S tudy 1: Leadership research project S tudy 2: Ethics research project
Table 4. Results of the M onte Carlo parallel analysis
Component
number Actual eigenvalues from PCA
Criterion value
from parallel analysis Decision
S 1 S 2 S 3 S 1 S 2 S 3 S 1 S 2 S 3
1 5.20 4.86 5.08 1.10 1.13 1.14 accept accept accept 2 1.39 1.46 1.80 1.07 1.09 1.09 accept accept accept 3 .81 .96 .84 1.04 1.06 1.05 reject reject reject 4 .38 .42 .34 1.02 1.03 1.03 reject reject reject
With S1= Study 1: Leadership research project; S2= Study 2: Ethics research project, and S3= Study 3: Research project in a Higher Education institution
The results of the Monte Carlo parallel analysis yielded a two -component (factor) model. The two components accounted for ±73% of the total variance in P-O fit across the three studies (see Table 3). The results of the correlational analysis (Pearson correlation) between the two retained components, from now on referred to as factors (P-O fit perceptions), are reported in Table 5.
Table 5. Correlations (pearson) between extracted factors (fit perceptions)
S tudy 1 S tudy 2 S tudy 3 Mean correlation
F1 F2 F1 F2 F1 F2 F1 F2
F1 1 .55** 1 .52** 1 .46** 1 .51** F2 .55** 1 .52** 1 .46** 1 .51** 1
**. Correlation is significant at the .01 level (2-tailed).
With Study1: Leadership research project; Study2: Ethics research project; Study3: Research project in a Higher Education institution
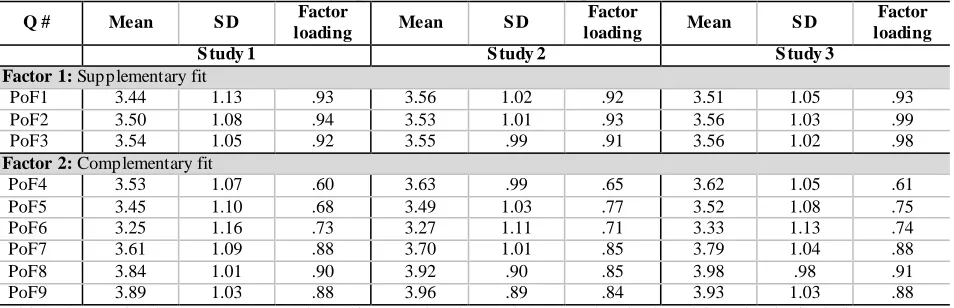
The correlations between the pairs of factors (fit perceptions) were larger than .4 (between .46 and .55, with an average correlation of .51). The structure coefficients from the Promax rotation are reported in Table 6.
Table 6. Factor loadings (promax rotation) and the descriptive statistics of the items
Q # Mean S D Factor
loading Mean S D
Factor
loading Mean S D
Factor loading
S tudy 1 S tudy 2 S tudy 3
Factor 1: Supplementary fit
PoF1 3.44 1.13 .93 3.56 1.02 .92 3.51 1.05 .93 PoF2 3.50 1.08 .94 3.53 1.01 .93 3.56 1.03 .99 PoF3 3.54 1.05 .92 3.55 .99 .91 3.56 1.02 .98
Factor 2: Complementary fit
PoF4 3.53 1.07 .60 3.63 .99 .65 3.62 1.05 .61 PoF5 3.45 1.10 .68 3.49 1.03 .77 3.52 1.08 .75 PoF6 3.25 1.16 .73 3.27 1.11 .71 3.33 1.13 .74 PoF7 3.61 1.09 .88 3.70 1.01 .85 3.79 1.04 .88 PoF8 3.84 1.01 .90 3.92 .90 .85 3.98 .98 .91 PoF9 3.89 1.03 .88 3.96 .89 .84 3.93 1.03 .88
With Study1: Leadership research project; Study2: Ethics research project; Study3: Research project in a Higher Education institution
The descriptive statistics as well as the internal consistency of each of the factors (fit perceptions) as assessed by coefficient Cronbach alpha are reported in Table 7.
Table 7. Descriptive statistics, cronbach’s alpha coefficient of the factors (fit perceptions) of the p -o fit scale
S tudy 1 S tudy 2 S tudy 3 Combined
F1 F2 F1 F2 F1 F2 F1 F2
M ean 3.49 3.60 3.55 3.66 3.54 3.73 3.53 3.66 SD .99 .88 .92 .79 1.0 .83 .97 .83 Skewness -.52 -.64 -.69 -.68 -.74 -.76 -.65 -.68 Kurtosis -.33 .12 .03 .51 .23 .48 -.02 .37 α .91 .90 .90 .88 .96 .90 .92 .89
With Study1: Leadership research project; Study2: Ethics research project; Study3: Research project in a Higher Educ a tio n in stitutio n; F1 : Supplementary fit and F2: Complementary fit perceptions
The descriptive statistics in Table 7 show that both the factors Supplementary and Complementary fit perceptions reported relatively high mean scores (on a 5-point Likert scale), with the Complementary fit perception reporting slightly higher mean scores. The skewness and kurtosis values for both the factors do not exceed the critical values of 2.00 and 7.00 respectively (West, Finch & Curran 1995), which is an indication that the data is normally distributed. Both the factors reported negative values on th e skewness scale, with the skewness values ranging between -.76 (Complementary fit perception in study 3) and -.52 (Supplementary fit perception in study 1) with a mean skewness value of -.68 for the three studies. This is an indication that the distribution has relatively few small values and tails off to the left. Complementary fit perception reported lower kurtosis values (even negative in studies 1 and 3) than did Supplementary fit perception, with a mean kurtosis value of -.02 across the three studies. The Cronbach’s alpha coefficients of the factors are acceptable if the guideline of >.70 (Nunnally & Bernstein 1994) is applied. It would thus appear that the factors (fit perceptions) possess acceptable levels of internal consistency across all three studies, with a mean Cronbach alpha coefficient of .89.
Table 8. Convergant validity of supplementary and complementary fit perceptions by means of correlations (pearson) with other related measures
S tudy 1 S tudy 2 S tudy 3
F1 F2 F1 F2 F1 F2
EE .45** .60** .42** .62** - - JS .43** .60** .44** .61** - - PsC .38** .42** .40** .43** - - OCB - - .26** .30** .58** .38** OC - - .49** .50** - -
Tr .55** .48** - -
C - - - - .35** .43** PLe - - - - .67** .43** Ti -.39** -.51** -.42** -.51** -.28** -.52**
**. Correlation is significant at the .01 level (2-tailed).
With Study1: Leadership research project; Study2: Ethics research project; Study3: Research project in a Higher Educ a tio n in s titutio n; F1 : Supplementary fit and F2: Complementary fit perceptions
Note: EE = Employee engagement; JS = Job satisfaction; PsC = Psychological contract; OCB = Organisational citizensh ip be h a vio ur ; O C = Organisational commitment; T r = T rust; C = Compensation; PLe = Perceived leadership effectiveness, and T i = T urnover intention
It was hypothesised that both the Supplementary fit and Complementary fit perceptions would correlate significantly with Employee engagement, Job satisfaction, Psychological contract, Organisational citizenship behaviour, Organisational commitment, Trust, Compensation, Perceived leadership effectiveness and Turnover intention. The analysis indeed reported significant positive correlations between the P-O fit perceptions (Supplementary fit and Complementary fit) and all the above-mentioned constructs, but a significant, negative correlation with Turnover intention. From Table 8 above, it can be read that Complementary fit perception does correlate more closely with Employee engagement and Job satisfaction in study 1 (EE: r=.60, r=.45; JS: r=.62, r=.42) and st udy 2 (EE: r=.60, r=.43; JS: r=.61, r=.44) respectively than does Supplementary fit perception. The Supplementary fit perception, on the other hand, shows higher correlation with Trust (study 2) (r=.55, r=.48) and Perceived leadership effectiveness (study 3) (r=.67, r=.43) than with Complementary fit perception. The Complementary fit perception reported higher negative correlations (r=-.51, r=-.-51; r=-.53) with Turnover intention in all three studies than did the Supplementary fit perception (r=-.39, r=-.-42; r=-.28) . The majority of the correlations reported in Table 8 can be classified as “hefty” correlations, as they surpass the margin of .5 (Gregory, 2011). All the correlations however, with exception of the correlation between the Supplementary fit perception and Organisational citizenship behaviour (.26 in study 2) met the .3 thresholds Cohen (1988) set for a medium effect. This is a true indication that convergent validity exists.
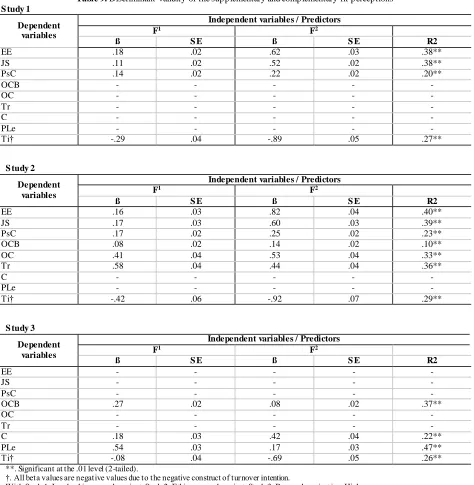
Table 9. Discriminant validity of the supplementary and complementary fit perceptions
S tudy 1
Dependent variables
Independent variables / Predictors
F1 F2
ß S E ß S E R2
EE .18 .02 .62 .03 .38** JS .11 .02 .52 .02 .38** PsC .14 .02 .22 .02 .20**
OCB - - - - -
OC - - - - -
Tr - - - - -
C - - - - -
PLe - - - - -
Ti† -.29 .04 -.89 .05 .27**
S tudy 2
Dependent variables
Independent variables / Predictors
F1 F2
ß S E ß S E R2
EE .16 .03 .82 .04 .40** JS .17 .03 .60 .03 .39** PsC .17 .02 .25 .02 .23** OCB .08 .02 .14 .02 .10** OC .41 .04 .53 .04 .33** Tr .58 .04 .44 .04 .36**
C - - - - -
PLe - - - - -
Ti† -.42 .06 -.92 .07 .29**
S tudy 3
Dependent variables
Independent variables / Predictors
F1 F2
ß S E ß S E R2
EE - - - - -
JS - - - - -
PsC - - - - -
OCB .27 .02 .08 .02 .37**
OC - - - - -
Tr - - - - -
C .18 .03 .42 .04 .22** PLe .54 .03 .17 .03 .47** Ti† -.08 .04 -.69 .05 .26**
**. Significant at the .01 level (2-tailed).
†. All beta values are negative values due to the negative construct of turnover intention.
With Study1: Leadership research project; Study2: Ethics research project; Study3: Research project in a Higher Education institution; F1: Supplementary fit and F2: Complementary fit perceptions
Note : EE = Employee engagement; JS = Job satisfaction; PsC = Psychological contract; OCB = Organisational citizenship behaviour; OC = Organisational commitment; Tr = Trust; C = Compensation; PLe = Perceived leadership effectiveness, and Ti = T urnover intention
(ß=-.89 and ß=-.29; ß=-.92 and ß=-.42; ß=-.69 and ß=-.08 for the three studies respectively). The beta values were slightly higher for Complementary fit on Psychological contract, Organisational commitment compared to Supplementary fit.
The only variables where the Supplementary fit perception reported higher beta values than Complementary fit perception were Organisational citizenship behaviour (study 3) (ß=.27 and ß=.08), Trust (study 2) (ß=.58 and ß=.44) and Perceived leadership effectiveness (ß=.54 and ß=.17) (study 3). The results reflected in Table 9 support the notion of discriminant validity, as the two P-O fit perceptions (Supplementary fit and Complementary fit) contribute uniquely to the multiple regression models in terms of the variance accounted for in the dependent variables, if the magnitude of beta values are compared.
DISCUSSION OF RESULTS
This study comprises three independent studies, with 2 034, 1 260 and 1 094 respondents respectively. All the analyses were conducted on the three studies independently, and the results across the studies were consistent. The first set of analytics performed was to determine the suitability of an exploratory factor analysis on the data. Both the Kaiser-Meyer-Olkin measure of sampling adequacy as well as the Bartlett’s test of sphericity have supported the strategy to perform an exploratory factor analysis to determine the factor structure of the P-O fit scale developed by Cable and DeRue (2002). The Guttman-Kaiser eigenvalue greater-than-one (K1 rule) was performed, resulting in two components (accounting for ± 73% variance) reporting greater-than-one eigenvalues. To support this finding, the scree plots of the three studies were also inspected, with the break in the elbow (in accordance with the so -called elbow rule) after the fourth component. Four components were included in the Monte Carlo parallel analys is test, but only a two factor solution was confirmed, with the other two factors being rejected.The two factors, named Supplementary fit (which is the same as Cable and DeRue’s (2002) indirect fit, or person -organisational fit –sub-dimension/value congruence) and Supplementary fit which is a combination of the person -job fit (demand-ability fit) and direct fit (needs -supply fit). The Supplementary fit perception consists of three items with the Supplementary fit perception consisting of six items. Both factors reported acceptable psychometric properties in terms of the distribution of the scores on the constructs (skewness and kurtosis values), as well as the internal consistency of the items (Cronbach alpha reliability coefficients) across all three of the studies.
The new factor structure, which complements previous work of scholars such as Arbour et al (1984), Cable and Edwards (2004), Grobler (2014), Kristof-Brown and Jansen (2007) and Muchinsky and Monahan (1987) was exposed to a rigorous investigation for construct validity. Firstly, the factorial validity was confirmed through the exploratory factor analysis explained above and, secondly, the factor structure was scrutinised for convergent validity. This was based on the hypothesised relationship (based on various previous studies) between P-O fit and, in this instance, Supplementary fit and Complementary fit with work attitudinal and organisational behaviour constructs such as Employee engagement, Job satisfaction, Psychological contract, Organisatio nal citizenship behaviour, Organisational commitment, Trust, Compensation, Perceived leadership effectiveness and Turnover intention. Convergent validity was confirmed through the reporting of many high correlations between the P -O fit constructs and the related measures (Pearson correlations of above .5) The third construct validity measure performed was that of discriminant validity. This was done through a basic multiple regression with all the work attitudinal and organisational behaviour constructs lis ted above included (separately) as dependent variables and t h e P-O fit perceptions (Supplementary fit and Complementary fit) as independent or predictor variables. The results showed a large degree of uniqueness in terms of the contribution of the respective P-O fit perceptions in the accounting and explanation of the variance in the dependent variables, supporting the notion of discriminant validity.
The instrument and its new/adapted structural configuration were found to be valid and reliable.
CONCLUSION, LIMITATIONS AND RECOMMENDATIONS
large extent, determine the quality of the relationship and of the decisions made by the employees and by the organisation.
The purpose of this research was to provide an accurate measurement of P-O fit, in order for HR practitioners, OD consultants and, ultimately, managers to determine the extent of the perceived fit between the employees and the organisation. Literature, supported by this research, indicates that Cable and DeRue (2002) were correct in adding a third dimension of needs -supply fit to P-O fit with the original notion that overall P-O fit consists of two fit perceptions, namely person-organisation fit (through value congruence) and person-job fit (demand-ability fit).
All three of these fit perceptions, as proposed by Cable and Judge (2002), are included in the new factor structure that has been proven as reliable and valid. The structural configurations are just slig htly different, with Supplementary fit being the Indirect fit factor or person -organisation fit perception (sub-dimension - on subjective level) of Cable and DeRue (2002), and Complementary fit which is a composite factor consisting of the original Direct fit (needs-supplies fit) and Person job fit (demands -ability fit) factors of Cable and DeRue (2002).
Collectively, these fit perceptions support the general definition of P-O fit set out by Kristof-Brown (1996) which refers to the compatibility of employees and organisations as being based on the demand (one entity provides what the other needs) and supply of services and the subsequent reward or compensation for services and/or they share similar fundamental characteristics.
Supplementary fit can be defined as a subjective, value congruence perception, through the matching of similar, fundamental characteristics and the endorsement of the same values through psychological relatedness. It is mainly centred around the relationship between the employee and t he organisation.
Complementary fit can be defined as an objective determination of congruence, based on psychological need -fulfilment, where one entity possesses characteristics (competence, skills of the employee and financial reward and acknowledgement by the organisation) that the other wants or needs in order to be effective. It is mainly tied to a specific job.
This research has certain limitations, mainly in terms of the methodology. The P-O fit scale is based on self-reporting that may lead to method bias which might still be a reality, even with the assurance provided to participants during the briefing regarding anonymity as well confidentiality. Social desirability and subsequent response bias will always remain a concern and a limitation in stud ies such as this one. Self-reporting – and specifically reporting of perceived fit (with no measure to determine the actual fit) – may be seen as a one-sided report from the employees’ side. A further possible limitation, is that the wording of the initial scale was used as is, without adapting it to the South African (multi-lingual) context.
The results of this study should be further analysed with the possible addition of the effect of membership of specific demographic groups (e.g. generational differences) and the determination of the antecedents and consequences of P-O fit on work attitudes and organisational behaviour.
In conclusion, this study could serve as a reference for the accurate measurement of P-O fit. This is seen as the major contribution of the study. Based on the results obtained, it seems that the P-O fit scale is a suitable (valid and reliable) instrument for measuring P-O fit. It might even be considered for administration on a frequent basis during institutional research such as organisational climate studies and the scientific and diagnostic feedback used for interventions in organisations to enhance P-O fit. The accurate measurement of P-O fit is of the utmost importance to develop and implement targeted interventions to enhance th e perceived fit between employees and the organisation. This is even more relevant today, due to the increasing “war for and retention of talent”, convoluted by the diversity, and in particular the generational differences, that exist in the modern workforce.
AUTHOR BIOGRAPHY
Business Leadership where he holds the position of Professor and Area Head: Leadership and Organisational Behaviour, he was employed at the University of South Africa as the Director: Organisation Development and Human Resource Information Systems. He has an extensive academic and institutional rese arch record with numerous publications in accredited peer reviewed academic journals and has delivered papers at various national and international conferences.
REFERENCES
Allen, N.J. & M eyer, J.P. (1990). The measurement and antecedents of affective, continuance and normative commitment to the organisation. Journal of Occupational Psychology, 63:1–18.
Ambrose, M .L., Arnaud, A. & Schminke, M . (2007). Individual moral development and ethical climate: The influence of person-organisation fit on job attitudes. Journal of Business Ethics, 77:323–333.
Arbour, S., Kwantes, C. Kraft, J. & Boglarsky, C. (2014). Person-organization fit: using normative behaviors to predict workplace satisfaction, stress and intentions to stay. Journal of Organizational Culture, Communications and Conflict, 18:41–63.
Arthur, B., Bell, S.T., Villado, A.J. & Doverspike, D. (2006). The use of person-organization fit in employment decision making: An assessment of its criterion-related validity. Journal of Applied Psychology, 91(4):786–794.
Brashear, T., Boles, J. S., Brooks, C. & Bellenger, D. N. (2003). Trust building processes and outcomes in sales manager-salesperson relationships: An empirical test and comparison. Journal of the Academy of M arketing Science, 31(2):189– 200.
Brayfield, A. H. & Rothe, H. F. (1951). An index of job satisfaction. Journal of Applied Psychology, 35:307–311.
Cable, D.M . & DeRue, D.S. (2002). The convergent and discriminant validity of subjective fit perceptions. Journal of Applied Psychology, 87(5):875–884.
Cable, D.M . & Edwards, J.R. (2004). Complementary and supplementary fit: A theoretical and empirical integration. Journal of Applied Psychology, 89(5):822–834.
Cable, D.M , & Judge, T.A. (1996). Person-organization fit, job choice decisions, and organizational entry. Organizational Behavior and Human Decision Processes, 7(3):294–311.
Cable, D.M, & Judge, T.A. (1997). Interviewers’ perceptions of person-organization fit and organizational selection decisions. Journal of Applied Psychology, 82 (4):546–561.
Chatman, J.A. (1991). M atching people and organizations. Selection and socialization in public accounting firms. Administrative Science Quarterly, 36:459-484.
Clercq, S.D., Fontaine J.R.J & Anseel, F. (2008). In search of a comprehensive value model for assessing supplementary Person-Organisation Fit. The Journal of Psychology, 142(3):277-302.
Cohen, J. (1988). Statistical power analysis for behavioral science. (Revised edition.) Orlando, FL: Academic Press. Cohen, R.J., Swerdlik, M .E., & Sturman, E.D. (2013). Psychological testing and assessment: An introduction to test and
measurement (8th edition). New York, NY: M cGraw-Hill.
DeVellis, R.F. (2012). Scale development: Theory and applications (3rd edition). Thousand Oaks, CA: Sage.
Edwards, J.R. (1991). Person–Job fit: A conceptual integration, literature review, and methodological critique. International Review of Industrial/Organisational Psychology, 6:283–357.
Endler, N.S. & M agnusson, D. (1976). Toward an interactional psychology of personality. Psychological Bulletin, 83:956–974. Freese, C. & Schalk, R. (1997). How to measure the psychological contract? A critical criteria-based review of measures. South
African Journal of Psychology, 38(2): 269-286.
Gabarro, J. J. & Athos, A. G. (1978). Interpersonal relations and communications. New York, NY: Prentice-Hall.
Garavan, T.N. (2007). Using assessment centre performance to predict subjective person-organization (PO) fit; a longitudinal study of graduates. Journal of M anagerial Psychology, 22(2):150–176.
Gregory, R. J. (2011). Psychological testing: History, principles, applications. Boston, M A: Pearson Education.
Grobler, A. (2014). Workplace alternatives – confront, conform, capitulate. African Journal of Hospitality, Tourism and Leisure, 3(2):1–27.
Grobler, A. & Grobler, S. (2015). Organisational climate: Conceptualisation and measurement in an open distance learning higher education institution. South African Journal of Higher Education, 29(4).
Grobler, A. & Grobler, S. (in press). Intention to quit as precursor of voluntary turnover: person-organisational fit and the psychological contract – a talent management quandary. M anuscript accepted for publication in South African Journal of Labour Relations.
Hair, J.F., Black, W.C., Babin, B.J. & Anderson, R.E. (2010). M ultivariate data analysis: a global perspective (8th edition). Boston: M A. Pearson.
Judge, T.A. & Cable, D.M . (1997). Applicant personality, organizational culture, and organization attraction. Personnel Psychology, 50(2):359–394.
Kammeyer-M ueller, J.D. (2007). The dynamics of newcomer adjustment: Dispositions, context, interactions and fit. In C. Ostroff & T.A. Judge (Eds.), Perspectives on organizational fit (pp. 3-70). New York, NY: Lawrence Erlbaum.
Kristof-Brown, A.L. (1996). Person–organization fit: An integrative review of its conceptualizations, measurement, and implications. Personnel Psychology, 49:1–49.
Kristof-Brown, A.L. (2000). Perceived app licant fit: Distinguishing between recruiters’ perceptions of job and person-organisazation fit. Personnel Psychology, 53:643–671.
Kristof-Brown, A.L. & Jansen, K.J. (2007). Issues of person-organization fit. In C. Ostroff & T.A. Judge (Eds.). Persp ectives on organizational fit (pp. 3-70). New York, NY: Lawrence Erlbaum.
Kristof-Brown, A.L., Zimmerman, R. D., & Johnson, E. C. (2005). Consequences of individual's fit at work: A meta-analysis of person-job, person-organization, person- group, and person-supervisor fit. Personnel Psychology, 58(2):281–342. Lauver, K. & Kristof-Brown, A. (2001): Distinguishing between employees’ perceptions of person-job and person-organization
fit. Journal of Vocational Behavior, 59(3):454–470.
Lee, T.W. & M itchell, T.R. (1994). An alternative approach: The unfolding model of voluntary employee turnover. Academy of M anagement. The Academy of M anagement Review, 19(1)51–89.
Leedy, P.D. & Ormrod, J.E. (2014). Practical research, planning and design (10th edition). New Jersey , NJ: Pearson Education. Liu, B., Liu, J. & Hu, J. (2010) Person-organisation fit, job satisfaction and turnover intention: An empirical study in the Chinese
Public Sector. Social Behaviour and Personality, 38(5):615-626.
M eyer, J.P., Hecht, T.D., Gill, H. & Toplonytsky, L. (2010). Person–organization fit and employee commitment under conditions of organizational change: A longitudinal study. Journal of Vocational Behaviour, 76:458–473.
M eyers, L.S., Gamst, G. & Guarino, A.J. (2013). Applied multivariate research. Design and interpretation (2nd edition). Thousand Oaks, CA: Sage.
M itchel, T.R., Holtom, B.C., Lee, T.W., Sablynski, C.J., & Erez, M . (2001). Why people stay. Using job embeddedness to predict voluntary turnover. Academy of M anagement Journal, 44(6):1102–1121.
M oerdyk, A. (2015). The principles and practice of psychological assessment (2nd edition). Pretoria: Van Schaik.
M uchinsky, P.M . & M onahan, C.J. (1987). What is person-environment congruence? Supplementary versus complementary models of fit. Journal of Vocational Behavior, 31:268–277.
Nunnally, J.C. & Bernstein, I.H. (1994). Psychometric theory (2nd edition). NY: M cGraw-Hill.
Ostroff, C. & Schulte, M . (2007). M ultiple perspectives of fit in organisations across levels of analysis. In C. Ostroff & T.A. Judge (Eds.), Perspectives on organizational fit (pp. 3–70). New York, NY: Lawrence Erlbaum.
Pallant, J. (2013). SPSS survival manual: a step by step guide to data analysis using IBM SPSS. (5th edition). NY: M cGraw -Hill. Rottinghaus, J.P. & Van Esbroeck, R. (2011). Improving person-environment fit and self-knowledge. In P.J. Hartung & L.M .
Subich (Eds.), Developing self in work and career. Concepts, cases and context (pp. 35–52). Washington, DC: American Psychological Association.
Ruiz-Palomino, P. M artìnez-Cañas, R. & Fontrodona, J., (2013) Ethical culture and employee outcomes: The mediating role of person-organisation fit. Journal of Business Ethics, 116:173–188.
Saks, A.M & Ashforth, B.E (1997). Organizational socialization: M aking sense of the past and present as a prologue to the future. Journal of Vocational Behavior, 51:234–279.
Schaufeli, W., Bakker, A.B. & Salanova, M . (2006). The measurement of work engagement with a short questionnaire: A cross -national study. Educational and Psychological M easurement, 66(4):701–716.
Tabachnick, B.G. & Fidell, L.S. (2007). Using multivariate statistics (5th edition). Boston: Pearson.
Vondracek, F.W. & Porfeli, E.J. (2007). Fostering self-concept and identity constructs in developmental career p sychology. In P.J. Hartung & L.M . Subich (Eds.), Developing self in work and career. Concepts, cases and context (pp. 53–70). Washington, DC: American Psychological Association.
West, S.G., Finch, J.F. & Curran, P.J. (1995). Structural equation models with non-normal variables: problems and remedies, in Structural equation modelling: concepts, issues, and applications, edited by R.H. Hoyle. Thousand Oaks: Sage: 159– 176.