www.nat-hazards-earth-syst-sci.net/10/1617/2010/ doi:10.5194/nhess-10-1617-2010
© Author(s) 2010. CC Attribution 3.0 License.
and Earth
System Sciences
Source modeling and inversion with near real-time GPS:
a GITEWS perspective for Indonesia
A. Y. Babeyko, A. Hoechner, and S. V. Sobolev
Deutsches GeoForschungsZentrum GFZ, Section 2.5, Potsdam, Germany
Received: 24 February 2010 – Revised: 22 June 2010 – Accepted: 22 June 2010 – Published: 26 July 2010
Abstract. We present the GITEWS approach to source mod-eling for the tsunami early warning in Indonesia. Near-field tsunami implies special requirements to both warning time and details of source characterization. To meet these require-ments, we employ geophysical and geological information to predefine a maximum number of rupture parameters. We discretize the tsunamigenic Sunda plate interface into an or-dered grid of patches (150×25) and employ the concept of Green’s functions for forward and inverse rupture mod-eling. Rupture Generator, a forward modeling tool, addition-ally employs different scaling laws and slip shape functions to construct physically reasonable source models using basic seismic information only (magnitude and epicenter location). GITEWS runs a library of semi- and fully-synthetic scenarios to be extensively employed by system testing as well as by warning center personnel teaching and training. Near real-time GPS observations are a very valuable complement to the local tsunami warning system. Their inversion provides quick (within a few minutes on an event) estimation of the earthquake magnitude, rupture position and, in case of suffi-cient station coverage, details of slip distribution.
1 Introduction
The GITEWS initiative (German Indonesian Tsunami Early Warning System) was a German response to the catastrophic December 2004 Indian ocean tsunami which devastated In-donesia and other countries across the Indian Ocean. It con-sists of a consortium of German partners leaded by the Ger-man Research Center for Geosciences (GFZ) in close coop-eration with a number of research and governmental agencies in Indonesia (Rudloff et al., 2009).
Correspondence to: A. Y. Babeyko ([email protected])
Modern tsunami early warning systems strongly rely on tsunami modeling as an integral part of the system. The Deci-sion Support System (DSS) collects all available sensor data, usually including seismic and ocean measurements (while GITEWS additionally employs near real-time GPS data, see Falck et al., 2010), and then asks the modeling unit for the tsunami prediction based on the collected observations. To provide such a prediction, the modeling unit of the TEWS (Tsunami Early Warning System) essentially solves an in-verse problem: given available, usually sparse, observa-tions, find the best-fitting tsunami generation and propaga-tion model or a model set. Such best-fit model(s) could be either fully precomputed like in the Japanese operational TEWS (Kamigaichi, 2009) and in GITEWS, or constructed on-a-fly from precomputed components like in the Pacific Tsunami Early Warning System (Titov, 2009; Wei et al., 2008; Tang et al., 2009). The derived best-fit model(s) is then believed to be an adequate representation of the actual tsunami phenomenon and could be in turn employed to pro-vide qualified forecasting of expected tsunami arrival times and coastal runup. For detailed information on GITEWS De-cision Support System and modeling unit (SIM) readers are referred to the papers of Steinmetz et al. (2010) and Behrens et al. (2010), respectively.
In this scheme, quality of the warning, thus, depends on quality of real-time data as well as quality of modeling. In GITEWS, real time observations come from four main sen-sor types. Seismic processing of broadband station network with the original SeisComp3 software (Hanka et al., 2008) provides first information about the tsunamigenic source, namely, hypocenter and moment magnitude. Continuous near real-time GPS stations provide averaged surface dis-placements in two minutes intervals (Falck et al., 2010). To-gether with seismic data, GPS-displacements allow for the direct inversion to get more detailed source parameters in a few minutes after the earthquake (Sobolev et al., 2006, 2007; Hoechner et al., 2008). Later on, wave propagation
is tracked by ocean-based sensors. They include deep ocean buoys which combine bottom pressure sensors (Boebel et al., 2010) with the GPS-equipped floating part (Sch¨oene et al., 2008). Finally, operational sensor subsystems are completed with a network of coastal tide gauges (Sch¨one et al., 2008) checking the incoming leading wave depression (which is a normal case for the Indian Ocean coast of Indonesia) and, thus, leaving another 5–15 min for the evacuation.
Tsunami modeling is usually separated into source ing which provides initial conditions for tsunami and model-ing of tsunami wave propagation. Within GITEWS, the oper-ational wave propagation model TsunAWI was developed at the Alfred-Wegener-Institute (AWI), Bremerhaven (Harig et al., 2008) and also includes simulation of coastal inundation. In the present paper we describe the source modeling ap-proach implemented in GITEWS.
Although there are several sources of modeling tainty in the local tsunami early warning, the main uncer-tainty comes from the source. GITEWS is a near-field tsunami early warning system. Near-field TEWS have spe-cial requirements to the warning time and quality of the source characterization. Whereas a “classical” far-field tsunami early warning system like the Pacific Tsunami Warn-ing Center operates with some hours of warnWarn-ing time, the warning time for Indonesia is generally shorter than 10 min – taking into account some 30 min of the tsunami travel time from source to the coast minus at least 15–20 min for evacu-ation (see also Lauterjung et al., 2010).
A local TEWS also has special demands to the source pa-rameters. Reliable tsunami forecasting for the far-field can be done with primary seismic parameters including magni-tude, epicenter and directivity. Other rupture parameters like focal mechanism or depth are not so important (Okal, 1988). Slip distribution is generally not important as well – an as-sumption of uniform slip and epicenter in the middle of the rupture works quite well. Directivity can be with reasonable accuracy estimated from the trench geometry.
In contrast, reliable near-field prediction requires a much more detailed source model – a point source assumption is far not enough, just because source dimensions become com-parable to the tsunami travel distance to the coast. This means that exact position, dimension and orientation of the source become extremely important. This is even more truer if there are additional off-shore bathymetric features compa-rable or larger than a typical tsunami source. The Mentawai islands located some 200 km off-shore Sumatra exemplify such a pronounced bathymetric barrier which strongly affects tsunami generation and propagation in this region. See for example, Geist et al. (2006).
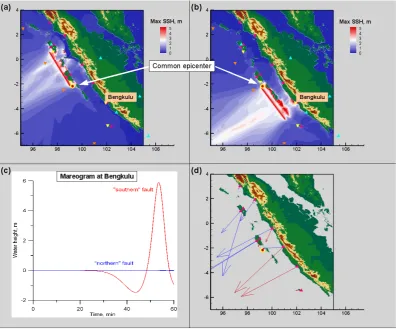
The above is illustrated by simple scenarios shown in Fig. 1. The two hypothetical scenarios with homogeneous slip distribution share the same epicenter, but have opposite rupture propagation directions. In the first model (Fig. 1a) rupture propagates northwards, similar to the December 2004 Great Andaman earthquake, while in the second model
(Fig. 1b) – in the opposite direction. All other rupture pa-rameters are the same. These two scenarios are effectively indistinguishable according to the primary seismic informa-tion available to the warning center within the first minutes after an event, i.e., epicenter and magnitude. Nevertheless, resulting tsunami impacts at the Sumatran coast are very different for the two cases. While the north-propagating rupture poses no threat to the city of Bengkulu, the south-propagating rupture would cause a major tsunami (Fig. 1c). Such extreme difference is a typical characteristic of local, near-field tsunamis.
The above scenarios with one-side rupture propagation do not seem unrealistic – compare them with rupture propaga-tion of the 2004 Great Sumatra-Andaman earthquake (Lay et al., 2005; Ishii et al., 2005; Krueger and Ohrnberger, 2005; Subarya et al., 2006).
Source models shown in Fig. 1a, b assume simplified ho-mogeneous slip distributions. This is usually not the case. Especially for large tsunamigenic earthquakes, slip distri-bution is often heterogeneous with regions of largest slip, and hence, largest initial tsunami wave height, not coincid-ing with the epicenter. Recent tsunamigenic earthquakes at the Sunda arc clearly illustrate this observation. E.g., the great December 2004 Sumatra-AndamanMw= 9.3
earth-quake (Subarya et al., 2006), later July 2006 West Java
Mw= 7.8 earthquake (Fujii and Satake, 2006),
Septem-ber 2007 Bengkulu Mw= 8.4 event (Lorito et al., 2008).
Geist and Dmowska (1999) and Geist (2002) clearly demon-strated the importance of non-homogeneous slip distribution in case of local tsunamis. Stability of the initial wave front almost directly translates all initial local wave peaks and troughs to the nearby coast.
Thus, summarizing, reliable local tsunami early warning requires much more information about the source than epi-center and magnitude. Ideally, it requires a finite fault model some 5–10 min after the event. It is still not reachable with present (Ji et al., 2002) or novell (Krueger and Ohrnberger, 2005) seismological techniques based on teleseismic inver-sions. Long travel times of more than 15 min restrict their application for near-field tsunami early warning.
Alternatively, in the course of the GITEWS project, our group proposed to use near real-time GPS-arrays to get very fast information about finite fault parameters (Sobolev et al., 2006, 2007) and presented the concept of “GPS-Shield” for Indonesia. This concept could be extended world-wide, to many other tsunamigenic active margins where the land is located above or close to seismogenic zones.
Potential usability of GPS observations for near-field tsunami early warning is illustrated in Fig. 1d. A hypothetical coastal network of GPS stations would be able to perfectly discriminate between the two rupture scenarios. Note how prominent is the difference in fingerprints of GPS-signals is-sued by the “northern” (blue) vs. “southern” (red) rupture. Static displacements take some 2–5 min after an event to es-tablish (Sobolev et al., 2007; Falck et al., 2010) which makes
Figure 1.
Two hypothetical scenarios offshore Sumatra demostrating extreme sensitivity of local
tsunamis to rupture position (which is not fully defined by the seismic epicenter!) and local
bathymetry as well as high prediction potential of near real-time GPS observations. (a)
Maximum tsunami wave heights in case of unilateral rupture propagating northwards from the
epicenter (red-yellow dot). (b) Rupture propagates in the opposite direction. (c) Resulting
mareograms at Bengkulu. (d) Array of GPS stations can perfectly discriminate between the two
scenarios in few minutes on an event.
21
-590
Fig. 1. Two hypothetical scenarios offshore Sumatra demonstrating extreme sensitivity of local tsunamis to rupture position (which is
not fully defined by the seismic epicenter!) and local bathymetry as well as high prediction potential of near real-time GPS observations.
(a) Maximum tsunami wave heights in case of unilateral rupture propagating northwards from the epicenter (red-yellow dot). (b) Rupture
propagates in the opposite direction. (c) Resulting mareograms at Bengkulu. (d) Array of GPS stations can perfectly discriminate between the two scenarios in few minutes on an event.
near real-time GPS a very valuable component of the tsunami early warning system. That is why the source modeling in GITEWS relies not only on seismic information but on near real-time GPS data as well.
The following section shortly presents the concept of source modeling in GITEWS. After that, in Sect. 3, we de-scribe Rupture Generator (RuptGen) – a tool for source for-ward modeling, followed by some applications (Sect. 4). Fi-nally, Sect. 5 discusses our approach to source inversion us-ing GPS observations.
2 Concept of source modeling
The GITEWS approach to source modeling targets two main goals. First, it should be able to provide a reasonable source model based on very limited seismic information available just few minutes after the earthquake, namely – data on epi-center and magnitude. Second, in the case when near real-time GPS data are available, the model should be able to
pro-vide their inversion into slip distribution in order to propro-vide a more realistic finite fault model.
As noted before, GITEWS should be able to provide tsunami early warning already 5–10 min after an earth-quake. To this time, only basic seismic information is avail-able which includes position of the epicenter and magnitude (Hanka et al., 2008). On the other hand, even simple physical rupture model, represented by the classical Okada’s (1985) rectangular fault, requires knowledge of a number of param-eters including rupture length and width, depth, strike-, dip-and rake- angles as well as amount of co-seismic slip. Our idea is to utilize as much as possible a priori geological and geophysical information in order to pre-constrain maximum possible number of fault parameters. In particular, strike and dip angles of interplate earthquakes can be postulated from the known 3-D geometry of the plate interface. The same is true for the depth. Instead of accepting the reported hypocen-ter depth which can be very inaccurate, we calculate the fo-cal depth by projecting the earthquake epicenter onto the 3-D plate interface surface.
After fixing these parameters, remaining rupture dimen-sions and amount of co-seismic slip can be estimated in real-time with the help of scaling laws.
In the case when near real-time GPS data are available additionally to seismic, our source model should be able to provide their effective inversion into a more reliable rupture model. Sobolev et al. (2006, 2007) demonstrated that near real-time coastal GPS arrays may be effectively employed for direct slip inversion in just a few minutes on an event. To facilitate inversion, it is better to keep it linear. Surface deformation linearly depends on the amount of slip and non-linearly on other rupture parameters (Okada, 1985). That means that GPS displacements could be effectively inverted into amount of slip. All other rupture parameters whose re-lation to surface displacements is non-linear, should be pre-defined before the inversion.
To meet the above requirements we discretize the 3-D sub-duction plate interface into numerous individual patches with dip- and strike-slip at each patch as the only free parameters, and apply the Green’s functions approach to forward and in-verse calculations. Practically, for forward source modeling, this approach was realized in the so-called Rupture Genera-tor (RuptGen) described in the next section.
3 Rupture Generator (RuptGen)
RuptGen is a GITEWS source modeling software tool that calculates static sea-floor and GPS displacements resulting from co-seismic slip along the subduction zone plate in-terface. Flexible input of rupture parameters allows var-ious source models, from quick fully automatic “magni-tude/location” model to advanced user-specified slip distri-bution models. Program output includes gridded surface dislocations, displacement vectors at predefined positions (“GPS-mode”) or direct output onto TsunAWI (GITEWS operational tsunami wave propagation code) non-structured grid for later tsunami propagation simulation (“TsunAWI-mode”).
RuptGen employs the concept of patches (sub-faults) at the subduction plate interface. The plate interface between the subducting Indian-Australian and the upper Sunda plate is discretized into a regular mesh of rectangular patches (Fig. 2) ranging from 0 to 100 km depth. The mesh follows the geometry of the plate interface as derived from the RUM model by Gudmundsson and Sambridge (1998) additionally checked against the earthquake relocation results by Engdahl et al. (2007) in the northern part. Discretization of the plate geometry is stored in a special plate interface description file. In the current version the mesh consists of 25×150 patches with dimensions of approximately 40×15 km. Each patch represents a rectangular fault plane of known geometry and position. Three components of the surface deformation (lon-gitudinal, latitudinal and vertical displacements) due to the unit dip- and strike-slip are pre-computed for each patch and
Figure 2. Discretization model for the tsunamigenic Sunda plate interface (150x25 patches) based on Gudmundsson and Sambridge (1998) and Engdahl et al. (2007). Also shown is initial wave and horizontal surface displacements for a Mw=8.4 scenario from the GITEWS scenario databank.
22 -595
Fig. 2. Discretization model for the tsunamigenic Sunda plate interface (150×25 patches) based on Gudmundsson and Sam-bridge (1998). Also shown is initial wave and horizontal surface displacements for aMw= 8.4 scenario from the GITEWS scenario
databank.
stored in a databank of patches Green’s functions. Using this databank of Green’s functions, sea-floor deformation can be easily calculated for any earthquake scenario with given slip distribution.
Present dislocation Green’s functions are calculated us-ing EDGRN/EDCMP software (Wang et al., 2003) for the IASP91 1D layered Earth model (Kennett and Engdahl, 1991). RuptGen is, however, absolutely flexible in choice of elastic dislocation models. Patches Green’s functions can be alternatively calculated using, e.g., homogeneous half-space Okada (1985) or fully 3-D finite element models (not yet im-plemented).
RuptGen can operate in two different modes: “automatic” and “manual”. In the automatic mode RuptGen receives only primary seismic data (epicenter and magnitude) and automat-ically builds a fault model with a regular slip distribution to provide a simple but adequate solution to initiate tsunami propagation. In particular, RuptGen assumes constant rake angle for the whole rupture (90◦, pure dip-slip) and employs
empirical scaling laws to calculate rupture dimensions and effective co-seismic slip. Please note, that 3-D geometry of the tsunamigenic plate interface and, hence, dip and strike angles as well as depth at each longitude/latitude position are predefined by the discretization model (see above).
Taking into account that rupture dimensions can be esti-mated from moment magnitude using empirical scaling laws, effective co-seismic slip can be estimated from the relation:
M0(Mw)=µL(Mw)W (Mw)U (1)
where M0 is seismic moment andMw= 2/3 (lgM0−9.1), Lis rupture length, W is rupture width, U is slip andµis shear modulus of the ruptured media. To calculate rupture dimensions from the moment magnitude, RuptGen employs two empirical scaling laws: either relations by Wells and
Coppersmith (1994) for reverse faults, or, alternatively, so-called Okal’s relation which postulates L=2W combined with the Wells and Coppersmith (1994) scaling law for the rupture area.
After estimating rupture dimensions and effective (aver-age) co-seismic slip, RuptGen starts to build a finite fault model by positioning the rupture onto the plate interface discretized into patches and by applying corresponding slip shape function. Currently available slip shape functions in-clude: (a) uniform slip, (b) Gaussian symmetrical in both directions and (3) asymmetrical crack model with a smooth closure condition along width (Freund and Barnett, 1976; Geist and Dmowska, 1999) combined with variable linear tapering along length.
Result of these manipulations is a list of ruptured patches with amount of slip at each patch. After that, Green’s dislo-cation functions for each patch are linearly combined to give the resulting three component surface deformation (Fig. 2).
In the second, manual mode, user can directly specify any slip distribution to simulate complex heterogeneous finite fault models. For example, teleseismic inversions of large tsunamigenic earthquakes can be interpolated into RuptGen to simulate historical events.
4 Implication of RuptGen for scenario generation 4.1 Providing sources for the GITEWS tsunami
repository
GITEWS operational forecasting is based on the databank of pre-computed tsunami scenarios. Four different sensor sys-tems – seismic, GPS, deep ocean buoys which combine a GPS buoy with a bottom pressure unit (OBU), and, finally, coastal tide gauges – deliver real-time observations to the Tsunami Service Bus (TSB) (Fleischer et al., 2010). After initial proof and pre-processing of sensor data, TSB delivers them to the Decision Support System (DSS) (Steinmetz et al., 2010), which, in turn, asks the Simulation Module (SIM) (Behrens et al., 2010) to match observations to pre-computed tsunami scenarios. Scenarios, which best fit the data, are con-sidered to represent the current situation off-shore and are used for the forecasting. It is worth to note that the DSS does not take a single “best-fit” scenario but takes care of all pos-sible data uncertainties and databank assumptions and builds an aggregated best-match scenario from a list of top-matches. Presently, the databank includes about 2000 scenarios along the Sunda subduction zone plate interface with epicen-ters lying in cenepicen-ters of RuptGen patches (Fig. 2), i.e., some 30 km apart and magnitudes ranging from 7.5 to 9.0. De-spite RuptGen can model any slip distribution, there are no reasons to assume some complex non-symmetric slip distri-bution for regular databank scenarios. Standard scenario in the tsunami repository assumes a rupture model with follow-ing characteristics:
– width and length follow the scaling laws by Wells and Coppersmith (1994),
– epicenter coincides with the geometrical center of the rupture,
– slip distribution has a symmetrical bell-shaped (Gaus-sian) form with maximum at the epicenter,
– effective slip is calculated from Eq. (1) assuming shear modulusµ=3.5×10¹⁰Pa.
Example scenario surface displacements corresponding to an
Mw= 8.4 earthquake are shown in Fig. 2.
Additionally to wave propagation, GITEWS simulation databank contains also vertical and horizontal co-seismic static surface displacements for the later matching with real-time GPS observations.
4.2 Source models for historical events
Historical events are valuable natural benchmarks for test-ing of new models and algorithms. To calculate databank scenarios, we employed RuptGen in the automatic mode. In contrast, historical events with their known slip distribu-tion should be usually modeled in the manual mode. In the following two models, slip distribution implied on input to RuptGen comes from inversion of co-seismic GPS observa-tions (see more about inversion in Sect. 5).
Figure 3 presents slip reconstruction for the two histori-cal events off Sumatra: the great December 2004Mw= 9.1
Sumatra-Andaman earthquake (Fig. 3a) and following Nias event of March 2005 withMw= 8.6 (Fig. 3b).
Slip distribution for the December 2004 event comes from the GPS inversion by Hoechner et al. (2008). See this pa-per for more details on inversion procedure and sources of data. An independent check for the quality of resulting source model is provided by the comparison of the computed tsunami wave propagation with the direct satellite observa-tions by the Jason-1 mission (see inlet on Fig. 3a).
Slip distribution for the Nias March 2005 earthquake is less heterogeneous (Fig. 3b) showing the two regions of larger slip under the islands. Note very good correspondence between calculated and observed GPS-displacements (Konca et al., 2007).
Recent 30 September 2009 PadangMw= 7.5 earthquake
took place when GITEWS Decision Support System was al-ready running in Jakarta in test mode. We had a possibility to check our forecasting and warning procedures. It was even more intriguing since this earthquake was not a classical sub-duction zone event, which was expected to take place in the region of Padang after the Nias 2005 and Bengkulu 2007 events. Expected was a shallow-dipping thrust interplate event with strike parallel to the trench. Exactly such kind of events are pre-computed and stored in the GITEWS scenario
Figure 3.
Source models for the two historical events off Sumatra. Slip distribution was inverted
from GPS observations. (a) Model for the great Sumatra-Andaman Mw=9.3 earthquake
(Hoechner et al., 2008). Inlet shows comparison of the corresponding tsunami propagation model
with the direct tsunami observation in Indian Ocean some 2 hours after the earthquake by the
Jason-1 satellite mission. (b) 2005 Nias-Simeulue Mw=8.6 event.
23
-600
Fig. 3. Source models for the two historical events off Sumatra. Slip distribution was inverted from GPS observations. (a) Model for the
Great Sumatra-AndamanMw= 9.3 earthquake (Hoechner et al., 2008). Inlet shows comparison of the corresponding tsunami propagation
model with the direct tsunami observation in Indian Ocean some two hours after the earthquake by the Jason-1 satellite mission. (b) 2005 Nias-SimeulueMw= 8.6 event.
database (Sect. 4.1). In reality, the earthquake of 30 Septem-ber did not rupture the plate interface, instead, it was an in-traplate event inside the subducting slab with much steeper dip angle (>50◦) and strike angle almost perpendicular to the
trench (USGS, 2009). Events with such focal mechanisms are extremely rare in this region, which brought additional challenge to the GITEWS Decision Support System (DSS).
The Earthquake took place at 10:16:09 UTC. Five minutes after that, at 10:21:00 UTC, DSS had only primary seismic data for matching: position of the epicenter and magnitude value of 8.0. Simulation module (SIM) matched these data to the pre-computed scenario which forecasted about 2–3 m tsunami wave in the city of Padang. Actually, such forecast would lead to a false warning, since in reality observed wave height in Padang did not exceed 40 cm. The discrepancy is attributed to the difference between real rupture parameters, from one side, and that known to the DSS (magnitude esti-mate) and assumed by source modeling (focal mechanism, depth, geometry), from another side. We performed analysis of which parameters are responsible for the potential false alarm.
1. Focal mechanism. As noted above, the focal mecha-nism of the Padang earthquake was very unusual, with almost 90-degree rotated strike and much steeper dip compared to the “classical” subduction zone earthquake comprising the scenario databank. Our hindcast model-ing showed that focal mechanism did not play any sig-nificant role in this case. “Classical” subduction zone
effect of the same magnitude at the same position would give approximately the same minor runup in Padang. 2. Hypocenter depth. Finally reported CMT depth is
about 80 km (intra-slab event) in contrast to the 60 km scenario hypocenter depth. Again, hindcast modeling showed that the 20 km depth difference could not ac-count for somewhat significant runup difference. 3. Magnitude value. CMT value derived some hours
af-ter the event isMw= 7.5. At 10:21:00 UTC DSS
op-erated with a SeisComP3 value of Mw= 8.0 (later on
this value was reduced to 7.7). And that was exactly the reason for the overestimation of the tsunami threat. Scenario models with Mw= 7.5 magnitude predict no
tsunami threat even if assuming “classical” focal mech-anism and/or shallower depth of 60 km.
In the introduction we noted that near real-time GPS data may be a very valuable addition to the seismic information in order to better constrain source parameters in a few min-utes after an event. The earthquake on 30 September proved that once again. The indonesian GPS-station in Padang op-erated by the National Coordination Agency for Surveys and Mapping (BAKOSURTANAL) did not show any notable co-seismic displacement (C. Falck, personal communication). In contrast, theMw= 8.0 scenario, selected by matching to
seismic data only, would have implied about 50 cm of hori-zontal displacement. Had GPS data been available to the De-cision Support System 5 min after the earthquake, the above
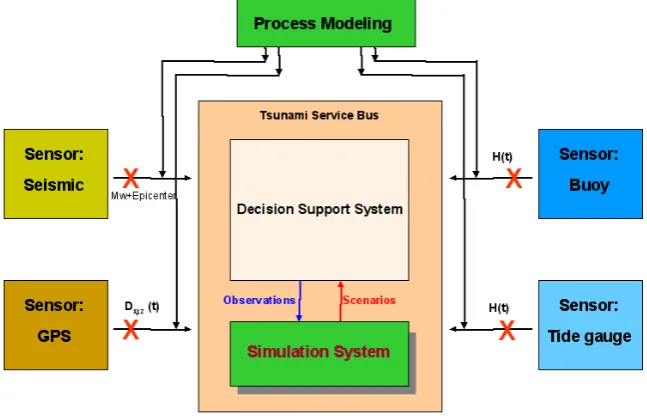
Figure 4.
Implication of the process modeling for the testing of the GITEWS core software
components: Tsunami Service Bus (see also Fleischer et al., 2010), Decision Support System
(Steinmetz et al., 2010) and Simulation Module. The system is being detached from real physical
sensors and being feeded by pre-computed scenario datasets at different sensor types.
24
-605
Fig. 4. Implication of the process modeling for the testing of the GITEWS core software components: Tsunami Service Bus (see also
Fleischer et al., 2010), Decision Support System (Steinmetz et al., 2010) and Simulation Module. The system is being detached from real physical sensors and being feeded by pre-computed scenario datasets of different sensor types.
scenario, which overestimated tsunami hazard, could have been rejected by the matching procedure.
4.3 Modeling of hypothetical future events for testing and training
Together with historical events, fully synthetic hypothetical scenarios provide a valuable basis for tuning and testing of the GITEWS components as well as for teaching and training of the future warning center personnel. Moreover, historical records, while being of highest priority, nevertheless, cannot provide all necessary data for the extensive system verifica-tion and validaverifica-tion. Data are sparse and irregular, some sen-sor types like deep ocean buoys were not available in the In-donesian region till recently. Continuous near real-time GPS were not employed for the early warning elsewhere. Due to the same reasons, historical events are not the best scenarios for teaching and training of the warning center personnel. In this respect, synthetic scenarios, which provide all possible coherent sensor data to the same event, appear to be the best candidates for testing and training.
In GITEWS we developed a so-called Scenario Library consisting of a number of fully synthetic scenarios contain-ing modeled sensor signals stored in natural sensor formats. Scenarios from this library can be any time played back on input to the GITEWS software units (Fig. 4). The latter does not actually realize if incoming data come from real or from virtual world.
Synthetic scenarios are fully under control of their devel-opers. That makes them an ideal toolkit to simulate all pos-sible situations which may realize in later operational work.
5 Towards more reliable source inversion with near real-time GPS data
As noted before, one of the goals of the source modeling unit of GITEWS is fast inversion of near real-time GPS data. Incorporation of GPS data in addition to seismic information can strongly increase the quality of the tsunami forecasting in the near-field (Sobolev et al., 2006, 2007) providing more in-formation on source parameters in a few minutes on an event (see also Sect. 1).
Real-time GPS data were not previously employed in the tsunami early warning. Rapid progress of the GPS process-ing technique durprocess-ing the last decade makes near real-time GPS observations a valuable component of future tsunami warning systems. Blewitt et al. (2006) showed that even far-field GPS data can be used to correctly determine the magnitude and some information about the geometric pattern for a large earthquake in nearly real time. Simultaneously, Sobolev et al. (2007) studied the possibility of near real-time magnitude determination and slip inversion based on near- and middle- range GPS observations during the great Sumatra-Andaman earthquake. The two historical rupture models presented in Fig. 3 are results of direct inversions of GPS observations into slip distribution.
GPS inversion into slip distribution, while exploiting the linearity of surface deformation relatively to the amount of slip, still remains a numerically challenging task (Hoechner et al., 2008). An alternative way is the inversion with the help of pre-computed source models (database matching), such as scenarios from the GITEWS database. In the present section we want to assess the feasibility and possible benefit from
Figure 5.
Comparing different methods of source inversion for a synthetic scenario with
strongly heterogeneous slip distribution. Rows: First: slip distribution (color) and rake angle
(arrows), epicenter (yellow star) and tide gauge positions (magenta circles, from north: Padang,
Muko Muko, Bengkulu). Second: sea floor deformation and horizontal GPS displacement
vectors. Third: maximum wave height. Columns: First: synthetic scenario with heterogeneous
slip distribution (forward model). Second: scenario match from a pre-computed databank based
on seismic data only (epicenter and magnitude). Third: best matching scenario using GPS.
Fourth: best match using GPS plus seismic magnitude. Fifth: direct inversion of GPS into slip
distribution.
25
-610
615
Fig. 5. Comparing different methods of source inversion for a synthetic scenario with strongly heterogeneous slip distribution. Rows: First:
slip distribution (color) and rake angle (arrows), epicenter (yellow star) and tide gauge positions (magenta circles, from north: Padang, Muko Muko, Bengkulu). Second: sea floor deformation and horizontal GPS displacement vectors. Third: maximum wave height. Columns: First: synthetic scenario with heterogeneous slip distribution (forward model). Second: scenario match from a pre-computed databank based on seismic data only (epicenter and magnitude). Third: best matching scenario using GPS. Fourth: best match using GPS plus seismic magnitude. Fifth: direct inversion of GPS into slip distribution.
performing a direct slip inversion as compared to selecting a pre-computed scenario for tsunami early warning.
To this purpose we consider an extreme earthquake in terms of slip distribution, with slip concentrating at the start-ing and the endstart-ing side of the rupture (approximately off-shore Padang and Bengkulu). This scenario with heteroge-neous slip andMw= 8.62 (forward model) is shown in the
leftmost column of Fig. 5. Azimuth of slip vectors is 210◦. We then generate a dataset of synthetic ruptures in magni-tude steps of 0.2 and epicenters spaced every 25 km perpen-dicular and 80 km parallel to the trench. All ruptures have rake angles equal to 90◦(pure dip-slip). Further on, we will compare our forward model to different matching schemes.
The second column in Fig. 5 shows the scenario selected from the dataset using seismic parameters as matching cri-teria only: epicenter (yellow star) and magnitude. The next column presents matching based on GPS data. “GPS-observations” were generated from the forward model by applying random noise of 5 cm horizontal and 10 cm ver-tical amplitude. Spatial distribution of GPS stations corre-sponds to the ideal “GPS shield” configuration as described in Sobolev et al. (2007). The fourth column corresponds to the joint matching of GPS and seismic data.
Inversions presented in columns 2 to 4 were made by matching “observations” with pre-computed scenarios from the dataset. In contrast, the last column in Fig. 5 presents re-sults of direct inversion of “GPS-observations” into the slip distribution at the patches. The direct inversion procedure minimizes GPS misfit between forward model and inversion using smoothing and boundary constraints for slip and rake angle as described by Hoechner et al. (2008).
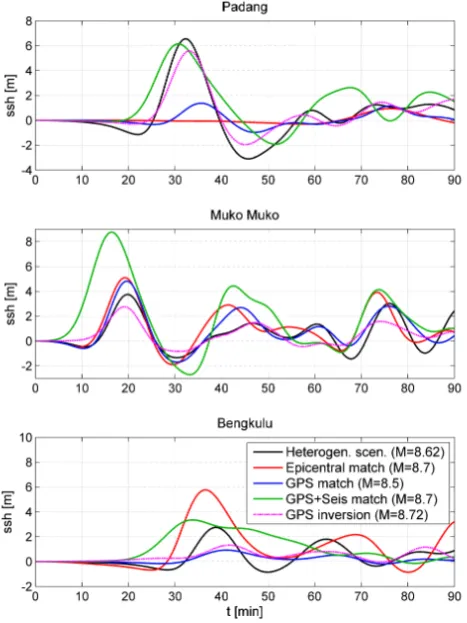
Since all source models are, in end-effect, interesting rel-ative to their tsunamigenic potential, we calculated corre-sponding tsunamis at the Sumatran coast. Figure 6 shows synthetic tide gauge time series at three selected sites. It is clear that the seismic match (second column on Fig. 5) is not a good choice for such a unilateral rupture, – predicted maximum wave height at Bengkulu is about 2 times too high while prediction for Padang is about 6 times too low and 40 min too late. The two GPS-matches capture well the ex-tent of the rupture. The GPS-only match significantly under-predicts wave heights, while joint GPS + seismic inversion results in quite good predictions for Padang and Bengkulu. At the same time, prediction at Muko Muko is about twice as high, since there are no earthquakes with heterogeneous slip distribution in the scenario dataset.
Figure 6. Mareograms at the three tide gauges (for location see Fig. 5) for the different inversion methods.
26 -620
Fig. 6. Mareograms at the three tide gauges (for location see Fig. 5)
for the different inversion methods.
Direct slip inversion was able to reconstruct the two sep-arated slip maxima (Fig. 5, rightmost column), and the gen-eral agreement at the tide gauges is good, though there is significant underprediction at Bengkulu (Fig. 6). The reason therefore is that the southern patch of larger slip in the in-verted model (rightmost column on Fig. 5) is shifted some 50 km north relative to the forward model (leftmost column on Fig. 5). Due to the extreme sensitivity to location (effect of the Mentawai islands), this shift is enough to get markedly smaller runup in Bengkulu. This observation illustrates, first of all, again that the near-field early warning crucially de-pends on source parameters (Geist, 2002), and, hence, on quality of source inversion.
Present modeling shows that direct inversion of GPS ob-servations into slip distribution requires further studies and optimizations. Numerical analysis constrained by (rare) real observations seems to be an appropriate strategy for such studies. Direct slip inversion has many advantages com-ing, first of all, from its flexibility and absence of any pre-constrained slip distributions. On the other hand, direct in-version can be tricky and needs extensive calibration for each particular GPS-constellation, and, hence, costs time and ex-pertise. To provide reliable source inversion, one needs a
very good station coverage. For example, an additional GPS-station south of Bengkulu might have helped to better resolve the southern end of the rupture.
Matching into pre-computed scenarios seems to be a rea-sonable alternative, especially when station coverage is far from ideal. The main advantage here is that such an in-version is numerically stable even with only a small num-ber of observations and will always result in a physically credible source model, because we do not invert into slip on individual patches, but use already physically reasonable scenarios from the databank. The main disadvantage is that scenarios in the databank have some pre-defined slip distri-bution, so we would not be able to get real slip distribution. Actually, what we invert for is the position of the earthquake centroid and magnitude. Of course, matching with a single scenario could not be optimal for ruptures with strongly het-erogeneous slip distribution, like in the example above. A perspective way to deal with such complex ruptures may be matching with linear combination of two or more databank scenarios simultaneously. That is, after matching to a single scenario, one may try to further reduce the GPS-mismatch by combining any two closely located scenarios with vari-able weights.
A very important issue is a forecast uncertainty which is generally a complex product of model and observation un-certainties. Model uncertainties include, e.g., megathrust ge-ometry, limitations of dislocation model employed, material parameters. Figure 3 demonstrates that our source model is able to reproduce real observations for large events pretty well. We need, however, much more case studies, especially for smaller events, with lower signal-to-noise ratio.
If pre-computed scenarios are used for the source inver-sion, then other important model uncertainties come from the discreteness of the data-bank population and from im-posed models of slip distribution. Figure 5 illustrates the effect of discreteness: compare, for example, the two pre-computing scenarios, columns 3 and 4, which are close to each other by location (∼50 km) and magnitude (0.2Mw) but
predict significantly different wave heights (see also Fig. 6, blue and green lines). Sensitivity analysis is required in each particular case to derive the necessary population density for the databank of pre-computed scenarios.
As to the observation uncertainty, one should recall at least the uncertainty inMw. In the GITEWS Project, with its dense
broadband station distribution, this uncertainty is estimated to be±0.3 magnitude units during the first 5 to 10 min after an earthquake. In the early warning process, this uncertainty would be usually treated in a worst-case sense thus leading to the significant over-estimation of the source (compare to the previous paragraph), if not additionally constrained by other observations like near real-time GPS (see Behrens et al. (2010) for more information about multi-sensor inversion approach in GITEWS). Detailed analysis on the quality of forecast with near-real time GPS lies out of the scope of the present paper and will be addressed elsewhere.
6 Summary and outlook
In the present paper we presented the GITEWS approach to the source modeling for the tsunami early warning in In-donesia. Near-field tsunami poses strict requirements to both warning time and details of source characterization. To meet these requirements we try to employ as much geophysical and geological information as possible in order to pre-define maximum number of rupture parameters. We discretize the tsunamigenic Sunda plate interface into an ordered grid of patches and employ the concept of Green’s functions for for-ward and inverse rupture modeling. Amount of dip- and strike- slip at the patches are the only free parameters in our source models.
Our forward modeling tool, Rupture Generator, addition-ally employs different scaling laws and slip shape functions to construct physically reasonable source models from basic seismic information only, namely, from magnitude and epi-center location.
GITEWS runs a library of semi- and fully synthetic sce-narios to be extensively employed by system testing as well as by teaching and training activities in the warning center. Synthetic scenarios are probably the only way to get a phys-ically coherent image of an event (earthquake plus tsunami) at different sensor types including land- (seismic, GPS) and ocean-based sensors (bottom pressure units, floating GPS buoys, coastal tide gauges).
Near real-time GPS observations are a very valuable com-plement to the local tsunami warning system. Their inver-sion provides quick (within a few minutes on an event) esti-mation of the earthquake magnitude, centroid location and, given sufficient station coverage, details of slip distribution. GPS data can be inverted either into pre-computed source models, or directly into slip distribution at the patches. The latter approach provides more reliable source models, espe-cially for large events with heterogeneous slip distribution, but requires a very good station coverage. Both inversion ap-proaches require further efforts in development of method-ology and fast numerical solutions as well as extensive test-ing and calibration at particular locations. Numerical rupture models, as developed in the present study, seem to provide an appropriate background for such studies.
Acknowledgements. The GITEWS project (German Indonesian Tsunami Early Warning System) is carried out through a large group of scientists and engineers from (GFZ) German Research Centre for Geosciences and its partners from the German Aerospace Centre (DLR), the Alfred Wegener Institute for Polar and Marine Research (AWI), the GKSS Research Centre, the German Marine Research Consortium (KDM), the Leibniz Institute for Marine Sciences (IFM-GEOMAR), the United Nations University (UNU), the Federal Institute for Geosciences and Natural Resources (BGR), the German Agency for Technical Cooperation (GTZ), as well as from Indonesian and other international partners. Funding is provided by the German Federal Ministry for Education and Research (BMBF), Grant 03TSU01. Authors thank Gerd Teschke
(University of Applied Sciences, Neubrandenburg) for his valuable help in establishing GPS inversion algorithms. Johannes Franke (IABG, M¨unchen) and Jens Fleischer (GFZ, Potsdam) assisteded in development of the GITEWS Scenario Library. Comments and suggestions of S. Lorito, anonymous reviewer and editor of the Special Volume helped to improve the manuscript. This is GITEWS publication No. 113.
Edited by: A. Rudloff
Reviewed by: S. Lorito and another anonymous referee
References
Behrens, J., Androsov, A., Babeyko, A. Y., Harig, S., Klaschka, F., and Mentrup, L.: A new multi-sensor approach to simulation assisted tsunami early warning, Nat. Hazards Earth Syst. Sci., 10, 1085–1100, doi:10.5194/nhess-10-1085-2010, 2010.
Blewitt, G., Kreemer, C., Hammond, W. C., Plag, H. P., Stein, S., and Okal, E.: Rapid determination of earthquake magnitude us-ing GPS for tsunami warnus-ing systems, Geophys. Res. Lett., 33, L11309, doi:10.1029/2006GL026145, 2006.
Boebel, O., Busack, M., Fl¨uh, E., Gouretski, V., Rohr, H., Macran-der, A., Krabbenh¨oft, A., Motz, M., and Radtke, T.: The GITEWS ocean bottom sensor packages, Nat. Hazard. Earth Sys., GITEWS Special Issue, accepted, 2010.
Engdahl, E. R., Villase˜nor, A., DeShon, H. R., and Thurber, C. H.: Teleseismic relocation and assessment of seismicity (1918– 2005) in the region of the 2004Mw9.0 Sumatra–Andaman and
2005Mw8.6 Nias Island great earthquakes, Bull. Seismol. Soc.
Am., 97, S43–S61, 2007.
Falck, C., Ramatschi, M., Subarya, C., Bartsch, M., Merx, A., Hoe-berechts, J., and Schmidt, G.: Near real-time GPS applications for tsunami early warning systems, Nat. Hazards Earth Syst. Sci., 10, 181–189, doi:10.5194/nhess-10-181-2010, 2010.
Fleischer, J., H¨aner, R., Herrnkind, S., Kloth, A., Kriegel, U., Schwarting, H., and W¨achter, J.: An integration plat-form for heterogeneous sensor systems in GITEWS – Tsunami Service Bus, Nat. Hazards Earth Syst. Sci., 10, 1239–1252, doi:10.5194/nhess-10-1239-2010, 2010.
Freund, L. B. and Barnett, D. M.: A two-dimensional analysis of surface deformation due to dip-slip faulting, Bull. Seismol. Soc. Am., 66, 667–675, 1976.
Fujii, Y. and Satake, K., 2006: Source of the July 2006 West Java tsunami estimated from tide gauge records, Geophys. Res. Lett., 33, L24317, doi:10.1029/2006GL028049, 2006.
Geist, E. L.: Complex earthquake rupture and local tsunamis, J. Geophys. Res., 107, 1–15, doi:10.1029/2000JB000139, 2002. Geist, E. L. and Dmowska, R.: Local tsunamis and distributed slip
at the source, Pure Appl. Geophys., 154, 485–512, 1999. Geist, E. L., Bilek, S. L., Arcas, D., and Titov, V. V.: Differences in
tsunami generation between 26 December, 2004 and 28 March, 2005 Sumatra earthquakes, Earth Planets Space, 58, 185–193, 2006.
Gudmundsson, ´O. and Sambridge, M.: A regionalized upper mantle (RUM) seismic model, J. Geophys. Res., 103, B4, 7121–7136, 1998.
Harig, S., Chaeroni, Pranowo, W. S., and Behrens, J.: Tsunami simulations on several scales: Comparison of approaches with
unstructured meshes and nested grids, Ocean Dynam., 58, 429– 440, doi:10.1007/s10236-008-0162-5, 2008.
Hanka, W., Saul, J., Weber, B., Becker, J. and GITEWS team: Timely regional tsunami warning and rapid global earthquake monitoring, Orfeus Newsletter, 8, 1, http://www.orfeus-eu.org/Organization/Newsletter/vol8no1/ onl seiscomp/onl seiscomp.htm, 2008.
Hoechner, A., Babeyko, A. Y., and Sobolev, S. V.: En-hanced GPS inversion technique applied to the 2004 Suma-tra earthquake and tsunami, Geophys. Res. Lett., 35, L08310, doi:10.1029/2007GL033133, 2008.
Ishii, M., Shearer, P. M., Houston, H., and Vidale, J. E.: Rup-ture extent, duration, and speed of the 2004 Sumatra-Andaman earthquake imaged by the Hi-Net array, Nature, 435, 933–936, doi:10.1038/nature03675, 2005.
Ji, C., Wald, D. J., and Helmberger, D. V.: Source description of the 1999 Hector Mine, California earthquake; Part I: Wavelet do-main inversion theory and resolution analysis, Bull. Seism. Soc. Am., 92, 1192–1207, 2002.
Kamigaichi, O.: Tsunami forecasting and warning, in: Encyclope-dia of Complexity and Systems Science, edited by: Meyers, R. A., Springer, 9592–9618, 2009.
Kennett, B. L. N. and Engdahl, E. R.: Traveltimes for global earth-quake location and phase identification, Geophys. J. Int., 105, 429–465, doi:10.1111/j.1365-246X.1991.tb06724.x, 1991. Konca, A. O., Hjorleifsdottir, V., Song, T. R. A., Avouac, J. P.,
Helmberger, D. V., Ji, C., Sieh, K., Briggs, R., and Meltzner, A.: Rupture kinematics of the 2005Mw 8.6 Nias-Simeulue
earth-quake from the joint inversion of seismic and geodetic data, Bull. Seismol. Soc. Am., 97, S307–S322, doi:10.1785/0120050632, 2007.
Krueger, F. and Ohrnberger, M.: Spatio-temporal source character-istics of the 26 December 2004 Sumatra earthquake as imaged by teleseismic broadband arrays, Geophys. Res. Lett., 32, L24312, doi:10.1029/2005GL023939, 2005.
Lauterjung, J., M¨unch, U., and Rudloff, A.: The challenge of in-stalling a tsunami early warning system in the vicinity of the Sunda Arc, Indonesia, Nat. Hazards Earth Syst. Sci., 10, 641– 646, doi:10.5194/nhess-10-641-2010, 2010.
Lay, T., Kanamori, H., Ammon, C. J., Nettles, M., Ward, S. N., Aster, R. C., Beck, S. L., Bilek, S. L., Brudzinski M. R., But-ler, R., DeShon, H. R., Ekstr¨om, G., Satake, K., and Sipkin, S.: The great Sumatra-Andaman earthquake of 26 December 2004, Science, 308, 1127–1133, 2005.
Lorito, S., Romano, F., Piatanesi, A., and Boschi, E.: Source pro-cess of the 12 September, 2007,Mw8.4 southern Sumatra
earth-quake from tsunami tide gauge record inversion, Geophys. Res. Lett., 35, L02310, doi:10.1029/2007GL032661, 2008.
Okada, Y.: Surface deformation due to shear and tensile faults in a half-space, Bull. Seismol. Soc. Am., 75, 1135–1154, 1985.
Okal, E. A.: Seismic parameters controlling far-field tsunami am-plitudes: A review, Nat. Hazards, 1, 67–96, 1988.
Rudloff, A., Lauterjung, J., M¨unch, U., and Tinti, S.: Pref-ace The GITEWS Project (German-Indonesian Tsunami Early Warning System), Nat. Hazards Earth Syst. Sci., 9, 1381–1382, doi:10.5194/nhess-9-1381-2009, 2009.
Sch¨one, T., Subarya, C., Manurung, P., N¨olte, C., Roemer, S., Galas, R., Illigner, J., Kloth, A., K¨oppl, M., Queisser, T., Selke, C., Stolarczuk, N., and Bartsch, M.: Offshore and onshore sea level measurements, Proceedings of the International Conference on Tsunami Warning (ICTW), Bali, Indonesia, 2008.
Sobolev, S. V., Babeyko, A. Y., Wang, R., Galas, R., Rothacher, M., Sein, D. V., Schr¨oter, J., Lauterjung, J., and Subarya, C.: Towards real-time tsunami amplitude prediction, Eos Trans. AGU, 87(37), 374–378, 2006.
Sobolev, S. V., Babeyko, A. Y., Wang, R., Hoechner, A., Galas, R., Rothacher, M., Sein, D. V., Schr¨oter, J., Lauterjung, J., Subarya, C.: 2007, Tsunami early warning using GPS-shield arrays, J. Geophys. Res., 112, B08415, doi:10.1029/2006JB004640, 2007. Steinmetz, T., Raape, U., Teßmann, S., Strobl, C., Friedemann, M., Kukofka, T., Riedlinger, T., Mikusch, E., and Dech, S.: Tsunami early warning and decision support, Nat. Hazard. Earth Sys., GITEWS Special Issue, under review, 2010.
Subarya, C., Chlieh, M., Prawirodirdjo, L., Avouac, J. P., Bock, Y., Sieh, K., Meltzner, A. J., Natawidjaja, D. H., and McCaffrey, R.: Plate-boundary deformation assosiated with the great Sumatra-Andaman earthquake, Nature, 440, 46–51, doi:10.1038/nature04522, 2006.
Tang, L., Titov, V. V., and Chamberlin, C. D.: Development, testing, and applications of site-specific tsunami inundation models for real-time forecasting, J. Geophys. Res. Oceans, 114, C12025, doi:10.1029/2009JC005476, 2009.
Titov, V. V.: Tsunami forecasting, in: The Sea, Tsunamis, Vol. 15, edited by: Bernard, E. N. and Robinson, A. N., Harvard Univer-sity Press, ISBN 978-0-674-03173-9, 371–400, 2009.
USGS: Magnitude 7.5 Southern Sumatra, Indonesia, http://earthquakes.usgs.gov/earthquakes/eqinthenews/2009/ us2009mebz/, 2009.
Wang, R., Lorenzo Mart´ın, F., and Roth, F.: Computation of defor-mation induced by earthquakes in a multi-layered elastic crustn – FORTRAN programs EDGRN/EDCMP, Comput. Geosci., 29, 195–207, 2003.
Wei, Y., Bernard, E. N., Tang, L., Weiss, R., Titov, V. V., Moore, C., Spillane, M., Hopkins, M., and Kanoglu, U.: Real-time experimental forecast of the Peruvian tsunami of Au-gust 2007 for US Coastlines, Geophys. Res. Lett., 35, 1–7, doi:10.1029/2007GL032250, 2008.
Wells, D. L. and Coppersmith, K. J.: New empirical relationships among magnitude, rupture length, rupture width, rupture area, and surface displacement, Bull. Seismol. Soc. Am., 84, 974– 1002, 1994.