Vascular Health and Risk Management
R e V i e w
Dovepress
open access to scientific and medical researchOpen Access Full Text Article
Ankle Brachial Pressure index (ABPi): An update
for practitioners
Mo Al-Qaisi1
David M Nott1
David H King2
Sam Kaddoura1
1imperial College, London, UK; 2Broomfield Hospital, Chelmsford,
essex, UK
Correspondence: Mo Al-Qaisi imperial College, Suite 280, 28 Old Brompton Road, London Sw7 3SS, UK Tel +44 7968 016 315
Fax +44 207 730 4560 email m.alqaisi@imperial.ac.uk
Abstract: Peripheral vascular disease affects some 12%–14% of the general population, and the majority of people with the disease are asymptomatic. The Ankle Brachial Pressure Index (ABPI) test is widely used by a diverse range of practitioners (in the community and hospital setting) in order to screen asymptomatic patients, diagnose patients with clinical symptoms, and to monitor patients who have had radiological or surgical intervention. This paper explains the theoretical basis of the ABPI test, as well as the relevance of the common modifications of the test. It explores the background to the quoted normal ranges for the ABPI test. It reviews the large body of literature that has developed on the association between ABPI and cardiovascu-lar risk, as well as ABPI as a predictor for cardiovascucardiovascu-lar morbidity and mortality, highlighting the evidence that can inform practice. The review looks critically at the limitations of the ABPI test, providing practitioners with an evidence-based update on the importance and challenges of standardizing ABPI methodology. This paper highlights the influence of the key technical aspects of the ABPI test that all practitioners need to consider in order to be able to make more reliable and informed management decisions based on ABPI findings.
Keywords: ankle, brachial, pressure, index, ABPI, update
Introduction
The Ankle Brachial Pressure Index (ABPI) test is widely used in the setting of peripheral vascular disease by a diverse range of practitioners. The advantages and limitations of the ABPI test are not widely understood, and this review paper aims to inform and update practice by presenting the evidence about the performance of the ABPI test, allowing practitioners to make an evidence-based interpretation of ABPI findings.
Diagnosing peripheral vascular disease:
the ABPI test
Peripheral arterial disease affects some 12% to 14% of the general popula-tion. The prevalence of peripheral arterial disease is age-dependent, reaching 10% in people aged over 60 years,1,2 and some 20% aged over 75 years.3–5 Peripheral
vascular disease is estimated to affect some 27 million people in Europe and North America.6
Unfortunately, the majority of patients are asymptomatic and undiagnosed; although intermittent claudication is the primary, and most often only, symptom, over 16 million of the patients with peripheral arterial disease are asymptomatic. Not only this, but one third of patients with symptoms do not report them to their doctor. As a result of this,
Vascular Health and Risk Management downloaded from https://www.dovepress.com/ by 118.70.13.36 on 27-Aug-2020
For personal use only.
Number of times this article has been viewed
This article was published in the following Dove Press journal: Vascular Health and Risk Management
Al-Qaisi et al Dovepress
a high-risk group of patients are underdiagnosed and receive no (or suboptimal) treatment(s) or intervention(s).7,8
The Fontaine classification provides a framework for clinical staging (from I to IV) of peripheral vascular disease.9 However, given the large number of asymptomatic
peripheral arteriopaths, relying on clinical history has a very low sensitivity for determining the presence of peripheral arterial disease. Fewer than 10% of patients with peripheral arterial disease will provide symptoms consistent with the Rose criteria for intermittent claudication.6,10 Criqui and
colleagues11 claim that a history of intermittent claudication
underestimates the presence of peripheral arterial disease by a factor of two to f ive. Similarly, Marinelli and colleagues12 claim that relying on an absent pedal pulse
also underestimates the prevalence of disease. Hirsch and colleagues13 claim that clinicians who screen patients for
peripheral arterial disease on the basis of finding a complaint of intermittent claudication will miss up to 90% of high-risk patients with the disease.
Therefore, given the limitations of relying on the clinical history or physical examination, an additional noninvasive test, the ABPI, has been widely adopted for confirmation of a clinical diagnosis of peripheral arterial disease and its quantification. The ABPI is a measure of the blood pressure in the arteries supplying legs relative to central, aortic pressure (approximated by measuring the blood pressure in the arm).
The Society for Vascular Technology14 has produced
comprehensive laboratory guidelines for the measurement of ABPI, aiming to control the methodology under clinical conditions. Similarly, Vowden and colleagues,15 Stubbing
and colleagues,16 Hiatt and colleagues,3 and McDermott
and colleagues17 try to provide comprehensive methodology
guidance for the measurement of ABPI.
In essence, ABPI is calculated by dividing the systolic blood pressure measured in the arterial conduits at the level of the ankle by the systolic blood pressure measured in the brachial artery as seen in the following equation:
Ankle systolic blood pressure Brachial systolic pressure ABPI =
The ABPI is used to assess patients for peripheral arterial disease as a fall in blood pressure in an artery at the ankle relative to the central blood pressure would suggest a stenosis in the arterial conduits somewhere in between the aorta and the ankle.
Theoretical basis of the ABPI test
The idea of comparing peripheral systolic pressure with central systolic pressure was first introduced by Winsor18 using
a mercury and rubber strain gauge method. The theoretical basis of ABPI is supported by obtaining ABPI ratios against findings in peripheral angiography,19–24 as well as from
Doppler ultrasound as gold standard.25
ABPI is claimed to be a simple, noninvasive, and reproducible test.26–28 When used in university settings,
ABPI measurements have been found to have good interobserver reliability between experienced physicians, with a reported κ-statistic of 0.77 to 1.0.29 Estimates of
intraobserver variability range from 7.3%–12% for ABPI in the hospital26,27,30,32 as well as in the community setting.31,32
Holland-Letz and colleagues33 point out that the previous
studies of reliability had only small sample sizes of patients with disease; therefore they performed a large study in “normal” (asymptomatic) elderly patients (only two with low ABPI) and, by contrast, they found no differences in mean ABPI recordings between medical and nonmedical primary care practitioners; their estimate of intra- and interobserver error was 8% and 9%, respectively.
Similarly, Endres and colleagues34 found little interobserver
variability (nearly zero) between different practitioner groups in a large study of unselected (asymptomatic) elderly patients. Well-controlled, repeat measurements of ABPI by expert practitioners are accurate enough to be used as a clinical gatekeeper in decision-making.27,30
The American Diabetes Association consensus paper35
quotes the normal range of ABPI as being 0.91–1.3. This same consensus paper claims that mild disease falls into the range of 0.7–0.9, whilst moderate ischemic disease is quoted for ratios of 0.41–0.69. Patients with mild or moderate disease will be claudicants. Ratios of less than or equal to 0.4 are quoted in severe disease, presenting clinically as critical ischemia.
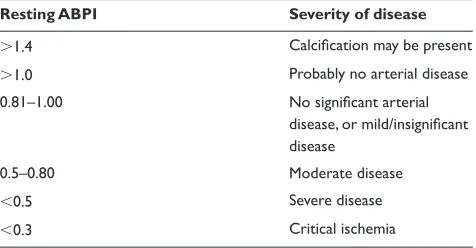
Table 1 summarizes the Society for Vascular Technology’s14
interpretation of resting ABPI measurements.
Understanding normal ranges
for the ABPI test
Neither the Society for Vascular Technology14 nor the
consensus paper35 explain how the limits of this normal
ABPI range are derived. Male and colleagues36 claim that
the majority of authors quoting ranges for ABPI refer back to original data from Yao and colleagues,22 Cornwall and
colleagues,37 and Sumner.38 They also assert that there is a
lack of evidence-based literature supporting the traditional interpretations of ABPI.
Male and colleagues36 point out that ABPI is age- and
blood pressure-dependent (and these two factors are themselves linked). The accepted methodology of ABPI does
Vascular Health and Risk Management downloaded from https://www.dovepress.com/ by 118.70.13.36 on 27-Aug-2020
Ankle Brachial Pressure index Dovepress
not make any corrections for physiological variation over time in baseline brachial systolic blood pressure, or other confounders for blood pressure measurement like respiratory phase necessitating a range to be used, rather than a point figure. It is easy to see that ABPI values over the upper limit of 1.3 may be associated with arterial incompressibility at the ankle (secondary to arterial wall medial calcification), a condition very commonly found in diabetics, renal patients, as well as a physiological function of age.14,35,39,40
It is less easy to explain why the lower limit of the normal ABPI ratio should ever be less than 1.0. In the normal individual, resting supine for at least ten minutes, the systolic blood pressure at the ankle will be slightly higher than the systolic blood pressure at the brachial artery. This is mostly due to the differences in the magnitude of pressure pulse reflections from the vascular beds immediately downstream of the ankle and elbow (ie, the vascular bed of the foot and that of the forearm and hand, respectively), but also partially because of the differences in distance between the point of measurement at the ankle and the elbow from the peripheral bed. The ankle is immediately proximal to a pressure antinode (the peripheral bed represented by the foot), whereas the elbow is one segment upstream from the analogous peripheral bed of the hand. Therefore one would assume from this that a normal ABPI ratio should be at least 1.0 or slightly more. And, in fact, Male and colleagues36 found that the mean
normal ABPI in a small sample of young, healthy patients aged twenty to forty is 1.14, with a range of 1.05 to 1.25.
Ouriel and Zarins23 found that ABPI in a group of
34 “normal” controls (asymptomatic, nondiabetic volunteers under 30 who had never smoked, and with triphasic Doppler waveforms) came to be 1.09 (±0.02 for 95% confidence windows). Carser41 claims that the normal corrected ABPI
range is 1.02 to 1.78 (admittedly, Carser was studying
ABPI ranges in the context of background hypertension). Of 100 studies of ABPI methodology included in their review, Klein and Hage42 found that the most frequently
quoted normal value for ABPI was 1.0. Hiatt and colleagues3
found the mean ABPI was 1.13 ± 0.08 (right leg) and 1.11 ± 0.09 (left leg); later, Hiatt and colleagues43 derived a set of
normal ranges for ABPI sub-classified according to sex, leg, and ankle vessel; all their data being drawn from a nondiabetic population screened to have low risk for peripheral vascular disease (men, right: dorsalis pedis 1.15 ± 0.11; posterior tibial 1.19 ± 0.12; men, left: dorsalis pedis 1.14 ± 0.10; posterior tibial 1.18 ± 0.12; women, right: dorsalis pedis 1.09 ± 0.09; posterior tibial 1.13 ± 0.08; women, left: dorsalis pedis 1.06 ± 0.10; posterior tibial 1.12 ± 0.08).
So why do the American Diabetes Association35 quote the
lower limit of ABPI as 0.91? A number of groups, in fact, quote a range of abnormal lower cut-off points of less than 1.0, from 0.80–0.98.2,3,19,44 An answer is partially deduced by looking
again at ABPI methodology.14 Although all the most
impor-tant aspects have been standardized, the respiratory phase is not controlled during measurement of ABPI. Therefore it is perfectly possible to measure the systolic pressure at the ankle at peak expiration and coincidentally measure the systolic pressure at the brachial at peak inspiration. Respiration is well known to modulate blood pressure in mammals, with limited data from normal humans in one study suggesting a 3% fall in systolic pressure during inspiration.45
As ABPI ranges are most likely the result of analyses of data from observational studies, the lower limit of 0.91 is therefore possibly a reflection of the inherent limitation of a noninvasive method of measuring blood pressure (using an occlusive cuff ) without controlling physiological variation from, for example, respiration. Beat-to-beat physiological variation in systolic blood pressure can only be controlled by synchronous measurements at the arm and ankle, which is cumbersome and not prescribed by any of the authoritative guides on ABPI measurement. Additionally, technical factors such as over-rapid deflation of the ankle cuff can also give artifactually low systolic pressure readings at the ankle.
Association between the ABPI
ratio and cardiovascular morbidity
and mortality
Having a low ABPI ratio is an independent risk factor for cardiovascular disease including fatal and nonfatal complica-tions.46,47 In addition, the lower the ABPI value, the higher
the risk of all-cause and cardiac mortality in patients with peripheral vascular disease.48
Table 1 interpretation of ABPi
Resting ABPI Severity of disease
1.4 Calcification may be present
1.0 Probably no arterial disease
0.81–1.00 No significant arterial
disease, or mild/insignificant disease
0.5–0.80 Moderate disease
0.5 Severe disease
0.3 Critical ischemia
Notes: Copyright © 2001, institute of Physics and engineering in medicine. Adapted with permission from Cole SeA. editor. Vascular Laboratory Practice (Part III). 1st ed. London, UK: iPeM; 2001. p. 36.
Abbreviation: ABPi, Ankle Brachial Pressure index.
Vascular Health and Risk Management downloaded from https://www.dovepress.com/ by 118.70.13.36 on 27-Aug-2020
Al-Qaisi et al Dovepress
The predictive value of ABPI in cardiovascular morbidity and mortality is similar to that of traditional Framingham risk factors.49 McKenna and colleagues50 evaluated a low ABPI as
an independent risk factor for mortality. Doobay and Anand51
found that low ABPI was highly specific for predicting future cardiovascular events. A recent meta-analysis found that ABPI is an independent risk factor for cardiovascular mortality alongside the traditional Framingham risk factors, and having an ABPI of 0.9 resulted in a doubling of cardiovascular mortality and morbidity across all of the Framingham risk categories; furthermore, combining ABPI with traditional Framingham risk assessment would re-classify 19% of men and 36% of women into more appropriate treatment categories.52
An ABPI ratio of less than 0.9 has been associated with up to a three-fold relative increase in all-cause and cardiac mortality, in both men and women.50,53–55
Similarly, having an elevated ABPI 1.40 (even if the observation was nondiagnostic because of arterial incom-pressibility secondary to calcification) is a predictor for an increase in all-cause mortality as well as cardiovascular mortality.56
The association between peripheral arterial disease and increased mortality is a result of the fact that the underlying pathological process, atherosclerosis, is a systemic one. Atherosclerosis, if present in the periphery, is also likely in other parts of the arterial tree. Ness and Aronow57 found
that 68% of patients with peripheral arterial disease also had coronary artery disease in an elderly population. Patients with peripheral arterial disease have more than a sixfold increase in the risk of death from coronary artery disease when compared to patients without the disease.53 Even if
patients with peripheral arterial disease are asymptomatic, they have an increased risk of future cardiac and cerebro-vascular events, as well as being six times more likely to die within ten years when compared to healthy individuals.58
A number of groups support the use of ABPI not only as a diagnostic tool, but also as a risk assessment tool in the setting of peripheral vascular disease.59–61
Modifications of the ABPI technique
The literature is replete with validations of modifications or refinements of traditional ABPI methodology or its calculation.62,63
Clinically, the most common addition to the resting ABPI is that of postexercise measurements. Carter64
claimed that exercise testing would unmask patients with mild peripheral vascular disease (ie, patients with degrees
of diameter reduction in the arteries of less than 50%). Some researchers claim that resting ABPI correlates well with functional walking capacity in patients with peripheral arterial disease.65–67 Szuba and colleagues68
out-right reject this position, claiming that only postexercise ABPI, and not ABPI itself (or other resting hemodynamic measures) has any predictive ability for or correlation with walking distance in peripheral arterial disease. The value of exercise testing (over and above resting ABPIs) was questioned by Allen and colleagues25 and Ouriel and
colleagues.44
Allen and colleagues25 compared resting and postexercise
ABPI to color Duplex ultrasound (as gold standard). When postexercise ABPI measurements were used in addition to resting ABPI, the correlation with color Duplex ultra-sound for detecting significant arterial disease increased by only 2% (from 83% for resting ABPI alone to 85% in the combined resting and postexercise ABPI method). However, the clinical utility of any exercise test is limited in bilateral disease by the most symptomatic limb in the patient; and Stein and colleagues69 point out that exercise
testing is not even an option in patients with poor mobility due to comorbidity (eg, cardiac disease, respiratory disease, or disability). Hiatt and colleagues3 estimated that at
least 15% of patients were unsuitable for exercise testing or hyperemia induction (simulating exercising with an occlusive cuff ).
Limitations of ABPI
In their original paper on ankle systolic pressures, Yao and colleagues22 claimed 98% overall accuracy (sensitivity
97%, specificity 100%) against angiography using an ABPI threshold of 1.0 as being normal. This pioneering work, preceded by that of Carter,19 assumed an ABPI
threshold of 1.0 using normal (clinically asymptomatic) volunteers as controls, rather than angiographically-proven normals.
Other papers from the same authors20,21 as well as that
from Ouriel and Zarins23 make similar claims for accuracy,
but these studies also rely on the same the type of control group (normal volunteers rather than angiographically-proven normals).
Later, Allen and colleagues,25 using color Duplex
ultrasound as the gold standard in nondiabetic patients with peripheral vascular disease, came up with an overall figure of 83% accuracy using an ABPI threshold of 0.8. This study used patients who could tolerate both a resting ABPI and an exercise ABPI. The data did not include any
Vascular Health and Risk Management downloaded from https://www.dovepress.com/ by 118.70.13.36 on 27-Aug-2020
Ankle Brachial Pressure index Dovepress
normal volunteers. Agreement with Duplex ultrasound was shown to drop in patients with higher ABPI values, down to 76% in patients with ABPIs of 0.9. At the same time, Allen and colleagues25 found 100% agreement with
Duplex ultrasound in patients with an ABPI 0.6. Allen and colleagues25 concluded that “ABPI is biased toward the
detection of more severe disease and is more consistent with colour Duplex ultrasound when the most symptomatic limbs are compared”. Therefore in the clinical setting, where it is possible to do an ABPI on patients with peripheral vascular disease, up to 17% of these ABPI tests might be unreliable.
Belch and colleagues7 point out that it is also possible
to have a high-grade aorto-iliac stenosis or occlusion clini-cally masked by a rich collateral network; in these situations, using ABPI would also fail to unmask the underlying lesion. In fact, Belch and colleagues7 highlight the wider problem
that nearly 60% of patients with peripheral arterial disease are asymptomatic, and if collateral vessels are the reason, they are likely to be unreliable candidates for identification by the ABPI test.
Stein and colleagues69 question the utility of the ABPI
test in patients with low-grade stenosis after reporting that nearly half of all patients with symptoms of periph-eral arterial disease had a normal resting ABPI. Although Stein and colleagues69 concede that some of these patients
will have intermittent claudication or ulceration from another cause, they also point out that the original studies on ABPI were limited to patients with advanced disease. Ouriel and Zarins23 did not find a significant difference
between ABPI for asymptomatic patients and patients with angiographically-proven nonocclusive disease.
At the other end of the clinical spectrum, in certain groups of patients at high risk of heavy arterial calcification, ABPI becomes impractical and nondiagnostic. For example, in elderly, diabetic and renal patients (and also other groups with rarer systemic diseases, like systemic sclerosis, or rheumatic diseases) calcification of the peripheral arteries can make the arteries incompressible, and therefore the ABPI test (relying on measurement of systolic pressure with an occlusive cuff) becomes nondiagnostic or inaccurate due to artefactually-raised occlusion pressures secondary to medial calcification in the arterial wall.70
This is all the more problematic since, in some of these subgroups of patients, peripheral arterial disease is common. Estimates of the prevalence of peripheral arterial disease in diabetic patients vary from 33% to 50%.3,71
In diabetic patients, it is not uncommon to use a pressure cuff at 300 mmHg and still fail to occlude an artery at the
ankle due to calcification and hardening of the arterial wall. Raines and colleagues72 estimated that occlusive
ankle pressures could not be measured in 5%–10% of diabetic patients. Therefore, for a group of patients with long-standing diabetes, or renal failure, presenting with peripheral vascular symptoms, and in whom ABPI is nondiagnostic, there is a need for a noninvasive, clinical alternative to ABPI for assessing the presence of significant arterial disease.
Standardizing ABPI methodology
The exact methodology of ABPI is far from standardized on a large number of technical aspects, starting with the choice of artery at the ankle. Because there are three arteries at the ankle, ABPI can be calculated in a number of ways and combinations eg, based on using the highest pressure,44,73 the lowest pressure,74 the best Doppler single,24
or a combination of ankle vessel pressures.43 The Society for
Vascular Technology allows practitioner to choose between two prescribed methods for the ankle systolic.14 Similarly,
it is possible to measure pressure in either arm, and there is no consensus position on how central pressure should be approximated from the arm pressure. Both Carter21
and Sumner38 pointed out that atherosclerosis is systemic
and can therefore affect the pressure in the upper limbs directly or indirectly via disease in the aortic arch. Grim75
pointed out that, the length of the rest period, “patient-white coat” phenomena, cuff placement, cuff size, and the speed of inflation/deflation can affect blood pressure recordings – all of which are relevant to the context of ABPI. In patients who cannot lie supine, a further inaccuracy is added by the hydrostatic pressure difference between the arm and leg.76
The definition of “resting” (as part of the resting ABPI) is also important; patients with severe multilevel arterial disease need a longer period of “rest” prior to taking systolic pressure measurements and this is difficult to know beforehand.77
Doppler probe selection (with respect to frequency, and level of quality assurance maintenance) can also be a source of inconsistency between practitioners.76
Apart from the inconvenience and difficulty of controlling a large number of environmental factors that can affect vaso-motor tone (eg, temperature) and therefore blood pressure readings, there is also an intrinsic, physiological variability found in blood pressure measurements (and their ratios, like ABPI) so that some authors have recommended multiple measurements to allow consistent longitudinal follow-up, and to dismiss changes of less than 0.15 in serial readings of the ABPI ratio.78,79
Vascular Health and Risk Management downloaded from https://www.dovepress.com/ by 118.70.13.36 on 27-Aug-2020
Al-Qaisi et al Dovepress
Interestingly, Holland-Letz and colleagues33 pointed out
that the validity of noninvasive blood pressure measurement (by whatever method) in the context of ABPI has never been assessed (eg, compared in real time against the invasive blood pressure reading in a controlled setting).
Furthermore, when measuring blood pressure using an occlusive cuff, there is a reduction in blood flow through any proximal lesion at the moment of systolic pressure measurement, thereby giving an underestimate of true rest-ing pressure drop across the lesion. Hence the occlusive cuff method on which ABPI relies is liable to underestimate the presence of peripheral arterial disease. This underestima-tion of true pressure drop is most marked when the lesion is immediately proximal to the ankle cuff.80–82
As of yet, there is no consensus agreement on the methodology for ABPI, and no vessel-specific criteria for the diagnosis of peripheral vascular disease. Carser41 found
that the ABPI ratio was influenced by whether patients had baseline hypotension or hypertension (as represented by the brachial systolic pressure), and that baseline systemic pres-sure was therefore a confounder of ABPI meapres-surement. Klein and Hage42 try to make sense of the diverse methodologies in
practice for measuring ABPI and try to synthesize a standard approach. They identify a long list of technical factors (see Table 2 below) that can confound serial ABPI values and make empirical recommendations for their standardiza-tion. They point out, rightly, that without standardization, studies using ABPI testing cannot be compared to each other adequately. And patients moving from centre to centre might find their ABPI drifts as well.83
Klein and Hage42 point out that there is no agreement
on the precise normal value (or normal range) for ABPI, not least due to methodological inconsistencies between groups; some authorities apply a lower limit of ABPI for
the absence of disease, some apply an upper limit for the presence of disease, and others still consider both these limits to be one and the same (so defining a point value for ABPI below which there is disease, and above which disease is absent). When trying to relate ABPI to symptomatic patients who complained of intermittent claudication, Yao and colleagues77 found that the ABPI varied from between
0.2 to 1.0 in these patients.
Notably, Hiatt and colleagues4 add that, in any case, all
“normal” ranges for ABPI need to be corrected for sex, order of measurement of the limbs, and which ankle vessel(s) is/are being used for the calculation.
As a result of the lack of consensus on standardization, the accuracy and repeatability of ABPI readings has certainly been questioned in the literature, especially between diseased (symptomatic) and “normal” (asymptomatic) patient groups, and for nonexpert and expert practitioners.27,84–88 Vowden
and Vowden76 surveyed nurse practitioners and found poor
understanding of the methodological requirements for accurate and reproducible ABPI measurement, as well as a lack of awareness of its limitations. It is interesting to note that ABPI has not been included in the UK Department of Health’s five-yearly screening program for vascular risk for those aged 40–74 years.89
Furthermore, ABPI has been found to be insensitive to detecting progression of atherosclerosis. In a study by McLafferty and colleagues,90 ABPI had a sensitivity of
41%, a specificity of 84%, and an overall accuracy of 68% for detecting changes in peripheral arterial disease status compared to catheter angiography and duplex ultrasound imaging (as gold standards), leading the authors to recom-mend that imaging studies are superior to ABPI to monitor the progression of peripheral vascular disease.
Conclusion
Although regarded as a routine test, a great deal of further work is required before a consensus can be reached on a standardized technique for ABPI. A practitioner should be familiar with the evidence around the theoretical basis for the ABPI test in order to make evidence-based interpretations of the results. In particular, practitioners need to be aware of the technical limitations of using ABPI and how variations in ABPI methodology can affect the findings. In certain com-mon clinical situations, for example diabetic patients with calcified ankle arteries, ABPI can give artifactual results, or be nondiagnostic altogether. In these cases, practitioners need to consider alternative tests to confirm or exclude peripheral vascular disease.
Table 2 Nonstandard aspects of ABPi measurement42
Position of patient during measurement width and level of sphygmometer cuffs
Use of Korotkoff method vs Dinamap vs Doppler probe to define systolic pressures
whether to use both brachial pressures or not in calculation of ABPi whether to use all three crural vessels, two, or just one in calculation of ABPi
whether to use highest or mean values of pressure in calculation of ABPi
Normal ranges for ABPi ratios
Abbreviation: ABPi, Ankle Brachial Pressure index.
Vascular Health and Risk Management downloaded from https://www.dovepress.com/ by 118.70.13.36 on 27-Aug-2020
Ankle Brachial Pressure index Dovepress
Disclosures
The authors report no conflicts of interest in this work.
References
1. Criqui MH, Fronek A, Barrett-Connor E, Klauber MR, Gabriel S, Goodman D. The prevalence of peripheral arterial disease in a defined population. Circulation. 1985;71(3):510–515.
2. Criqui MH. Peripheral arterial disease – epidemiological aspects. Vasc Med. 2001;6(3 Suppl):3–7.
3. Schroll M, Munck O. Estimation of peripheral arteriosclerotic disease by ankle blood pressure measurements in a population study of 60-year-old men and women. J Chronic Dis. 1981;34(6):261–269. 4. Hiatt WR, Hoag S, Hamman RF. Diagnostic methods for peripheral
arterial disease in the San Luis Valley Diabetes Study. J Clin Epidemiol. 1990;43:597–560.
5. Selvin E, Erlinger TP. Prevalence of and risk factors for peripheral arterial disease in the United States: results from the National Health and Nutrition Examination Survey 1999–2000. Circulation. 2004;110: 738–743.
6. Belch JJ, Topol EJ, Agnelli G, et al. Prevention of atherothrombotic disease network. Critical issues in peripheral arterial disease detec-tion and management: a call to acdetec-tion. Arch Intern Med. 2003; 163:884–892.
7. Dormandy JA. Epidemiology and natural history of arterial diseases of the lower limbs. Rev Prat. 1995;45:32–36.
8. McDermott MM, Kerwin DR, Liu K, et al. Prevalence and significance of unrecognised lower extremity peripheral arterial disease in general medicine practice. J Gen Intern Med. 2001;16:384–390.
9. Dormandy JA, Rutherford RB. Management of peripheral arterial disease. TASC Working Group. J Vasc Surg. 2000;31:S1–S296. 10. Rose GA. The diagnosis of ischaemic heart pain and intermittent
claudication in field surveys. Bull World Health Organ. 1962;27: 645–658.
11. Criqui MH, Fronek A, Klauber MR, Barrett-Connor E, Gabriel S. The sensitivity, specificity, and predictive value of traditional clinical evalu-ation of peripheral arterial disease: results from non-invasive testing in a defined population. Circulation. 1985;71:516–522.
12. Marinelli MR, Beach KW, Glass MJ, Primozich JF, Strandness DE. Noninvasive testing vs clinical evaluation of arterial disease: a prospec-tive study. JAMA. 1979;241:2031–2034.
13. Hirsch AT, Halverson SL, Treat-Jacobson D, et al. The Minnesota Regional Peripheral Arterial Disease Screening Program: toward a definition of community standards of care. Vasc Med. 2001;6:87–96. 14. Cole SEA. editor. Vascular Laboratory Practice (Part III). 1st ed.
London, UK: IPEM; 2001.
15. Vowden KR, Goulding P, Vowden P, et al. Hand-held Doppler assessment for peripheral arterial disease. J Wound Care. 1996;5(3): 125–128.
16. Stubbing NJ, Bailey P, Poole M. Protocol for accurate assessment of ABPI in patients with leg ulcers. J Wound Care. 1997;6(9):417–418. 17. McDermott MM, Criqui MH, Liu K, et al. Lower ankle/brachial index,
as calculated by averaging the dorsalis pedis and posterior tibial arterial pressures, and association with leg functioning in peripheral arterial disease. J Vasc Surg. 2000;32:1164–1171.
18. Winsor T. Influence of arterial disease on the systolic blood pressure gradients of the extremity. Am J Med Sci. 1950;220:117–126. 19. Carter SA. Indirect systolic pressures and pulse waves in arterial occlusive
disease of the lower extremities. Circulation. 1968;37(4):624–637. 20. Yao ST, Hobbs JT, Irvine WT. Ankle pressure measurement in arterial
disease of the lower extremities. Br J Surg. 1968;55(11):859–860. 21. Carter SA. Clinical measurement of systolic pressures in limbs with
arterial occlusive disease. JAMA. 1969;207(10):1869–1874. 22. Yao ST, Hobbs JT, Irvine WT. Ankle systolic pressure
measure-ments in arterial disease affecting the lower extremities. Br J Surg. 1969;56(9):676–679.
23. Ouriel K, Zarins CK. Doppler ankle pressure: an evaluation of three methods of expression. Arch Surg. 1982;117:1297–1300.
24. Kiekara O, Riekkinen H, Soimakallio S, Lansimies E. Correlation of angiographically determined reduction of vascular lumen with lower-limb systolic pressures. Acta Chir Scand. 1985;151:437–440.
25. Allen J, Oates CP, Henderson J, et al. Comparison of lower limb arterial assessments using color-Duplex ultrasound and ankle/brachial pressure index measurements. Angiology. 1996;47(3):225–232.
26. Johnston KW, Hosang MY, Andrews DF. Reproducibility of noninvasive vascular laboratory measurements in the peripheral circula-tion. J Vasc Surg. 1987;6:147–151.
27. Fowkes FG, Housley E, Macintyre CC, Prescott RJ, Ruckley CV. Variability of ankle and brachial systolic pressures in the measurement of atherosclerotic peripheral arterial disease. J Epidemiol Community Health. 1988;42(2):128–133.
28. Ray SA, Srodon PD, Taylor RS, Dormandy JA. Reliability of ankle-brachial pressure index measurement by junior doctors. Br J Surg. 1994;81:188–190.
29. Farkouh ME, Oddone EZ, Simel DL, et al. The clinical examina-tion for peripheral arterial disease [Abstract]. J Gen Intern Med. 1996;11(3):46.
30. Yao ST. Discussion on: variability of Doppler ankle pressures with arte-rial occlusive disease: an evaluation of ankle index and brachial-ankle pressure gradient. Surgery. 1981;89:137.
31. Stoffers J, Kaiser V, Kester A, Schouten H, Knottnerus A. Peripheral arterial occlusive disease in general practice: the reproducibility of the ankle-arm systolic pressure ratio. Scand J Prim Health Care. 1991;9:109–114.
32. Kaiser V, Kester AD, Stoffers HE, Kitslaar PJ, Knottnerus JA. The influence of experience on the reproducibility of the ankle-brachial systolic pressure ratio in peripheral arterial occlusive disease. Eur J Vasc Endovasc Surg. 1999;18:25–29.
33. Holland-Letz T, Endres HG, Biedermann S, et al. Reproducibility and reliability of the ankle-brachial index as assessed by vascular experts, family physicians and nurses. Vasc Med. 2007;12:105–112.
34. Endres HG, Hucke C, Holland-Letz T, Trampisch H. A new efficient trial design for assessing reliability of ankle-brachial index measures by three different observer groups. BMC Cardiovasc Disord. 2006;6:33. 35. American Diabetes Association. Peripheral arterial disease in people
with diabetes. Diabetes Care. 2003;26:3333–3341.
36. Male S, Coull A, Murphy-Black T. Preliminary study to investigate the normal range of ankle brachial pressure index in young adults. J Clin Nurs. 2007;16(10):1878–1885.
37. Cornwall JV, Dore CJ, Lewis JD. Leg ulcers: epidemiology and aetiology. Br J Surg. 1986;73(9):693–696.
38. Sumner DS. Non-invasive assessment of peripheral arterial occlusive disease. In: Rutherford KS, editor. Vascular Surgery. Philadelphia, PA, WB Saunders; 1989.
39. Moffat C, O’Hare BA. Ankle pulses are not sufficient to detect impaired arterial circulation in patients with leg ulcers. J Wound Care. 1995;4:134–138.
40. Whiston R. Principles of Doppler. Nursing Times. 1996;92:66–68. 41. Carser DG. Do we need to reappraise our method of interpreting the
ankle brachial pressure index? J Wound Care. 2001;10:59–62. 42. Klein S, Hage JJ. Measurement, calculation, and normal range of the
ankle-arm index: a bibliometric analysis and recommendation for standardization. Ann Vasc Surg. 2006;20(2):282–292.
43. Hiatt WR, Hoag S, Hammam RF. Effect of diagnostic criteria on the prevalence of peripheral arterial disease. The San Luis Valley Diabetes Study. Circulation. 1995;91:1472–1479.
44. Ouriel K, McDonnell AE, Metz CE, Zarins CK. A critical evaluation of stress testing in the diagnosis of peripheral vascular disease. Surgery. 1982;91:686–693.
45. Ruskin J, Bache RJ, Rembert JC, Greenfield JC. Pressure-flow studies in man: effect of respiration on left ventricular stroke volume.
Circulation. 1973;48(1):79–85.
Vascular Health and Risk Management downloaded from https://www.dovepress.com/ by 118.70.13.36 on 27-Aug-2020
Al-Qaisi et al Dovepress
46. Wild SH, Byrne CD, Smith FB, Lee AJ, Fowkes FGR. Low ankle-brachial pressure index predicts increased risk of cardiovascular disease independent of the metabolic syndrome and conventional cardiovascular risk factors in the Edinburgh Artery Study. Diabetes Care. 2006;29:637–642.
47. Heald CL, Fowkes FGR, Murray GD, Price JF. Risk of mortality and cardiovascular disease associated with the ankle-brachial index: systematic review. Atherosclerosis 2006;189:61–69.
48. Feringa HH, Bax JJJ, van Waning VH, et al. The long-term prognostic value of the resting and postexercise ankle-brachial index. Arch Intern Med. 2006;166:529–535.
49. Bhasin N, Scott DJ. Ankle Brachial Pressure Index: identifying cardiovascular risk and improving diagnostic accuracy. J R Soc Med. 2007;100:4–5.
50. McKenna M, Wolfson S, Kuller L. The ratio of ankle and arm arterial pressure as an independent predictor of mortality. Atherosclerosis. 1991;87:119–128.
51. Doobay AV, Anand SS. Sensitivity and specificity of the ankle-brachial index to predict future cardiovascular outcomes: a systematic review.
Arterioscler Thromb Vasc Biol. 2005;25:1463–1469.
52. Ankle Brachial Index Collaboration. Ankle brachial index combined with Framingham risk score to predict cardiovascular events and mor-tality: a meta- analysis. JAMA. 2008;300(2):197–208.
53. Criqui MH, Langer RD, Fronek A, et al. Mortality over a period of 10 years in patients with peripheral arterial disease. N Engl J Med. 1992;326:381–386.
54. Newman AB, Sutton-Tyrrell K, Vogt MT, Kuller LH. Morbidity and mortality in hypertensive adults with a low ankle/arm blood pressure index. JAMA. 1993;270:487–489.
55. Vogt MT, Cauley JA, Newman AB, Kuller LH, Hulley SB. Decreased ankle/arm blood pressure index and mortality in elderly women. JAMA. 1993;270:465–469.
56. Resnick HE, Lindsay RS, McDermott MM, et al. Relationship of high and low ankle brachial index to all-cause and cardiovascular disease mortality: the Strong Heart Study. Circulation. 2004;109: 733–739.
57. Ness J, Aronow WS. Prevalence of coexistence of coronary artery disease, ischemic stroke, and peripheral arterial disease in older persons, mean age 80 years, in an academic hospital-based geriatrics practice.
J Am Geriatr Soc. 1999;47(10):1255–1256.
58. Priollet P. Quality of life and peripheral arterial disease: perspectives for the future. Drugs. 1998;56(Suppl 3):49–58.
59. Sikkink CJ, van Asten WN, van ’t Hof MA, van Langen H, van der Vliet JA. Decreased ankle/brachial indices in relation to morbidity and mortality in patients with peripheral arterial disease. Vasc Med. 1997;2:169–173.
60. Newman AB, Shemanski L, Manolio TA, et al. Ankle-arm index as a predictor of cardiovascular disease and mortality in the Cardiovascular Health Study. Arterioscler Thromb Vasc Biol. 1999;19:538–545. 61. Papamichael CM, Lekakis JP, Stamatelopoulos KS, et al. Ankle-brachial
index as a predictor of the extent of coronary atherosclerosis and cardiovascular events in patients with coronary artery disease. Am J Cardiol. 2000;86:615–618.
62. Diehm C, Kareem S, Diehm N, Jansen T, Lawall H. Does calculation of ankle brachial pressure index need revision? Vasa. 2005;34(2):123–126.
63. Schroder F, Diehm N, Kareem S, et al. A modified calculation of ankle-brachial pressure index is far more sensitive in the detection of peripheral arterial disease. J Vasc Surg. 2006;44:531–536.
64. Carter SA. Response of ankle systolic pressure to leg exercise in mild or questionable arterial disease. N Engl J Med. 1972;21; 287(12):578–582.
65. McDermott MM, Liu K, Guralnik JM, et al. The ankle brachial index independently predicts walking velocity and walking endur-ance in peripheral arterial disease. J Am Geriatr Soc. 1998;46(11): 1355–1362.
66. McDermott MM, Mehta S, Liu K, et al. Leg symptoms, the ankle-brachial index, and walking ability in patients with peripheral arterial disease. J Gen Intern Med. 1999;14:173–181.
67. Green S. Haemodynamic limitations and exercise performance in peripheral arterial disease. Clin Physiol Funct Imaging. 2002;22:81–91.
68. Szuba A, Oka RK, Harada R, Cooke JP. Limb hemodynamics are not predictive of functional capacity in patients with PAD. Vasc Med. 2006;11(3):155–163.
69. Stein R, Hriljac I, Halperin JL, Gustavson SM, Teodorescu V, Olin JW. Limitation of the resting ankle-brachial index in symptomatic patients with peripheral arterial disease. Vasc Med. 2006;11:29–33.
70. Strandness DE, Bell JW. Peripheral vascular disease: diagnosis and objective evaluation using a mercury strain gauge. Ann Surg. 1965;161(Suppl):1–3.
71. Elhadd TA, Robb R, Jung RT, Stonebridge PA, Belch JJF. Pilot study of prevalence of asymptomatic peripheral arterial occlusive disease in patients with diabetes attending a hospital clinic. Pract Diabetes Int. 1999;16:163–166.
72. Raines JK, Darling C, Buth J, Brewster DC, Austen WG. Vascular laboratory criteria for the management of peripheral vascular disease of the lower extremities. Surgery. 1976;79:21–29.
73. Carter SA, Tate RB. The effect of body heating and cooling on the ankle and toe systolic pressures in arterial disease. J Vasc Surg. 1992; 16:148–153.
74. Fowkes FGR, Housley E, Cawood EHH, MacIntyre CCA, Ruckley CV, Prescott RJ. Edinburgh Artery Study: prevalence of asymptomatic and symptomatic peripheral arterial disease in the general population. Int J Epidemiol. 1991;20:384–392.
75. Grim C. Blood pressure management. In: Izzo J et al, editors.
Hypertension primer. The essentials of high blood pressure. Basic science, population science, and clinical management. 2nd ed. Philadelphia, PA: Lippincott Williams & Wilkins; 1999. pp. 295–298. 76. Vowden K, Vowden P. Doppler and the ABPI: how good is our
understanding? J Wound Care. 2001;10(6):197–202.
77. Yao ST. Haemodynamic studies in peripheral arterial disease. Br J Surg. 1970;57(10):761–766.
78. Armitage P, Fox W, Rose GA, Tinker CM, et al. The variability of measurements of casual blood pressure. II. Survey experience. Clin Sci. 1966;30:337–344.
79. Baker JD, Dix DE. Variability of Doppler ankle pressures with arterial occlusive disease: an evaluation of ankle index and brachial-ankle pressure gradient. Surgery. 1981;89(1):134–137.
80. Evans DH, Quin RO, Bell PRF. The significance of blood pressure measurements in patients with peripheral vascular disease. Br J Surg. 1980;67(4):238–241.
81. Quin RO, Evans DH, Fyfe T, Bell PRF. Proceedings: Evaluation of indirect blood pressure measurement as a method of assessment of peripheral vascular disease. Br J Surg. 1976;63(2):156.
82. Quin RO, Evans DH, Fyfe T, Bell PRF. Evaluation of indirect blood pressure measurement as a method of assessment of peripheral vascular disease. J Cardiovasc Surg (Torino). 1977;18:109–116.
83. Jeelani NUO, Braithwaite BD, Tomlin C, MacSweeney ST. Variation of method for measurement of brachial artery pressure significantly affects ankle-brachial pressure index values. Eur J Vasc Endovasc Surg. 2000;20:25–28.
84. Bernstein EF, Witzel TH, Stotts JS, Fronek A. Thigh pressure artefacts with non-invasive techniques in an experimental model. Surgery. 1981;89:319–323.
85. Franzeck UK, Bernstein EF, Fronek A. The effect of sensing site on the limb segmental blood pressure determination. Arch Surg. 1981;116:912–916.
86. Osmundson PJ, O’Fallon WM, Clements IP, Kazmier FJ, Zimmerman BR, Palumbo PJ. Reproducibility of noninvasive tests of peripheral occlusive arterial disease. J Vasc Surg. 1985;2: 678–683.
Vascular Health and Risk Management downloaded from https://www.dovepress.com/ by 118.70.13.36 on 27-Aug-2020
Vascular Health and Risk Management
Publish your work in this journal
Submit your manuscript here: http://www.dovepress.com/vascular-health-and-risk-management-journal Vascular Health and Risk Management is an international,
peer-reviewed journal of therapeutics and risk management, focusing on concise rapid reporting of clinical studies on the processes involved in the maintenance of vascular health; the monitoring, prevention and treatment of vascular disease and its sequelae; and the involvement of
metabolic disorders, particularly diabetes. This journal is indexed on PubMed Central and MedLine. The manuscript management system is completely online and includes a very quick and fair peer-review system, which is all easy to use. Visit http://www.dovepress.com/ testimonials.php to read real quotes from published authors.
Ankle Brachial Pressure index Dovepress
Dovepress
87. Simon A, Papoz L, Ponton A, et al. Feasibility and reliability of ankle-arm blood pressure index in preventive medicine. Angiology. 2000;51:463–471.
88. Matzke S, Franckena M, Albäck A, Railo M, Lepäntalo M. Ankle brachial index measurements in critical leg ischaemia – the influence of experience on reproducibility. Scand J Surg. 2003;92(2):144–147.
89. Chong P, Gerrard D, Leopold P. Health checks every five years: ankle brachial pressure index? BMJ. 2009;338:b1599.
90. McLafferty RB, Moneta GL, Taylor LM, Porter JM. Ability of ankle-brachial index to detect lower-extremity atherosclerotic disease progres-sion. Arch Surg. 1997;132(8):836–840.
Vascular Health and Risk Management downloaded from https://www.dovepress.com/ by 118.70.13.36 on 27-Aug-2020