HILBERT TRANSFORM AND RBF-KERNEL BASED SUPPORT
VECTOR
MACHINE
SYNERGY
FOR
AUTOMATIC
CLASSIFICATION OF EEG SIGNALS
Raj Vipani1, Sambit Hore2, Souryadeep Basak3 & Saibal Dutta41. INTRODUCTION
Epilepsy is a neurological disorder that is caused by the malfunctioning of the nerve cell activity in the brain and is commonly found amongst adults as well as children worldwide. This disease is characterized by recurrent seizures occurring in the brain which can be both major and minor in nature. Minor seizures occurring during activities like driving or swimming can have fatal consequences. Although the symptoms of a seizure may affect any part of the body, the electrical events that trigger the symptoms occur in the brain itself. Frequent seizures increase an individual’s risk of sustaining physical injuries and may even result in death [1]. Thus it is important to develop an efficient predictive algorithm that can analyze the Electroencephalographic (EEG) signals obtained from patients and determine the possibility of the onset of epileptic seizures hours before they occur so that requisite medical attention can be provided. The electrical activities in the brain are monitored and recorded from the surface of the brain by electrophysiological means in the form of EEG signals [2]. Epileptic seizures occur when the cortex of the brain has excessive or abnormal nerve cell activity. Being the fourth most common neurological disorder, the number of people affected by epilepsy is growing by the day at an average of 200,000 cases a year with a global total of 65 million affected subjects. With the advent of computers, the earlier used manual and intuitive techniques of visual analysis by medical personnel have become obsolete and thus it is important to employ machine learning and computer aided techniques to obtain more efficient signal analysis [3]. In comparison to spectral analysis techniques of EEG signals, Artificial Neural Network techniques have a better accuracy and they can effectively classify data, thus making it a very important tool in biological and medical applications.
In our previous work [4] we have used the absolute values of the Hilbert coefficients as the features of the EEG signals which are then used as the training and testing vectors for the KNN based classifier. In this work, we have furthered our study and presented an algorithm for the classification of EEG signals using Hilbert Transform and a RBF Kernel based Support Vector Machine. The novelty of our work lies in the facts that only 10% of the overall data has been used to train the support vector machine. Secondly, there has not been any reported work that has used Hilbert Transform followed by statistical methods for the purpose of extracting features from the original EEG signals. In this study, it has been found that higher average classification accuracy has been achieved in comparison to our previous work [4] even after decreasing the amount of data used to train the classifier. The use of comparatively less amount of data for training purposes is important as it reduces the overall computational time. Another key feature of our proposed methodology is that in the process of creating the training and testing dataset, the signals chosen for each have been selected at random from the respective sets thus giving a generalized performance.
1 Department of Electrical Engineering, Heritage Institute of Technology, Kolkata, India 2
Department of Electrical Engineering, Heritage Institute of Technology, Kolkata, India 3 Department of Electrical Engineering, Jadavpur University, Kolkata, India
4 Department of Electrical Engineering, Heritage Institute of Technology, Kolkata, India
Abstract: This paper presents a machine learning approach for the development of a computer aided Radial Basis Function kernel based Support Vector Machine (SVM) used to analyze and classify EEG signals. The algorithm proposed in this work is used to achieve timely and accurate detection of the onset of epileptic seizures. As the brain’s electrical activity is composed of numerous signals with overlapping characteristics, it is important to develop a non-invasive method so that epileptic patients receive proper medical attention hours before the seizures occur. In this paper, a feature extractor is developed which is combined with a RBF Kernel based Support Vector Machine to classify epileptic subjects from healthy subjects. Analysis of real time EEG signals is simplified by using the Hilbert Transform which converts the signals into analytic signals. The proposed algorithm is developed using the MATLAB software and the average accuracy of classification is obtained to be 93.89%.
Keywords: EEG Signals, Hilbert Transform, Support Vector Machine
Hilbert Transform And Rbf-Kernel Based Support Vector Machine Synergy For Automatic Classification Of Eeg Signals-023
The paper has been divided into 8 sections. Section II explains the dataset used for training and testing the algorithm. Section III and IV present the algorithm proposed and the features extracted from the signals to classify the data and detect the epileptic signals. Sections V and VI shed light on the principle of Hilbert Transform and the working of a Support Vector Machine. The results obtained after extensive testing have been presented in Section VII of this paper.
2.ACCQUISITIONOFEEGSIGNALS
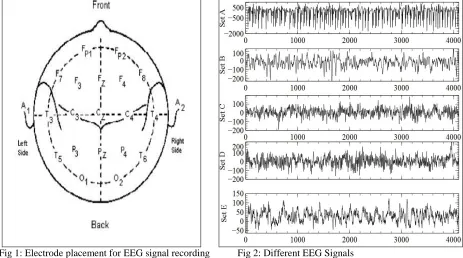
In this paper, we have worked on EEG signals obtained from a publicly available database [5]. The signals are obtained from 100 single channels of a 128 channel pre amplified system. The data is then sampled with 12 bit resolution at 173.61 samples per second with a band pass filter at 0.53 – 40 Hz setting. The placement of the electrodes for the recording of EEG signals has been shown in fig 1. Here, five sets of signals namely Set A, Set B, Set C, Set D and Set E are considered, each having its unique significance. Both Set A and Set B are surface EEG recordings of healthy persons, while the rest are reports obtained from epileptic patients. The EEG signals of Set A were recorded when the subject’s eyes were open while Set B was recorded with the subject’s eyes closed. Set C was recorded from the hippocampal formation of the opposite hemisphere of the brain, and Set D, from the epileptogenic zone of the brain. Both Set C and D were obtained from five epileptic patients, in their seizure-free periods. Set E, on the other hand, was obtained from the epileptogenic zone of the patient's brain during a seizure while displaying ictal activities. The five sets of EEG signals have been shown in the Fig. 2. The signals in sets A and B are recorded extra-cranially whereas sets C, D and E are intracranial recordings.
Fig 1: Electrode placement for EEG signal recording Fig 2: Different EEG Signals
In our work, we aim at a technique to detect epilepsy using a RBF kernel based Support Vector Machine (SVM). The results have been tested on Set A and Set E of the used database.
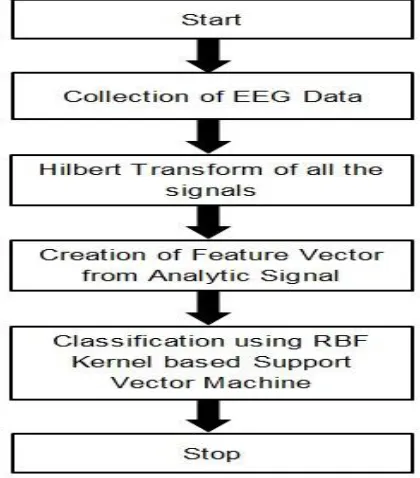
3.PROPOSEDMETHODOLOGY
Fig 3: Flowchart of the proposed methodology
4.FEATUREEXTRACTION
Selection and extraction of features is a very critical step in problems related to classification of data. Features are the representation of the original data in a form that helps us with classifying the data into categories. Here, we take the first 100 absolute values of each signal after applying the Hilbert Transform to it and then 5 of the features described below are extracted for both sets containing data from healthy subjects with their eyes open and from epileptic subjects. The five features extracted:
F1: Mean of the absolute valued analytic signal. It is computed as:
1
𝑁 𝑥[
𝑁
𝑛 =1 𝑛]
(1)
F2: Median of the absolute valued analytic signal. F3: Variance of the absolute valued analytic signal.
F4: Root Mean Squared value of the absolute valued analytic signal. It is computed as:
1
𝑁 |𝑥 𝑛 |2
𝑁
𝑛=1
(2)
F5: Centroid of the absolute valued analytic signal. It is computed as:
𝑁𝑛=1𝑛 ∗ 𝑥[𝑛]
𝑁𝑛=1𝑥[𝑛]
(3)Where, x[n] is the Hilbert Transformed analytic signal.
5. HILBERT TRANSFORM
The basic property of Hilbert Transform is to convert a real signal u(t) into another real signal û(t) having a phase shift of π/2 radians with the help of a phase shift operator. The sum of the real signal u(t) and its Hilbert Transform û(t) multiplied by an imaginary number i results in an analytic signal, whose Fourier Transform gives us a one sided spectrum in the frequency domain.
Hilbert Transform is applicable to only those signals which are Fourier Transformable. In Fourier Transform, a real signal in its time domain can be transformed into its complex counterpart in the frequency domain. This is done by representing any periodic or aperiodic non-sinusoidal signal into its orthogonally related sinusoidal harmonics which form the basis functions of the vector representation of the signal. By this representation, we develop a method to separate the signals. In Hilbert Transform, we get this separation by using a phase shift operator, where we use phase shifts between the signals on the basis of phase selectivity to get the required separation.
Hilbert Transform And Rbf-Kernel Based Support Vector Machine Synergy For Automatic Classification Of Eeg Signals-025
û(t)=
1𝜋
𝑃
𝑢(𝜏) 𝑡 −𝜏
∞
−∞
𝑑𝜏
(4)Where P denotes the Cauchy principal value of the integral.
The Fourier Transform of a signal u(t) is given by [7]
U(ω) = 𝑢(𝑡)𝑒∞ −𝑖𝜔𝑡𝑑𝑡
−∞ (5)
Let us consider a function Mf (ω) which is 2*U(ω) for all positive frequencies and zero for all negative frequencies:
𝑀𝑓𝜔 = 𝑈𝜔 + 𝑠𝑔𝑛𝜔 𝑈(𝜔) (6)
Where,
sgn(ω)=
1 𝑓𝑜𝑟 𝜔 > 0 0 𝑓𝑜𝑟 𝜔 = 0
−1 𝑓𝑜𝑟 𝜔 < 0 (7)
The inverse Fourier Transform of Mf (ω) is therefore written as
𝑀𝑓𝑡 =
1
2𝜋 𝑀𝑓𝜔 𝑒
𝑖𝜔𝑡𝑑𝜔
∞
−∞ (8)
= 𝑈(𝜔)𝑒𝑖𝜔𝑡𝑑𝜔
∞
0 (9)
𝑀𝑓𝑡 = 𝑢𝑡 + 𝑖𝑔(𝑡) (10)
From (6), (8) and (9) we get g(t) which is the Hilbert Transform of u(t). Alternatively g(t) is the inverse Fourier Transfor m of (-i*sgn(ω))U(ω). Therefore we can express g(t) as:
g(t)= û(t)= H(u(t)) = 1
𝜋𝑃 𝑢(𝜏)
𝑡−𝜏
∞
−∞ 𝑑𝜏 (11)
Where,
H(𝜔)=−𝑖 = 𝑒−
𝑖𝜋
2 𝑓𝑜𝑟 𝜔 > 0
𝑖 = 𝑒𝑖𝜋 /2 𝑓𝑜𝑟 𝜔 < 0
(12)
Here H(ω) is called the Hilbert multiplier or phase shift operator which introduces a ±π/2 phase shift in the signal.
6. SUPPORT VECTOR MACHINE
Support Vector Machines (SVMs), or support vector networks, are supervised learning models with associated machine learning algorithms, used for nonlinear classification and regression analysis. A SVM model can be thought of as a representation of all the samples in an n-dimensional space. The mapping is so done that the samples belonging to different categories or classes are separated by a gap as wide as possible. The rudimentary premise of the SVM is to build a model which can successfully classify samples into one category or another, given a set of training samples marked according to the category they fall under. Subsequently, the need for a supervised classifier was established, to achieve maximum generalization ability on being trained through minimum data sets.
Fig 4: Classification of two linearly separable classes by the OSH
Let us assume a linearly separable data set (xi, yi), where xi is the n-dimensional feature vector, yi is the corresponding target variable and i varies between 1 and n. The feature vectors corresponding to the target class y=1 belong to the positive class (class 1) while those with corresponding target class y = -1, belong to the negative class (class 2).
The equation of the hyper-plane is,
𝑔(𝑥) = 𝜔. 𝑥 + 𝑏
(13)Where ω is the weight vector and b is a constant such that, 𝑔𝑥 ≥ 1 ∀ 𝑥 ∈ 𝑐𝑙𝑎𝑠𝑠 1
𝑔𝑥 ≤ −1 ∀ 𝑥 ∈ 𝑐𝑙𝑎𝑠𝑠 2 (14)
This can be further generalized as
𝑦𝑖* ( 𝜔. 𝑥 + 𝑏) ≥ 1 (15)
Let z be the margin on each side of the hyper-plane. Then
𝑧 = 𝑔𝑥
|𝜔| =
1 |𝜔|
(16)
Total separating margin is computed as:
ρ
=
|𝜔|1+
1|𝜔 |
=
2|𝜔 | (17)
The separating margin can also be expressed as a function of hyperplane parameters ω and b as 𝜌ω, b = min
[x:y=1]
x. 𝜔
|𝜔 |− max x:y=−1
x. 𝜔
𝜔 =
2
|𝜔| (18)
Thus, we need to minimize φ(ω) = 0.5|ω|2 to maximize the separating gap. We perform this nonlinear optimization task by the Karush-Kuhn-Tucker (KKT) conditions using the Lagrangian multiplier L.
𝐿 = 𝜔
2
2 − 𝛼𝑖 𝑦 𝑖 𝜔 . 𝑥 𝑖+ 𝑏 − 1 𝑛
𝑖=1 (19)
Now,
𝜕𝐿
𝜕𝜔 = 0 𝑔𝑖𝑣𝑒𝑠 𝜔 = 𝛼𝑖 𝑦𝑖𝑥𝑖
𝑛
𝑖=1 (20)
and, 𝜕𝐿
𝜕𝑏= 0 𝑔𝑖𝑣𝑒𝑠 𝛼𝑖𝑦 𝑖
𝑛
𝑖=1
= 0
(21)
However, most real-world problems are found not to be linearly separable. In such situations, the goal is to separate the training cases with the least error. This can be mathematically represented by a non-negative variable Ɛi ≥ 0 to minimize the functional as:
𝜙𝜔 = Ɛ 𝑖𝛼𝑖 𝑛
𝑖=1 (22)
Hilbert Transform And Rbf-Kernel Based Support Vector Machine Synergy For Automatic Classification Of Eeg Signals-027
Ɛ 𝑖≥ 0 ∀ 𝑖 (23)
For appreciably small values of α, represents the sum of training errors. Therefore minimization of the same will lead to a minimization of training errors [10].
The non-linear, inseparable sets can be separated using a technique called the kernel trick. Kernels are functions which transform low dimensional input space into higher dimensional space. The hyper-plane is then constructed in that space. Some popular Kernel functions include the linear kernel, the polynomial kernel, the RBF Kernel [11].
The main advantage of this method is that it scales the training data set size and not the dimension of the feature space [12]. SVM works efficiently with high dimensional spaces, even when the number of dimensions is greater than the number of samples. Using a subset of training points in decision function makes it memory efficient and selecting hyper-planes to maximize the separating margin increases robustness.
7. RESULTS AND DISCUSSIONS
In this work, we use a Radial Basis Function (RBF) kernel based Support Vector Machine (SVM) to classify EEG signals obtained from healthy subjects with their eyes open and subjects displaying epileptic and ictal activity. The SVM has been optimized for Kernel parameters C and γ. The RBF kernel is mathematically expressed as:
𝐾𝑥, 𝑥′ = 𝑒−𝛾 | 𝑋−𝑋′|2
(24)
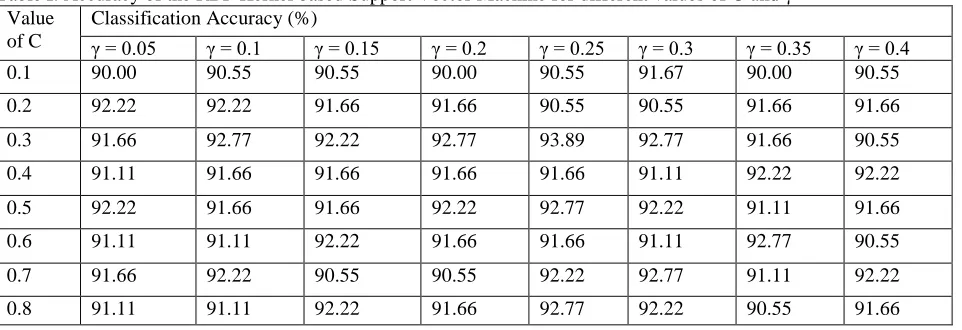
A linear hyperplane classifies the input vectors, which have been projected into an infinite dimensional feature space by the RBF kernel. We have created a training vector to train the Support Vector Machine by taking 10 signals from each of Set A and Set E of the used EEG database [5] and then the proposed algorithm is tested using a testing vector created from the remaining 90 signals from each of Set A and Set E. Table I shows the different accuracies averaged over 10 runs for different values of C and γ. It is seen that the best average accuracy of 93.89% is obtained for C = 0.3 and γ = 0.25. This classification accuracy is higher than that obtained in Vipani et al. [4], which reported an accuracy of 91.33%. The use of statistical functions as the features of the original EEG signals decreases the overall size of the training and testing vectors by 16 times, as only 5 features have been used in this work whereas 80 features had to be used in [4]. Also, in comparison to the 25 signals used in [4] to train the classifier, only 10 signals are used in this work for the same purpose and still a better average classification accuracy can be achieved.
Table I: Accuracy of the RBF Kernel based Support Vector Machine for different values of C and γ Value
of C
Classification Accuracy (%)
γ = 0.05 γ = 0.1 γ = 0.15 γ = 0.2 γ = 0.25 γ = 0.3 γ = 0.35 γ = 0.4
0.1 90.00 90.55 90.55 90.00 90.55 91.67 90.00 90.55
0.2 92.22 92.22 91.66 91.66 90.55 90.55 91.66 91.66
0.3 91.66 92.77 92.22 92.77 93.89 92.77 91.66 90.55
0.4 91.11 91.66 91.66 91.66 91.66 91.11 92.22 92.22
0.5 92.22 91.66 91.66 92.22 92.77 92.22 91.11 91.66
0.6 91.11 91.11 92.22 91.66 91.66 91.11 92.77 90.55
0.7 91.66 92.22 90.55 90.55 92.22 92.77 91.11 92.22
0.8 91.11 91.11 92.22 91.66 92.77 92.22 90.55 91.66
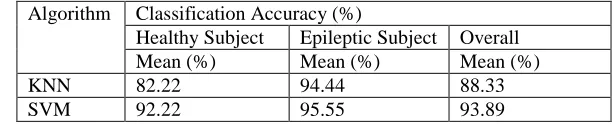
Table II shows the confusion matrix for the best-obtained average accuracy of classification being 93.89%. The results of classification using a RBF Kernel based Support Vector Machine was also compared with a K Nearest Neighbor (KNN) algorithm based classifier, which has been shown in Table III.
Table II: Confusion Matrix for a classification accuracy of 93.89% where C = 0.3 and γ = 0.25
Actual Class Predicted Class
Healthy Subject Epileptic Subject
Healthy Subject 83 7
Table III: Performance comparison between KNN based classifier and RBF Kernel based SVM
8. CONCLUSION
Through this work, we have proposed a general algorithm to classify EEG signals using Hilbert Transform and a Radial Basis Function (RBF) kernel based Support Vector Machine (SVM). We have tested the algorithm by performing a binary classification between healthy subjects with their eyes open and subjects displaying epileptic seizures. The algorithm can further be generalized for all five sets of data in the EEG signal database [5] used in this paper. The methodology proposed in section III of this paper was modeled using MATLAB and on performing extensive tests, the average accuracy of classification was found to be 93.89%
REFERENCES
[1] Ali Shoeb, John Guttag “Application of Machine Learning To Epileptic Seizure Detection”, Massachusetts Institute of Technology, 2010.
[2] Subasi, Abdulhamit. "EEG signal classification using wavelet feature extraction and a mixture of expert model." Expert Systems with Applications 32.4 (2007): 1084-1093.
[3] Subasi, Abdulhamit, et al. "Neural network classification of EEG signals by using AR with MLE preprocessing for epileptic seizure
detection."Mathematical and Computational Applications 10.1 (2005): 57-70.
[4] Vipani, R., Hore, S., Basak, S., & Dutta, S. (2017, August). Detection of epilepsy using Hilbert transform and KNN based classifier. In Smart Technologies and Management for Computing, Communication, Controls, Energy and Materials (ICSTM), 2017 IEEE International Conference on (pp. 271-275). IEEE.
[5] Andrzejak, Ralph G., et al. "Indications of nonlinear deterministic and finite-dimensional structures in time series of brain electrical activity: Dependence on recording region and brain state." Physical Review E 64.6 (2001): 061907.
[6] Johansson, Mathias. "The hilbert transform." Mathematics Master's Thesis. Växjö University, Suecia. Disponible en internet: http://w3. msi. vxu. se/exarb/mj_ex. pdf, consultado el 19 (1999).
[7] Tarun Kumar Rawat, Signals and Systems, Oxford University Press, 2010.
[8] V. Vapnik. Estimation of Dependences Based on Empirical Data [in Russian]. Nauka, Moscow, 1979.(English translation: Springer Verlag, New York,
1982).
[9] Vapnik, Vladimir N. "An overview of statistical learning theory." IEEE transactions on neural networks 10.5 (1999): 988-999.
[10] Sengupta, Sourya, Debarshi Chanda, Anirjit Mitra, and Saibal Dutta. "Computer aided technique for Epilepsy classification using cross wavelet transform and RBF-kernel based support vector machine." In Next Generation Computing Technologies (NGCT), 2016 2nd International Conference on, pp. 501-505. IEEE, 2016.
[11] Scholkopf, Bernhard, and Alexander J. Smola. Learning with kernels: support vector machines, regularization, optimization, and beyond. MIT press,
2001
[12] Fine, Shai, and Katya Scheinberg. "Efficient SVM training using low-rank kernel representations." Journal of Machine Learning Research 2.Dec (2001): 243-264
Algorithm Classification Accuracy (%)
Healthy Subject Epileptic Subject Overall
Mean (%) Mean (%) Mean (%)
KNN 82.22 94.44 88.33