Logo Matching Technique Based on Principle
Component Analysis
Sami M. Halawani
1and Ibrahim A. Albidewi
2Faculty of Computing and Information Technology
King Abdulaziz University, Saudi Arabia
1
[email protected], [email protected],
2[email protected], 2[email protected]
Abstract
--
Of the problem areas, the domain of matching complex objects has received, by far, the most attention. This research work is concerned with the specific class of complicated objects, i.e. logo. The progress, particularly in this field, is still at extensive research work level, due to infinite varieties of shapes and classes which are used. Essentially, the algorithm proposed is based on Principle Component Analysis (PCA) approach. In this technique, the PCA is used to extract the features, kept inherent in the normalized pattern for later matching process. In the matching process, the extracted features of unknown pattern are mapped onto formulated feature spaces, and the distance between the source symbol and modeled symbols is used as a decision making tool. The true matching rate of 100% has been achieved for hundreds tested logos.Index Term
--
ex Object Matching, Feature Extraction, Principle Component analysis, Euclidean Distance1. INT RODUCT ION
The work described in this research work is concerned with the specific area pattern recognition, i.e. logo identification. In this case, the input is the image of logo and the output is descriptive information used for their matching problem. A registered logo is unique to a company or institution and is a legal symbol used for example, for the identification of a company's products. Many people and organizations deal with logos, either in business or in mass communication.
A logo is a complicated object. By complicated object, one means an object which consists of a number of separated components, inner holes, or a combination of both. That is, a complicated object can be represented as a collective set of self-closed contours each of which contains a large number of critical points. Critical points are positions in high curvature regions that are eligible to be distorted by the blurring and under sampling effects of the scaling. Thus, if a change in size is involved, the number of contours can be significantly changed and most of the critical points will eventually disappear. It is particularly a complex problem of great interest in image understanding. This problem is made difficult by the seemingly infinite varieties of shapes and classes which are used. The difficulties are related to absolute shape measurement, given the impossibility of directly mapping shapes, as such, into a feature space. However, shape differences (or similarities), i.e. relative shape measurements,
can be mapped into a feature space, and are mathematically tractable. Unfortunately, there is, as yet, no technique of general validity to measure shape similarity.
2. PROBLEM BACKGROUND
There exists a vast amount of literature on shape comparison, but unfortunately the majority of the proposed methods are inappropriate for classes of objects as large and complex as logos, which are the objects of interest in this paper. A search of literature has found very few previous attempts to solve either of the problems of understanding or matching logos [1, 2, 3, 4]. Many researchers have focused their studies on a single solid shape in one representation for the image identification problem, as reported in the following. In the case of logo, it is a combination of many representations. Thus, it deserves a great attention in pattern recognition.
the number of features small for easy computation [10].
3. THE PROPOSED TECHNIQUE
As mentioned in the previous introductory section, the algorithm developed here is based on discrete Karhunen-Loeve transform. This transform is composed of eigenvectors of the covariance matrix of the referenced logo images, to be coded. Thus, the developed classification, in other words is based on statistical properties of vector representatio n. Hence, the original image must be regarded as a vector rather than a matrix.
The following steps illustrate the entire procedures of the proposed algorithm.
Let us suppose that a continuous logo image
f
x
;
y
isapproximated by equally-spaced sample arranged in the form of an
N
N
array.Each pattern is then transformed to a 1-Dplane or an image vector,
X
k
;where k is a vector's index.Let
X
(
k
)
f
(
x
,
y
1),
f
(
x
,
y
2),...,
f
(
x
,
y
N)
(1)where
k
1
,...,
N
N
be a row vector composed of lines of the original image (4.1) examined in the normal raster pattern.
k
X
can be summarized as follows,
X
k
f
1
,
1
,
f
J
,
2
,...,
f
l
,
N
,
f
2
,
1
,
f
N
f
N
N
f
2
,
2
,...,
2
,
,...
,
(2)In order to estimate the correlation among the entire logo samples, we need to define their covariance of the image vector population. Let
Q
be the number of logo samples. The covariance matrix can be expected by the deviations taken about the mean, M defined as
T
i
i
k
X
k
M
k
X
E
C
(3)where
i
1
,
2
,...,
Q
,k
J
,
2
,...,
N
N
andT
indicates vector transposition.For
Q
vector samples from a logo population, the mean vector and covariance matrix can be approximated from the samples by
Q j jk
X
Q
k
M
11
(4)for
k
1
,
2
,...,
N
2and
Q i T T ii
k
X
M
k
M
k
X
Q
C
11
(5)C
is a matrix of orderN
2
N
2.The forward Karhunen-Loeve transform is the orthogonal matrix composed of the eigenvectors of the covariance matrix,
C
arranged such that2
....
2
1
N
are the eigenvalues of (
C
) arranged in descending order. The major problem associated with the use of the Karhunen-Loeve transform is that a great amount of computation must be performed. For example, the size of covariance matrix and eigenvalues (6) will be900
900
forthe image matrix of
30
30
. However, it is found that a large entry of eigenvalues carries no meaning as their values are all zero for the index greater than (Q
1
). Thus, it is essential to seek a lower dimensional system to avoid the unnecessary matrix expansion that causes a lengthy computation and a large storage allocation.3.1 The Proposed Method of Reducing a Covariance Matrix
An alternative and easy way to overcome this problem is
by constructing the so called
'
L
'
matrix of orderQ
Q
. Theconstruction of
L
matrix's algorithm is described as follows.Let
Y
be a matrix of orderN
2
Q
, consists of deviationvectors of
y
1that is the deviation between each original logo and the mean logo vector.
2 2 2 2 1 2 1 2 1...
...
...
...
...
...
...
...
...
...
...
...
...
2
...
2
2
1
...
1
1
N
y
N
y
N
y
y
y
y
y
y
y
Q Q Q(6)
where
j
X
j
M
j
y
i
i
,i
1
,
2
,...,
Q
, 2,...,
2
,
1
N
j
The new covariance matrix,
L
of the deviation vectors y,is,
Y
Y
Q
L
1
T (7)It is apparent from Eq. (7) that
1
/
Q
is a multiplyingis just to scale their values. It can then be deleted and
Eq. (7) is modified to be,
Y
Y
L
T (8)In this way, finding a set of
n
orthonormal eigenvectors and the associated eigenvalues is always possible since L is real and symmetric [11], where the size is now reduced from order2 2
N
N
toQ
Q
In practice, the number of classes,Q
will be much smaller than
N
2
2
N
Q
. Lete
i andQ
i
i
,
1
,
2
,...,
, be the eigenvectors and correspondingeigenvalues of
L
, arranged (for convenience) in descending order so that
1
2
...
Q .LetA
be the matrix whoserows are formed from the eigenvectors of
L
, ordered so that the first row ofA
is the eigenvector corresponding to the largest eigenvalue, and the last row is the eigenvector corresponding to the smallest eigenvalue.Let us suppose that
U
is a transformation matrix thatmaps the
X
'
s
into vectors denoted byw
'
s
, the Karhunen-Loeve transformation is simplified as follows [11],)
(
X
M
U
W
(9)where
X
is a referenced image vector (Eq. 2),M
is a referenced mean vector (Eq. 4).Since matrix
U
provides an alternative coordinate system in which to describe the logo profiles, then it is called 'eigenprofiles'. Eq. (9) will give the unique representation of each member, called 'weights' and the corresponding weight is computed using a redefined equation of Eq. (10),
Qj
j j i
l
k
U
y
k
W
1
,
(
)
)
(
(10)where
i
1
,
2
,...,
Q
,j
1
,
2
,...,
N
2and
U
i,j is the eigenvector component ofL
.3.2 Reconstruction and Recognition Algorithms
Another important property of the Karhunen -Loeve transforms deals with the reconstruction of
x
fromy
.Because the rows of
U
are orthonormal vectors,U
1
U
T and any vector X can be recovered from its corresponding y by using the relation [11],M
W
U
X
iT,j
(11)where
i
,
j
1
,
2
,...,
Q
.Since the logos can be reconstructed using the projection weights, then they are used as a characteristic feature for the
identification purpose.
In the recognition stage, the unknown pattern
x
uis firstprojected into eigenprofile space (Eq. 10) to obtain
W
ui,(weighting coefficients of the unknown input), for
Q
i
1
,
2
,...,
. The well known method for having the best description of the given logo profile is to find the classk
,which has the minimum Euclidean distance
d
k betweenW
uiand
W
ki using
Qi
ki ui
k
W
W
d
1|
|
(12)for
k
1
,
2
,...,
Q
.4.
EXPERIMENTUsing the prescribed technique in section 2, 260 logos were scanned and each of them was converted into 1-D image vector for identification purposes. The scanned image is set to a fixed size of
256
256
pixels. Out of 260 logos, 70 logos with image resolution of 75 dpi were kept as referenced logos. Some of the remaining logos, with various scannin g resolutions, i.e. 75, 150, 200 dpi were used for testing. All scanned images were then put into pre-processing and normalization processes. Since the size of each scanned image is quite large (256
256
= 65536 KB), the normalized image should be reduced into a more practical size.For this reason, the largest size of image's frame among those scanned was first determined. The experiment is conducted in the following steps:
Step 1: Feature Selection Process
Using Eq. (2), convert the scanned 2-D images into 1-D
representation.
Calculate the reduced covariance matrix of ten deviation vectors (since there are ten logos, Fig. 1), i.e.
L
matrix using Eq. (8). Table I shows theL
'
s
matrix values of 10 by 10.Fig. 1. List of ten tested logos
*
006
0
1
.
e +
L =
(a) (b) (c) (d)
(e) (f)
(g) (h)
TABLE I
COVARIANCE MATRIX,
L
4.2520 0.9472 -0.3588 0.1461 0.1942 -1.9050 -0.0505 -0.0707 0.8951 -0.8355 -0.9472 -7.1316 1.9195 -0.9279 -0.6650 1.2245 -0.1098 1.3449 -1.2439 -0.2985 -0.3588 1.9195 -5.3234 0.3728 -0.5688 -0.6736 -0.2900 -0.6516 -0.0319 -1.1740 -0.1461 0.9279 -0.3728 -4.9597 0.4601 1.8853 -0.0594 0.1066 1.0334 -1.5124 -0.1942 -0.6650 0.5688 -0.4601 4.8973 1.9053 -0.1911 -0.0370 -1.5133 -1.6128 -1.9050 -1.2245 -0.6736 -1.8853 -1.9053 -9.8202 1.3368 -1.3624 -0.4475 0.0251 0.0505 -0.1098 0.2900 -0.0594 0.1911 -1.3368 -4.6766 0.6503 -1.2005 -1.1266 -0.0707 1.3449 -0.6516 -0.1066 0.0370 -1.3624 -0.6503 -5.3326 0.6513 -0.8123 -0.8951 -1.2439 -0.0319 -1.0334 -1.5133 -0.4475 1.2005 -0.6513 -7.6641 1.5422 -0.8355 -0.2985 -1.1740 -1.5124 -1.6128 -0.0251 1.1266 -0.8123 -1.5422 -8.8893
Calculate Eigenvectors, V and Eigenvalues, D of
L
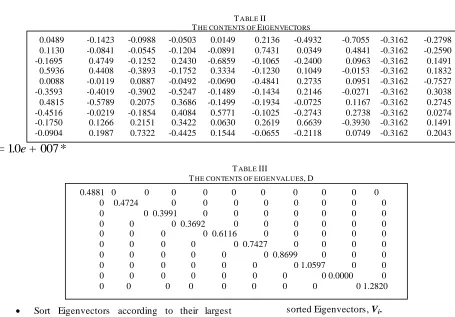
matrix. Table II and III depict the contents ofthe respective eigen set.
TABLE II
THE CONTENTS OF EIGENVECTORS
D
=
1
.
0
e +
007
*
TABLE III
THE CONTENTS OF EIGENVALUES,D
Sort Eigenvectors according to their largest associated values in D. Table IV shows the new
sorted Eigenvectors, Vi.
0.4881 0 0 0 0 0 0 0 0 0 0 0 0.4724 0 0 0 0 0 0 0 0 0 0 0.3991 0 0 0 0 0 0 0 0 0 0 0.3692 0 0 0 0 0 0 0 0 0 0 0.6116 0 0 0 0 0 0 0 0 0 0 0.7427 0 0 0 0 0 0 0 0 0 0 0.8699 0 0 0 0 0 0 0 0 0 0 1.0597 0 0 0 0 0 0 0 0 0 0 0.0000 0 0 0 0 0 0 0 0 0 0 1.2820
TABLE IV
THE NEW SORTED EIGENVECTORS,VI
Using Eq. (10), construct the referenced pattern weighting coefficients which are representing the feature vector of each referenced logo symbol. Table
V shows the nine
Q
1
weighting coefficients ofeach referenced symbol as their prescribed feature vector,
W
; going from logo (a) to (j) respectively.*
003
0
1
.
e +
F =
TABLE V
THE FEATURE VECTOR OF EACH REFERENCED SYMBOL,
W
;GOING FROM LOGO (A) TO (J) RESP ECTIVELY
Step 2:
Identification Process
To evaluate the effectiveness of the proposed recognition algorithm, ten similar logos with different sizes, positions, and resolutions were tested.
Firstly, compute the deviation vector of the unknown logo from the referenced logos' mean, using Eq. (6).
Secondly, use this deviation vector to get its weighting coefficients by projecting these values onto the Eigenprofiles space using Eq. (10).
Finally, use the Euclidean distance to detect the minimum distance of the recognizable logo by using the Eq. (12). Table VI shows the computed Euclidean's distance of each unknown with respect to each referenced logos.
The underlined figures in Table VI indicate the minimum value of Euclidean's distance that describes which one of the referenced logos is similar to the prescribed unknown. The results from the above table show that all the unknowns matched their respective referenced logos perfectly.
The same prescribed procedures were applied to the
seventy classes of referenced logos, and one hundred and ninety logos were tested in the similar way. In order to investigate whether test sets at different scaling, translations, and resolutions could affect the recognition performance; a number of experiments were identified. In this evaluation, the aim is to check whether or not, the proposed technique is sensitive to noises; where this is the most talked-about subject in image processing and pattern recognition. The less the noises in the pattern, the better the recognition is.
The experiments that had been identified were as follows:
i). Investigating whether manually generated symbols at different scales, and locations; but with the same resolution as the references, would affect the ability to recognize.
ii). Examining whether test sets at the same resolution as the reference sets, but at different scales and locations would deteriorate the recognition rate. Consequently, seventy logos were scanned at 75dpi as the referenced
-0.2798 -0.7055 -0.4932 0.2136 0.0149 0.0489 -0.1423 -0.0988 -0.0503 -0.3162 -0.2590 0.4841 0.0349 0.7431 -0.0891 0.1130 -0.0841 -0.0545 -0.1204 -0.3162 0.1491 0.0963 -0.2400 -0.1065 -0.6859 -0.1695 0.4749 -0.1252 0.2430 -0.3162 0.1832 -0.0153 0.1049 -0.1230 0.3334 0.5936 0.4408 -0.3893 -0.1752 -0.3162 -0.7527 0.0951 0.2735 -0.4841 -0.0690 0.0088 -0.0119 0.0887 -0.0492 -0.3162 0.3038 -0.0271 0.2146 -0.1434 -0.1489 -0.3593 -0.4019 -0.3902 -0.5247 -0.3162 0.2745 0.1167 -0.0725 -0.1934 -0.1499 0.4815 -0.5789 0.2075 0.3686 -0.3162 0.0274 0.2738 -0.2743 -0.1025 0.5771 -0.4516 -0.0219 -0.1854 0.4084 -0.3162 0.1491 -0.3930 0.6639 0.2619 0.0630 -0.1750 0.1266 0.2151 0.3422 -0.3162 0.2043 0.0749 -0.2118 -0.0655 0.1544 -0.0904 0.1987 0.7322 -0.4425 -0.3162
-1.0017 -0.9272 0.5339 0.6559 -2.6949 1.0878 0.9828 0.0981 0.5338 0.7315 -2.2966 1.5758 0.3136 -0.0497 0.3096 -0.0883 0.3799 0.8912 -1.2795 0.2439 -1.4546 0.1031 -0.7078 0.3095 0.8066 0.6328 -0.2138 -0.8089 1.9580 -0.6248 0.5820 2.0251 -0.2904 -0.3353 -1.3194 -0.3909 -0.5270 -0.2795 0.7138 -0.1784 0.0369 -0.2203 -1.6963 0.8244 -0.1706 -0.3682 -0.3706 1.4271 0.1557 0.3819 0.1080 0.2497 -0.3746 1.3114 0.0194 -0.7938 1.0639 -0.9977 -0.3866 -0.1996 -0.3093 -0.1829 1.0322 0.9582 -0.0259 -0.8736 -1.2583 -0.0477 0.2753 0.4319 -0.1973 -0.1088 -0.2502 -0.7778 0.1771 -0.7796 0.4145 -0.3704 0.4296 1.4629 -0.0966 -0.2313 0.4670 -0.3367 -0.0946 -1.0082 0.7082 0.7848 0.6575 -0.8503
sets with different sizes and locations, without very much concern on the orientations of the scanned
specimen.
TABLE VI
THE MINIMUM DISTANCE OF EACH MATCHED LOGO
Matched
Logo Euclidean's distance between unknowns and referenced logos
Unknown Logo
1 2 2 4 5 6 7 8 9 10
1 1.56286 1.4457 1.2919 1.1519 1.3606 0.0761 0.6868 1.5115 1.5584 1.3430 6 2 0.1153 1.3414 1.4818 1.6284 1.5034 1.5405 1.6057 1.3870 1.2523 1.6105 1 3 1.3278 1.7024 1.4593 1.2995 1.5957 1.5365 1.5830 1.5362 0.0627 1.3743 9 4 1.5492 1.5410 0.1345 1.2624 1.5893 1.2411 1.2184 1.0258 1.4009 1.0478 3 5 1.4605 1.2533 1.5132 1.2901 0.2078 1.2132 1.3083 1.4342 1.5168 1.4923 5 6 1.7033 1.7372 1.1649 0.8872 1.6352 1.4123 1.2895 1.1667 1.4076 0.0288 10 7 1.5554 1.4568 1.2625 1.1747 1.3456 0.7145 0.1479 1.4369 1.4807 1.1947 7 8 1.2541 0.1845 1.4818 1.5135 1.2389 1.3794 1.4229 1.2937 1.5476 1.6309 2 9 1.4828 1.4382 1.1822 0.2578 1.2537 1.0077 1.1593 1.2100 1.2041 0.8016 4 10 1.4275 1.3736 0.9842 1.3287 1.5528 1.5054 1.4535 0.1022 1.5058 1.1181 8
iii). Examining whether test sets at different resolutions, sizes, and locations would flirter decrease the performance rate. Twenty five logos were scanned at the resolutions of 150 dpi and 200 dpi at arbitrary locations.
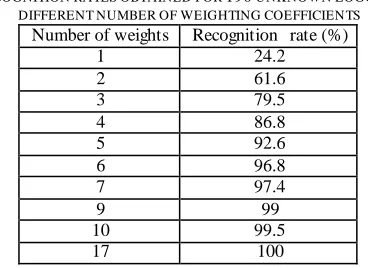
By changing the sizes, locations, and resolutions, it is obvious that the quality of images is either improved or degraded. Through series of testing at various levels prescribed above, the experiments had shown that those imposed conditions hardly affect the recognition performance. At this stage, the recognition classifier only requires different number of weighting coefficients to provide the recognitions. Generally, a closer, normalized pattern to its referenced symbol would have smaller number of weighting coefficients. The recognition rate of 100% was obtained at each level of testings for 190 unknown logos. Table VII describes the percentage rate of recognition at different number of weighting coefficients and is seen to be very good. The results obtained here show that the sufficient number of weighting coefficients required to perform a correct recognition is 17.
TABLE VII
RECOGNITION RATES OBTAINED FOR 190 UNKNOWN LOGOS AT DIFFERENT NUMBER OF WEIGHTING COEFFICIENTS
Number of weights Recognition rate (%)
1 24.2
2 61.6
3 79.5
4 86.8
5 92.6
6 96.8
7 97.4
9 99
10 99.5
17 100
The method applied here was invariant to translation, and scaling. This was done by performing image normalization to each reference and tested logo of different scaling, and translation, prior to the calculation of eigenvectors. It was found that the scaling factor in our image normalization case should be around the value of 1, in order to accommodate all the logos. It could also be made invariant to rotation by performing image normalization to rotation.
In summary, in the author's work described in this chapter the logo image was considered as a point in
Q
dimensional space, and the method applied reduced this to a new space of dimension
M
1
, whereM
is the number of logos. The projection coefficients of each symbol into the new co-ordinate system were used as characteristic features for the purpose of identification.5. CONCLUSION
The recognition rate of 100% was obtained by applying the eigenvector technique to seventy classes, each consisting of at least two samples of one logo. The experiment had shown that, the minimum number of weights needed to perform a correct recognition is seventeen. However, for the purpose of image reconstruction, this number is not enough to build a visible image.
REFERENCES
[1] Cortelazzo, G.; Mian, G.A.; Vezzi, G.; and P. Zamperoni (1994). "Trademark Shapes Description By String-Matching T echniques", Pattern Recognition, Vol.27, No.8, pp.1005-1018. [2] Hung, D.C. (1993). "Non-Conventional Algorithm for Representing and Recognizing Complicated T wo-Dimensional Objects", Pattern Recognition, Vol.26, No.4, pp.495-504. [3] Lin, J.C. (1993). "Universal Principal Axes: An Easy
No.4, pp.485-493.
[4] Shih, F.Y.; Chen, S. S.; Hung, D.C.; and Peter A. Ng. (1992). "A Document Segmentation, Classification and Recognition System", Proceeding of The Second International Conference On Systems Integration, pp.258-267.
[5] Rosenfeld, A. (1992). "Image Analysis and Computer Vision: 1991", CVGIP: Image Understanding, Vol.55, No.3, May, pp.349-380.
[6] Ghosal, S. and R. Mehrotra (1993). "Orthogonal Moment Operators For Subpixel Edge Detection", Pattern Recognition, Vol.26, No.2, pp.295-306.
[7] Li, Bing Cheng (1993), "A New Computation of Geometric Moments", Pattern Recognition, Vol.26, No.1, pp.109-113. [8] T sirikolias, K and B. G. Mertzios (1993). "Statistical Pattern Recognition Using Efficient T wo-Dimensional Moments With Applications T o Character Recognition", Pattern Recognition, Vol.26, No.6, pp.877-882.
[9] Li, Bing Cheng (1993). "T he Moment Calculation Of Polyhedra", Pattern Recognition, Vol.26, No.8, pp.1229-1233. [10] Somaie, A.A.I. (1996). Face Identification Using Computer
Vision, Ph.D T hesis, University of Bradford.
[11] Gonzalez, R.C. and R.E. Woods (1992), Digital Image Processing, Addison Wesley.
[12] Guangyu Zhu, David Doermann (2009), "Logo Matching for Document Image Retrieval,”, 10th International Conference on Document Analysis and Recognition, icdar, pp.606 -610.
About the authors:
Dr. Sami M. Halawani Received the M.S. degree in Computer Science from the University of Miami, USA, in 1987. He received the Professional Applied Engineering Certificate from T he George Washington University, USA, in 1992. He earned the Ph.D. degree in Information Technology from the George Mason University, USA in 1996. He is a faculty member of the College of Computing and Information T echnology, King Abdulaziz University, Jeddah, Saudi Arabia. He worked As the vice dean for Graduate Studies and Research during 2007 and 2008 and he is currently working as the Dean of the College of Computing and Information T echnology in Rabigh. He has authored / co-authored many publications in journals/conference proceedings. His Research interest include image processing, computer graphics, Data mining and multimedia information retrieval systems.