INTERNATIONAL JOURNAL OF CURRENT MEDICAL AND
PHARMACEUTICAL RESEARCH
ISSN: 2395-6429, Impact Factor: 4.656
Available Online at www.journalcmpr.com
Volume 4; Issue 8(A); August2018; Page No. 3604-3608
DOI: http://dx.doi.org/10.24327/23956429.ijcmpr20180520
Case Report
AN IN VITRO EVALUATION OF EFFECT OF CONFIGURATION FACTOR (C FACTOR) ON MARGINAL
ADAPTATION OF TWO DIFFERENT COMPOSITES
Shahebaz Khan., Ashwini Gaikwad and Anupam Sharma
Department of Conservative Dentistry & Endodontics, Bharati Vidyapeeth Deemed University,
Dental College & Hospital, Pune, Maharashtra
ARTICLE INFO ABSTRACT
Dental composites have a wide range of applications in conservative dentistry and endodontics. Along with, best aesthetic properties, they have good compressive strength and resistance to shear forces. With the help newer generations of bonding agents, the adhesive characteristics of composites have greatly improved. But, along with these advantages, there are certain disadvantages of these materials. Polymerisation shrinkage is one of the major disadvantages of composite restorative materials. Due to polymerisation shrinkage the marginal adaptability of the composite to the cavity walls is affected, which in turn gives rise to secondary caries, sensitivity and pulpal pathology. Cavity configuration factor or the C factor is the criteria which is used to measure polymerisation shrinkage.
Copyright © 2018 Shahebaz Khan et al. This is an open access article distributed under the Creative Commons Attribution License, which permits unrestricted
use, distribution, and reproduction in any medium, provided the original work is properly cited.
INTRODUCTION
Dental restorations are amongst the most widely performed treatment procedures in dentistry. These include rehabilitation of a decayed tooth structure to its normal form and function. This rehabilitation is achieved by removal of decayed tooth structure followed by its restoration with a biocompatible and aesthetically acceptable material.[1]Since the introduction of resin composites since past two decades, the majority of the dental clinicians utilise this material as their first material of choice for the treatment and restorations of carious lesions. A composite is a multiphase material that exhibits the properties of both phases where the phases are complimentary, resulting in a material with enhanced properties. [2, 3] However modifications were made in composite resins but, the polymerization shrinkage and lack of bonding to tooth structure limited the clinical success of these formulations. [4] The ratio of the bonded surface area to the unbonded or free surface area is called the cavity configuration, or C-factor. When restoring cavities with high C-factor, the resultant stresses put resin tooth interfaces under severe tension as there is less chance for relaxation of shrinkage stress. In recent times, various low shrinkage composites have been developed. These can be broadly divided as microhybrid composites and nanohybridcomposites. Nanohybrid composites are the latest version of the resin restorative composites while microhybrid composites are the precursors of nanohybrids. The improvements in filler technology by manufacturers have allowed blends of both submicron particles (0.04 mm) and
small particles (0.1 mm-1.0 mm)to be incorporated into a composite formulation. These materials are classified as micro-hybrid composites. Nanohybrids contain nanometer-sized filler particles (.005-.0l microns) throughout the resin matrix, in combination with a more conventional type filler technology. Nanohybrids may be classified as the first truly universal composite resin with handling properties and polishability of a microfilled composite, and the strength and wear resistance of a traditional hybrid compocites. [2] This study focuses on the effect of variable cavity configuration factors, on marginal adaptation of nanohybrid and microhybrid composites.
MATERIALS AND METHOD
Fifty sound freshly extracted human maxillary premolar teeth were selected for the study. Teeth were extracted as a part of an orthodontic treatment plan. Selected teeth were free from caries, coronal fractures, or cracks. Teeth were debrided with hand scalers and cleaned with a rubber cup and slurry of pumice. They were then stored in saline solution at 4◦C ready for the study. Standardized box-shaped cavities 2 × 2 × 2mm were made on the buccal and lingual surfaces of teeth at their gingival one thirds. Such 50 teeth samples will give 100 cavities. Cavities were positioned about one millimetre above the cementoenamel junction to ensure that the gingival floor is in enamel. Positions and dimensions of the cavities were standardized using a template (2 × 2mm) prepared in a metal band strip. Box cavities were made using no. 245 tungsten
Article History:
Received 22nd May, 2018 Received in revised form 5th June, 2018
Accepted 16th July, 2018
Published online 28th August, 2018
Key words:
International Journal of Current Medical And Pharmaceutical Research
carbide burs in a high-speed handpiece under copious water spray. Depth of cavities were standardized by marking the burs at 2mm length prior to use. A new bur was used after each ten preparations. No bevels were given at cavosurface margins of the preparation. Axial walls were inspected for absence of pulp exposures. Teeth were kept wet until the adhesive treatment procedure started. Cavities were prepared on both
lingual surfaces of the tooth so in this way a single tooth served as two samples. (50 teeth x 2 cavities = 100 cavities).
Adhesive/Composite Systems: Low-shrinking nano hybrid and
micro hybrid composites were experimented with.
Nano hybrid Composite: 3M ESPE Z350XT restorative Composite.
Micro hybrid Composite: Sybron Endo Super Cor.
Out of total 50 teeth, two groups (group A and B) were made of 25 teeth each (50 cavities each). These were divided as follows:
Group A: Cavities restored with
composite. (50 cavities)
Group B: Cavities restored with
composite. (50 cavities)
Group A was further subdivided into 5 sub-each = 10 cavities sub-each in following manner:
1. Group A1: in which one cavity surface (coronal wall) was allowed for bonding (C-factor - 1/5 = 0.2).
2. Group A2: in which two cavity surfaces (coronal wall and mesial wall) were allowed for bonding (C
/4 = 0.5).
3. Group A3: in which three cavity surfaces (coronal wall, distal wall and mesial wall) were allowed for bonding (C-factor - 3/3 = 1).
4. Group A4: in which four cavity surfaces (coronal wall, axial wall, distal wall and mesial wall)
bonding (C-factor - 4/2 = 2).
5. Group A5: in which all cavity surfaces
axial wall, distal wall, mesial wall and gingival floor) were allowed for bonding (C-factor-5/1= 5).
Group B was further subdivided in 5 sub-each = 10 cavities sub-each in following manner:
1. Group B1: in which one cavity surface (coronal wall) was allowed for bonding (C-factor = 1/5).
2. Group B2: in which two cavity surfaces (coronal wall and mesial wall) were allowed for bonding (C
/4).
3. Group B3: in which three cavity surfaces (coronal wal distal wall and mesial wall) were allowed for bonding (C-factor = 3/3).
4. Group B4: in which four cavity surfaces (coronal wall, axial wall, distal wall and mesial wall)
bonding (C-factor = 4/2).
5. Group B5: in which all cavity surfaces
axial wall, distal wall, mesial wall and gingival floor) were allowed for bonding (C-factor = 5/1).
For all of the above specimens the selected unbonded cavity wall(s) was premarked with a dot using a permanent coloured marker on the corresponding surface and away from the cavity margin by about 2mm for signalling as well as to facilitate identification. The cavities were thoroughly rinsed with
Current Medical And Pharmaceutical Research, Vol. 4, Issue, 8(A), pp.
3604-speed handpiece under copious water spray. Depth of cavities were standardized by marking the burs used after each ten preparations. No bevels were given at cavosurface margins of the preparation. Axial walls were inspected for absence of pulp exposures. Teeth were kept wet until the adhesive treatment procedure started. Cavities were prepared on both buccal and lingual surfaces of the tooth so in this way a single tooth served as two samples. (50 teeth x 2 cavities = 100 cavities).
shrinking nano hybrid and micro hybrid composites were experimented with.
omposite: 3M ESPE Z350XT restorative
Micro hybrid Composite: Sybron Endo Super Cor.
Out of total 50 teeth, two groups (group A and B) were made of 25 teeth each (50 cavities each). These were divided as
Cavities restored with nanohybrid
Cavities restored with microhybrid
-groups of 5 teeth each in following manner:
one cavity surface (coronal wall) 1/5 = 0.2).
two cavity surfaces (coronal wall were allowed for bonding (C-factor - 2
urfaces (coronal wall, were allowed for bonding four cavity surfaces (coronal wall, axial wall, distal wall and mesial wall) were allowed for which all cavity surfaces (coronal wall, axial wall, distal wall, mesial wall and gingival floor)
5/1= 5).
-groups of 5 teeth each in following manner:
one cavity surface (coronal wall) factor = 1/5).
two cavity surfaces (coronal wall were allowed for bonding (C-factor =2
three cavity surfaces (coronal wall, were allowed for bonding
four cavity surfaces (coronal wall, axial wall, distal wall and mesial wall) were allowed for
Group B5: in which all cavity surfaces (coronal wall, axial wall, distal wall, mesial wall and gingival floor)
factor = 5/1).
For all of the above specimens the selected unbonded cavity wall(s) was premarked with a dot using a permanent coloured marker on the corresponding surface and away from the cavity margin by about 2mm for signalling as well as to facilitate The cavities were thoroughly rinsed with
etchant used was 37.5% phosphoric acid gel. The etchant was applied with microbrushes and kept for 15 seconds. The etchant was then rinsed with distill
subjected to bonding procedures. Bonding procedure was completed according to above mentioned protocol for group subdivision. Bonding agent was applied with micro brushes under dental magnification loupes at 3x magnification. Cur was done for 15 seconds and air dried for 5 seconds. After bonding procedure is completed restoration with respective composites were done. Composite restorations were done incrementally, each increment was approx., 1mm in thickness. Curing was done for 20 seconds.
Teeth specimens were covered with two layers of nail polish except for the restorations and approximately 1mm margin around. The teeth were then dipped in a 2% methylene blue dye solution for 30 minutes. After dye penetration, the dye film on the tooth’s surface was polished off with a 3M polishing disc (Soflex XT
Pop-Each tooth was then sectioned vertically through the centre of the restoration with a diamond disk at low speed under water coolant. The sectioned teeth were asse
stereomicroscope with an attached camera at ×20. Image Analysis
Captured photomicrographs were transferred to a computer system for measurement of linear dye penetration at gingival margins using an image analysis software program (Image J 1.31b, USA). Processing of each photomicrograph was done before analysis to ensure standardization of each image for calculation. The colored image was converted into an 8 gray scale image (black and white) for easy selection of an appropriate threshold of a grey scale that ensures selection of the area of dye penetration only. On the 8
automated tracing of the area of interface was performed to select the desired area for calculation. This was followed by automatic calculation of linear dye
cavity margins. Statistical Analysis
The statistical analysis was done using one way ANNOVA for intergroup comparison between Group A and Group B. The comparison of microleakage in terms Mean standard deviation between group A and B was done using unpaired t rest. The intragroup comparison was done using ANNOVA followed by Tukey’s post hoc analysis
RESULTS
Graph 1 Comparison of microleakage (in mm) in terms of {Mean (SD)}
(Buccal & lingual) among different bonded surfaces of Group A ANOVA test 0 0.1 0.2 0.3 0.4 0.5 0.6 0.7 0.8 0.91 Group A1 Group A2
Buccal 0.542 0.79
Lingual 0.49 0.738
M
EAN
(S
D)
Buccal
-3608, August, 2018
etchant used was 37.5% phosphoric acid gel. The etchant was applied with microbrushes and kept for 15 seconds. The etchant was then rinsed with distilled water and cavities were subjected to bonding procedures. Bonding procedure was completed according to above mentioned protocol for group subdivision. Bonding agent was applied with micro brushes under dental magnification loupes at 3x magnification. Curing was done for 15 seconds and air dried for 5 seconds. After bonding procedure is completed restoration with respective composites were done. Composite restorations were done incrementally, each increment was approx., 1mm in thickness.
r 20 seconds.
Teeth specimens were covered with two layers of nail polish except for the restorations and approximately 1mm margin around. The teeth were then dipped in a 2% methylene blue dye solution for 30 minutes. After dye penetration, the dye n the tooth’s surface was polished off with a 3M
-On 1982 SF).
Each tooth was then sectioned vertically through the centre of the restoration with a diamond disk at low speed under water coolant. The sectioned teeth were assessed using a stereomicroscope with an attached camera at ×20.
Captured photomicrographs were transferred to a computer system for measurement of linear dye penetration at gingival margins using an image analysis software program (Image J 1.31b, USA). Processing of each photomicrograph was done before analysis to ensure standardization of each image for calculation. The colored image was converted into an 8-bit gray scale image (black and white) for easy selection of an d of a grey scale that ensures selection of the area of dye penetration only. On the 8-bit image, automated tracing of the area of interface was performed to select the desired area for calculation. This was followed by automatic calculation of linear dye penetration at the gingival
The statistical analysis was done using one way ANNOVA for intergroup comparison between Group A and Group B. The comparison of microleakage in terms Mean standard deviation and B was done using unpaired t rest. The intragroup comparison was done using ANNOVA followed by
Comparison of microleakage (in mm) in terms of {Mean (SD)}
lingual) among different bonded surfaces of Group Ausing
ANOVA test Group A3 Group A4 Group A5
0.25 0.034 0.95
0.308 0.05 0.94
International Journal of Current Medical And Pharmaceutical Research
Graph 2 Comparison of microleakage (in mm) in terms of {Mean (SD)}
(Buccal & lingual) among different bonded surfaces of Group B ANOVA test
Table 1 Comparison of microleakage in terms of {Mean (SD)} buccal cavities among different bonded surfaces of Group A
using ANOVA test
Group N Mean Std.
Deviation F value
Group A1 5 0.542 0.107
72.092
Group A2 5 0.794 0.096
Group A3 5 0.258 0.049
Group A4 5 0.034 0.026
Group A5 5 0.950 0.158
Total 25 0.515 0.354
(p< 0.05 - Significant*, p < 0.001 - Highly significant**)
Table 2 (Tukey’s post hoc analysis)
Group A1
Group A2
Group A3
Group A1 - 0.005* 0.002* <0.001**
Group A2 0.005* - <0.001** <0.001**
Group A3 0.002* <0.001** -
Group A4 <0.001** <0.001** 0.014*
Group A5 <0.001** 0.132 <0.001** <0.001**
Table 3 Comparison of microleakage in terms of {Mean (SD)} buccal cavities among different bonded surfaces of Group B
using ANOVA test
Group N Mean Std. Deviation F value
Group B1 5 0.730 0.097
112.668
Group B2 5 0.880 0.135
Group B3 5 0.794 0.096
Group B4 5 0.126 0.046
Group B5 5 1.296 0.005
Total 25 0.765 0.391
(p< 0.05 - Significant*, p < 0.001 - Highly significant**)
Table 4 (Tukey’s post hoc analysis)
Group B1 Group B2 GroupB3 Group B4
Group B1 - 0.093 0.782
Group B2 0.093 - 0.552
Group B3 0.782 0.552 -
Group B4 <0.001** <0.001** <0.001**
Group B5 <0.001** <0.001** <0.001**
Upon intergroup comparison, highly significant difference was found between groups A3 and B3 also in groups A5 and B5. The overall mean values of microleakage between Group A and B, which shows a significant difference in mean value in microleakage. Group A = 0.515 and group B = 0.765
0 0.2 0.4 0.6 0.8 1 1.2
Group B1
Group B2
Group B3
Group B4
Buccal 0.73 0.88 0.79 0.126
Lingual 0.744 0.902 0.738 0.14
M
EA
N
(S
D)
Buccal Lingual
Current Medical And Pharmaceutical Research, Vol. 4, Issue, 8(A), pp.
3604-Comparison of microleakage (in mm) in terms of {Mean (SD)}
(Buccal & lingual) among different bonded surfaces of Group Busing
in terms of {Mean (SD)} buccal cavities among different bonded surfaces of Group A
F value P value
72.092 <0.001**
Highly significant**)
(Tukey’s post hoc analysis)
Group A4
Group A5
<0.001** <0.001**
<0.001** 0.132
0.014* <0.001**
- <0.001**
<0.001** -
Comparison of microleakage in terms of {Mean (SD)} among different bonded surfaces of Group B
F value P value
112.668 <0.001**
Highly significant**)
(Tukey’s post hoc analysis)
Group B4 Group B5
<0.001** <0.001**
<0.001** <0.001**
<0.001** <0.001**
- <0.001**
<0.001** -
Upon intergroup comparison, highly significant difference was groups A5 and B5. The overall mean values of microleakage between Group A and B, which shows a significant difference in mean value in microleakage. Group A = 0.515 and group B = 0.765
Diagram showing prepared cavity. Premarked dots showing the surfaces subjected to bonding
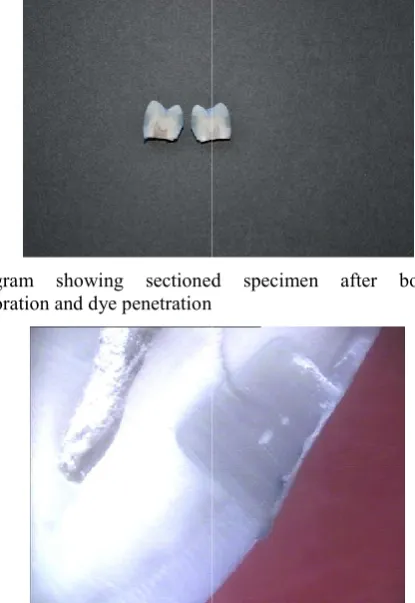
Diagram showing sectioned specimen after bonding, restoration and dye penetration
Diagram showing specimen under stereomicroscope
DISCUSSION
In the past two decades composites have emerged as reliable restorative materials in the field of conservative dentistry. Due to their enhanced esthetic abilities as compared to conventional restorative materials like amalgam and GIC their use has rapidly increased for anterior teeth restorations. Along with greater esthetic value these materials possess better resistance to compressive and shear forces in the oral cavity. For these reasons they are preferred for posterior teeth restorations as well. Many improvements are made in composites to improve mechanical, physical and handling properties.
Due to polymerization shrinkage the marginal adaptability of the composite to the cavity wall is compromised. Restorations with good adaptability are considered to exhibit better clinical performances, while incomplete marginal sealing at tooth/restoration interface results in postoperative sensitivity, marginal staining, recurrent caries and development of pulp pathology.
Group Group
B5 1.196
1.14
-3608, August, 2018
Diagram showing prepared cavity. Premarked dots showing surfaces subjected to bonding
Diagram showing sectioned specimen after bonding,
Diagram showing specimen under stereomicroscope
In the past two decades composites have emerged as reliable erials in the field of conservative dentistry. Due to their enhanced esthetic abilities as compared to conventional restorative materials like amalgam and GIC their use has rapidly increased for anterior teeth restorations. Along with e these materials possess better resistance to compressive and shear forces in the oral cavity. For these reasons they are preferred for posterior teeth restorations as well. Many improvements are made in composites to improve
ling properties.
International Journal of Current Medical And Pharmaceutical Research, Vol. 4, Issue, 8(A), pp. 3604-3608, August, 2018
In order to study the marginal adaptability of the composites, the criteria of evaluation in this study was the cavity configuration factor (C factor).
C factor is the ratio of the bonded to unbonded surfaces in a specific type of cavity preparation. In dentistry, the configuration factor was first introduced by Davidson CL, in 1986. [5] The developing curing contraction in a bonded restoration generate stress on the bonded interface that are in competition with the developing bond strength of the setting composite to the cavity surfaces, which may result in (partial) debonding, marginal leakage and post-operative pain.
The micolekage was measured using dye penetration, evaluated under stereomicroscope. This method of evaluation has been used in previous studies to measure microleakage and has been established as a reliable method to evaluate microleakage and marginal adaptability. [6]
Group A which contained nanohybrid composite, showed increase in microlekage as the C factor increases, with reference to sub groups A1 (C factor=0.2), A2 (C factor=0.5) and A5 (C factor=5), with a statistical difference which was highly significant. These results were similar to findings of KK Choi et. al. (2003) and Sarita et.al. (2010) in which the authors noted that as the C-factor of the cavity increased, the flow capacity of the resin composites decreased and more internal stresses occurred which in turn lead to more micro leakage at cavity margins. [7,8]
On the contrary the trend showed by the above groups is contradicting the values showed by group A3 and A4, where mean SD for group A3 is 0.258 with C factor 1. For A4 mean SD is 0.034, with C factor = 2. These results were in accordance with the findings of El Sahn et. al. (2011) in which authors found lower micro leakage values within cavities with C factor value 2 when compared with C factor value 1. These value were lower in comparison to other C factors. [9] This could be justified with the fact that in Group A4 and B4, in which the axial wall was also bonded along with other cavity walls, it is important to clarify that bond strengths along a cavity floor may not be representative of those along walls, particularly as a result of differences in tubule orientation, density, and generated lateral forces during polymerization. This leads to better bonding on a flatter surface with more resin tag formation and uniform polymerization stress distribution in cavities of group A4 and B4, resulting in least microleakage value amongst all the sub groups. [8,9,10]. Similar trend in results is applicable to Group B as in Group A. From the above results it was evident that overall microleakage in nanohybrid composite is lower than that in microhybrid composites and the buccal and lingual cavities of the same sample showed similar values. So, irrespective of cavity placement (buccal or lingual), the microleakage values were unaffected in the same sub groups.[11] In this study, the bond strength of both the composites drastically decreased as the C-factor was increased. Miyazaki and others (1991) reported that filler content was one of the most important factors influencing the physical properties of composites in the study of bond strength to bovine dentin. Other studies also have shown that the mechanical properties of dental composites were most highly correlated with bond strengths to dentin or enamel. [12]According to G.V. Black, standard preparations were cut to a certain depth which was related to its length and width. Therefore, a rough estimation can be
International Journal of Current Medical And Pharmaceutical Research, Vol. 4, Issue, 8(A), pp. 3604-3608, August, 2018
is better as compared to microhybrid composites. So, the final set product of nanohybrid shows better marginal adaptability when compared to microhybrid composite. Therefore, contraction stresses are produced earlier and to a greater extent in the more heavily filled microhybrid composite, resulting in the material being more sensitive to flow capability and lesser shrinkage. However, this is an in vitro study and it may be quite different from clinical cavity preparations and variations in tooth morphology, which could affect the effect of C factor on marginal adaptation of composites. Further studies should be conducted to evaluate its effectiveness in clinical conditions.
CONCLUSION
Within the limitations of this in vitro study we can conclude that:
Cavity configuration factor had a significant effect in determining the marginal adaptability of the composite to the cavity walls.
In terms of microleakage, nanohybrid composite performed better than microhybrid composite.
In a clinical situation, class I and V cavities have most marginal leakage while class II and IV cavities have least marginal leakage irrespective of the material used.
In conclusion, nanohybrid is better restorative material than microhybrid composite. Class I and V cavities have highest C factor, while least C factor is shown by class II and class IV cavities.
The science and technology of composite dental restorative materials have advanced considerably over the past 10 years. Although composites have not evolved to the point of totally replacing amalgam, they have become a viable substitute for amalgam in many clinical situations. Problems still exist with polymerization contraction stress, large differences in thecomposition of composites compared with tooth structure, and some technique sensitivity; however, new expanding resins, nanofiller technology, and improved bonding systems have the potential to reduce these problems. With increased patient demands for esthetic restorations, the use of direct filling composite materials will continue to grow. The one major caveat to this prediction is that clinicians must continue to use sound judgment on when, where, and how to use composite restoratives in their practice.
Bibliography
:1. Goldman M. Polymerization shrinkage of resin based restorative materials. Australian Dental Journal 1983; 28: 156-61.
2. Aaron D. Puckett, James G. Direct Composite Restorative Materials. Dent Clin N Am 51 (2007) 659-675.
3. Roberson TM, Heymann HO, Ritter AV. Introduction to composite restorations. In: Roberson TM, Heymann HO, Swift EJ, editors. Sturdevant’s art and science of operative dentistry. 4th edition. Philadelphia: Mosby Inc.; 2002. p. 471-500.
4. Rawls HR, Upshaw JE. Restorative resins. In: Anusavice KJ, editor. Phillip’s science of dental materials. 11th edition. Philladelphia: WB Saunders; 2003. p. 399-441.
5. Wikipedia webpage of C factor.
6. C. P. Ernst, G. R. Meyer, K. Kl¨ocker, and B. Willershausen, “Determination of polymerization shrinkage stress by means of a photoelastic investigation,” Dental Materials, vol. 20, no. 4, pp. 313-321, 2004.
7. KK Choi, JL Ferracane, GJ Ryu, SM Choi, MJ Lee, SJ Park. Effects of Cavity Configuration on Composite Restoration. Operative Dentistry, 2004, 29-4, 462-469. 8. SaritaBhushan, Ajay Logani, Naseem Shah. Effect of
prepolymerized composite megafiller on the marginal adaptation of composite restorations in cavities with different C-factors: An SEM study. Indian J Dent Res, 21(4), 2010.
9. NA El-Sahn, DW El-Kassas, HM El-Damanhoury, OM
Fahmy _ H Gomaa, JA Platt. Effect of C-factor on Microtensile Bond Strengths of Low- Shrinkage Composites. Operative Dentistry, 2011, 36-3, 281-292. 10. Kiran KV, AravindTatikonda, KapilJhajharia,
SeemaRaina, Himani Lau, DivyaKatare, Rose
KanwaljeetKaur. In Vitro Evaluation of the
Compressive Strength of Microhybrid and
Nanocomposites. OHDM - Vol. 13 - No. 4 - December, 2014
11. Kiran KV, AravindTatikonda, KapilJhajharia,
SeemaRaina, Himani Lau, DivyaKatare, Rose
KanwaljeetKaur. In Vitro Evaluation of the
Compressive Strength of Microhybrid and
Nanocomposites. OHDM - Vol. 13 - No. 4 - December, 2014.
12. Miyazaki M1, Hinoura K, Onose H, Moore BK. Effect of filler content of light-cured composites on bond strength to bovine dentine. J Dent. 1991 Oct; 19(5):301-3.
13. A. J. Feilzer, A. J. De Gee, and C. L. Davidson, “Quantitative determination of stress reduction by flow in composite restorations,” Dental Materials, vol. 6, no. 3, pp. 167-171, 1990.
14. A. J. Feilzer, A. J. De Gee, and C. L. Davidson, “Setting stress in composite resin in relation to configuration of the restoration,” Journal of Dental Research, vol. 66, no. 11, pp. 1636-1639, 1987.
15. KK Choi, JL Ferracane, GJ Ryu, SM Choi, MJ Lee, SJ Park. Effects of Cavity Configuration on Composite Restoration. Operative Dentistry, 2004, 29-4, 462-469. How to cite this article:
Shahebaz Khan et al (2018) 'An In Vitro Evaluation of Effect of Configuration Factor (C Factor) On Marginal Adaptation of Two Different Composites', International Journal of Current Medical And Pharmaceutical Research, 04(8), pp. 3604-3608.