Using Bayesian Networks to Visually Compare the Countries: an Example from
PISA
Seyfullah Tingir, MAE
Russell Almond, PhD
Department of Educational Psychology and Learning Systems
Florida State University
1114 W Call Street, Tallahassee Florida, 32306
USAAbstract
Bayesian networks provide a graphical representation of a probability distribution where separation in the graph represents conditional independence of the corresponding variables. Finding a minimal Bayesian network, which expresses the conditional independence relationships among a set of variables, allows an analyst to visualize the relationship among the variables. This study applies a Bayesian network learning algorithm to data from the Program for International Student Assessment (PISA) 2012 mathematics literacy data. Particularly, the relationship among the self-concept, self-efficacy, math interest, and math achievement are examined for both the United States and Turkey. Comparing the Bayesian networks illustrates the different relationships between self-efficacy and math achievement for the students from the two countries.
Keywords:
Bayesian networks, PISA, comparison, mathematics1.Introduction
Bayesian networks are increasingly used in educational research to describe the relationships between various proficiency variables (García, Schiaffino, &Amandi, 2008; Almond et al., 2015; West, Rutstein, Mislevy, Liu, Choi, Levy, Crawford, DiCerbo, Chappel, & Behrens,2010).Bayesian networks provide a graphical representation of a probability distribution where separation in the graph represents conditional independence of the corresponding variables (Pearl, 1988). As minimal Bayesian networks frequently follow causal patterns, this should provide a method for generating possible causal hypotheses among the variables.This study illustrates a way to build Bayesian networks in large-scale assessments using Program for International Student Assessment (PISA) 2012 mathematics literacy data. The major domain in 2012 was mathematics, which was given greater emphasis than science and reading. Attitudes of the PISA participants towards mathematics were measured with ten different indices with 67 items. OECD (2014) notes that three factors, mathematics self-efficacy, mathematics self-concept, and mathematics interest, are particularly strong. This paper describes the construction of a Bayesian networks to describe the interrelationship of these three factors and the mathematics scale score. By building separate Bayesian networks for two different countries, the Bayesian network should provide a way of visualizing cross-cultural differences in attitudes towards mathematics. Once a Bayesian network is built, a simple message-passing algorithm allows making inferences about unobserved variables based on observed variables (Pearl, 1988; Almond et al., 2015). This paper explores the use of the developed Bayesian network structures to predict the achievement score for PISA participants from their mathematics attitudes. In particular, the accuracy of these predictions is frequently used as a metric of Bayesian network fit to a particular data set (Almond et al., 2015).Based on the focus of the influence of self-efficacy, self-concept, and interest to mathematics achievement, we examine how Bayesian networks differ in US and Turkey PISA 2012 data.
1.1.Theoretical Framework: Bayesian Networks
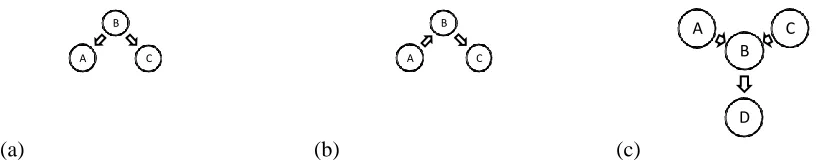
However, the ready availability of software tools (e.g., Netica; Norsys, 2012), which can provide dynamic displays, adds a new dimension. Like brushing in scatter plot matrixes (Becker & Cleveland, 1987), this dynamic display helps visualize more complex relationships among the variables. Bayesian networks use an acyclic directed graph to represent the joint probability distribution over a collection of the variable. The variables correspond to the nodes of the graph and the pattern of edges encodes conditional independence statements about the variables. In particular, separation in the graph implies that the variables are independent given the separating set. However, with a directed graphical representation, d-separation, rules for separation based on the direction of the arrows, is used (Pearl, 1988). D-separation can be illustrated with three canonical examples as in Figure 1.
Figure 1. Three canonical examples illustration d-separation.
(a) (b) (c)
In both Figures 1a and 1b, the variables A and C are conditionally independent given B, but the independence arises from different mechanisms. In Figure 1a, B represents a common cause or influence of both A and C; if B is unknown, there is a dependence between A and C, because if B is true then both A and C are more likely to be true.In Figure 1b, B represents an intermediate step in the relationship between A and C;as the influence from A to
C goes through B, if B is known, A and C become independent. In Figure 1c, A and C are independent unless B is known. The model here is one of competing explanations; if B is true, than either A or C is likely to be true as well. This, in turn means, that if A is ruled out as an explanation, C becomes more likely, breaking the independence between A and C. Note that even knowledge of a descendant of B, D in the figure, is enough to break the dependence between A and C.One consequence of the conditional probability conditions is that the joint probability distribution can be factored according to the graph (although this property may not hold if some configurations of variables have probability zero). In particular, let Pa(Xi) be the parents of Xiin the graph. Then the joint distribution can be written as:
𝑃(𝑋1,..., 𝑋𝑛) = 𝑃 𝑋𝑖|Pa(𝑋𝑖)
𝑛
𝑛=1
(1)
Thus, to construct a Bayesian network, it is necessary to first decide on a graph which fits the observed patterns of dependence and independence among the variables, and then produce the series of probability distributions P(Xi |
Pa(Xi)).If all of the variables are discrete, the latter can be easily calculated from the contingency tables involving
Xi and Pa(Xi).
1.2.Theoretical Framework: Attitudes towards Mathematics
This study uses Bayesian networks built from PISA survey data to explore the relationship among four variables associated with mathematics: mathematics achievement score, mathematics efficacy, mathematics self-concept and interest in mathematics. Self-efficacy refers to an individual’s judgment himself/herself about being able to accomplish a task (Siegle & McCoach, 2007). Self-efficacy is more about explaining and predicting the thought, emotion, and action rather than possessing the skills (Bong & Skaalvik, 2003). This could be an inference based on a previous performance. For example, a person’s expectation from himself/herself to high jump 6 feet under the given circumstances is an efficacy judgment but it is not a judgment of possessing a particular competency (Bandura, 1986; Bong & Skaalvik, 2003). Self-efficacy is proven to trigger and sustain behavioral changes in many domains including academic achievement (Marsh & Seaton, 2013). For example, mathematical problems are explained to students and students are asked to judge their abilities to solve problems. Students who have higher mathematics self-efficacy levels set higher goals and persist longer where they encounter challenges (Wolters & Rosenthal, 2000). Much research has shown a medium or strong relationship of mathematics self-efficacy effect on mathematics achievement that consistent with Bandora’s self-efficacy theory (Hackett & Betz, 1989; Stevens, Olivarez, & Hamman, 2006; Causapin, 2012).
B
C A
B
C
A B
C A
Self-concept refers to the person’s composite perceptions about himself/herself on a particular area (Byrne, 1984; Shavelson & Bolus, 1982; Wigfield & Karpathian, 1991). Academic concept can be thought as person’s self-perception of academic ability that is shaped by the interactions with environment and is affected by environmental reinforcements (O’Mara, Marsh, Craven, & Debus, 2006; Valentine, DuBois, & Cooper, 2004; Shavelson, Hubner, & Stanton, 1976). It is anticipated that students who have more positive views about themselves leading them to become more successful. If students have high levels of self-concept, they engage in more academic related activities including doing homework, participating in class activities, and studying regularly for the exams (Rosen, Glennie, Dalton, Lennon & Bozick, 2010). Previous research revealed a positive effect of mathematics self-concept on mathematics achievement (Wilkins, 2004; Xu, Shi, & Liu, 2008; Möller, Pohlmann, Köller, & Marsh, 2009; Lazarides & Ittel, 2012).
Both self-efficacy and self-concept attracted many researchers to examine their influence on academic functioning
(Bong &Skaalvik, 2003). However, some differences are worth to note. Bong and Skaalvik (2003) states that
self-efficacy relates to convictions for successfully completing an academic task with a perceived confidence whereas academic self-concept more relates to knowledge and perceptions about oneself in academic activities with a perceived competence. Interest has an inevitable role in mathematics achievement. Interest, in general, is defined as the direction of attention and emotion toward anything that helps to perform what is desired to do. The most influential effect for mathematical instruction is that each student brings his or her own interest. When the classroom activities overlap with interest to that particular task, student put more effort and persistence to achieve the goal of the activity (Krapp, 2000; Renninger, 2000; Middleton, 2013). In parallel with this relationship, students who have high mathematics interest tend to involve in mathematics and consider it as essential for their
success and personal development (Lazarides & Ittel, 2012). Research also provided that mathematics interest is a
predictor of mathematics achievement (Heinze et al., 2005; Ebert, 2012).
2. Methods
The graphical structure of a Bayesian network is determined by the conditional probability structure. Whittaker (1990) notes that zeros in the inverse covariance matrix, correspond to pairs of variables which are conditionally independent given the others. Thus, the inverse covariance matrix can be used to form a graphical structure by adding edges to the graph corresponding to non-zero entries in the covariance matrix. Almond (2010) suggests that a covariance matrix from a factor analysis can be used as the basis of this procedure. The graphical structure is undirected, but orienting the edges is straightforward, as is estimating the conditional probability tables given the graphical structure and a large collection of data.
2.1.Data
ST42Q02 is recoded because it was negatively worded. Also, the mathematics achievement score is recoded to seven proficiency categories, which were defined in the PISA technical report (OECD, 2014, p.15).
3.
Results
We obtained the Mardia’s (1970) kurtosis values for both the US and Turkey data for the full model including all variables in the data and reduced model (i.e., three factors model). Full models’ multivariate indices were 129.79 and 134.44, respectively. The reduced models’ multivariate normality indices were 37.79 and 47.56, respectively. Because these values were higher than the recommended cutoff value of 3, the data were considered as multivariate non-normally distributed. We concluded these twelve survey items to be non-normal ordered
categorical variables for both of the samples. Then, we conducted a confirmatory factor analysis to examine the
factor structure of the concepts. Since the nature of data regarding to the non-normal categorical variables, we chose the Weighted Least Squared Mean Variance (WLSMV) estimator that handles non-normal categorical data.
First, we used nine concepts (full model) including mathematics interest, instrumental motivation, self-efficacy, work ethics, perceived control, perseverance, self-concept, mathematics anxiety, mathematics behavior, and openness as full model. Since, most of the concepts had weak relationships between mathematics achievements, we selected the three strongest concepts among them. Table 2 and Table 3 show the difference between full model against three-factor model for US data and Turkey data, respectively.
Table 3. Factor Analysis Results for Turkish students.
Chi-square statistics CFI TLI RMSEA SRMR
Full Model 7915.618 0.740 0.721 0.054 0.066
Three Factors
Model
262.739 0.969 0.960 0.047 0.029
Selecting the three-factor model significantly increases model fit statistics for both of the populations,
X2=6587.14, p<. 001 for full model; X2=282.26, p<. 001 for three factors model (US) and X2=7915.62, p<. 001 for full model; X2=262.74, p<. 001 for three factors model (Turkey). The fit indices for the three-factor model satisfy the cutoff values of fit indices that were recommended by Hu and Bentler (1999).
Table 2. Factor Analysis Results for US students.
Chi-square statistics CFI TLI RMSEA SRMR
Full Model 6587.138 0.812 0.798 0.047 0.061
Therefore, this finding is confirmed by findings by OECD in terms of selecting the stronger concepts related to the mathematics achievement and we continue to use three concepts to establish the Bayesian network.
Following Whittaker (1990), Almond (2010) suggested using inverse covariance matrix to establish regression
among the factors. Table 4 and Table 5 show the covariance matrix between concepts and mathematics
achievement levels for the US and Turkish students from the factor analysis, and Tables 6 and 7 show the inverse covariance matrix.
Table 4. Covariance matrix for factors and mathematics achievement levels for US students.
Math Achieve Math Interest Self-efficacy Self-concept
Math Achieve .
Math Interest -.133 .
Self-efficacy -.399 .139 .
Self-concept -.435 .332 .195 .
Note. Survey items are coded as 1 strongest agreement to as 4 weakest agreements while math achievement score increase as 0 to 6.
Table 5.Covariance matrix for factors and mathematics achievement levels for Turkish students.
Math Achieve Math Interest Self-efficacy Self-concept
Math Achieve .
Math Interest -.096 .
Self-efficacy -.354 .163 .
Self-concept -.194 .374 .152 .
Note. Survey items are coded as 1 strongest agreement to as 4 weakest agreements while math achievement score increase as 0 to 6.
Table 6.Inverse covariance matrix for factors and mathematics achievement levels for US students.
Math Achieve Math Interest Self-efficacy Self-concept
Math Achieve 1.415 -.057 .466 .543
Math Interest -.057 1.133 -.106 -.380
Self-efficacy .466 -.106 1.200 .004
Self-concept .543 -.380 .004 1.361
Table 7.Inverse covariance matrix for factors and mathematics achievement levels for Turkish students.
Math Achieve Math Interest Self-efficacy Self-concept
Math Achieve 1.170 -.016 .391 .174
Math Interest -.016 1.179 -.133 -.424
Self-efficacy .391 -.133 1.167 -.052
Self-concept .173 -.424 -.051 1.200
Scaling the inverse covariance matrix to have a unit diagonal produces a partial correlation matrix (see Table 8 and Table 9). The key idea is that 0’s in the partial correlation matrix represent pairs of variables that are conditionally independent given the other variables in the model. Hence, they should not be connected by edges in the moral graph of the Bayesian network. Tables 10 and 11 show an incidence matrix for the edges in an undirected graphical model based on marking the approximately zero entries of Tables 8 and 9.
Table 8. Partial correlation matrix for factors and mathematics achievement levels for US students.
Math Achieve Math Interest Self-efficacy
Self-concept
Math Achieve 1.000
Math Interest -.045 1.000
Self-efficacy .358 -.091 1.000
Table 10.Q matrix for factors and mathematics achievement levels for US students.
Math Achieve Math Interest Self-efficacy Self-concept
Math Achieve 1 0 1 1
Math Interest 0 1 0 1
Self-efficacy 1 0 1 0
Self-concept 1 1 0 1
Table 11.Q matrix for factors and mathematics achievement levels for Turkish students.
Math Achieve Math Interest Self-efficacy Self-concept
Math Achieve 1 0 1 1
Math Interest 0 1 1 1
Self-efficacy 1 1 1 0
Self-concept 1 1 0 1
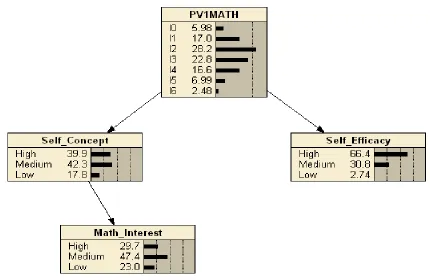
Tables 10 and 11 provide an undirected graphical representation, but Bayesian networks are built over directed graphs. Following Almond (2010), we use maximum cardinality search to provide an ordering that produces a directed graph. The R package CPTtoolswas used for this step (Almond, 2015). Figures 1 and 2 (drawn in Netica; Norsys, 2012) show the graphical structures.
Figure 2.Bayesian network for the US students.
Table 9.Partial correlation matrix for factors and mathematics achievement levels for Turkish students.
Math Achieve Math Interest Self-efficacy Self-concept
Math Achieve 1.000
Math Interest -.019 1.000
Self-efficacy .334 -.114 1.000
Figure 3. Bayesian network for the Turkish students.
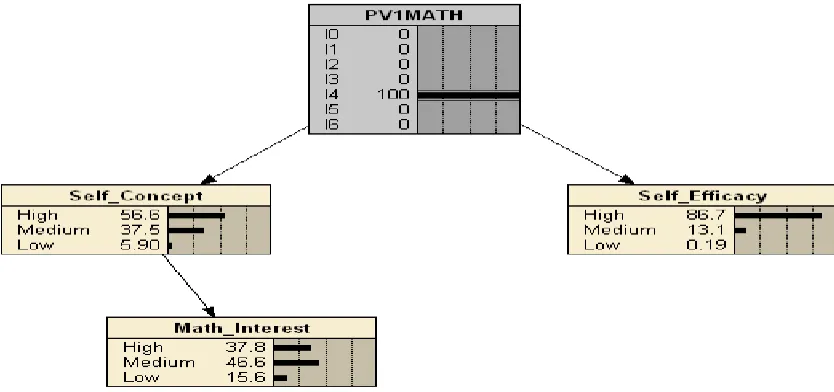
A complete Bayesian network specification requires a conditional probability distribution of each variable in the model given its parents in the graph. Following Almond (2010; see also Almond et al., 2015), we used CPTtools to calculate conditional probability tables based on a series of regression models. First, we performed a series of regressions predicting each child from its parents. Next we discredited the factors in the model. Each item has a range from 1 to 4. The three math attitude factors were split into three discrete states 4-8 (low), 9-12 (medium), and 13-16 (high). For the math achievement score, the PISA achievement levels were used. Figures 1 and 2 show the completed Bayesian networks. The bar graphs inside the nodes of Figures 1 and 2 show the marginal distribution for each of the four variables in the model. However, the Bayesian network is a joint distribution over all the variables. The Netica display in the figures (as is typical for most Bayesian network display packages) is a dynamic display, which allows the user to enter observed data or findings, and observe how the other variables chance conditioned on the findings. Figures 3 and 4 illustrate this idea by entering into each graph a finding that the student has high math interest. The bar graphs in the other nodes now change to conditional probabilities given that math interest is high. In particular, this allows us to compare US and Turkish students with high math interest. Table 12 shows some selected probabilities conditioned on the finding that the student has high math interest.
Table 12. Selected conditional probabilities.
US Students Turkish Students
Baseline High Math Interest Baseline High Math Interest
Pr(High Self Concept) 39.90% 75.60% 25.20% 3.49%
Pr(High Self Efficacy) 68.40% 71.00% 67.30% 81.90%
Pr(Level 6 Math Achievement ) 2.48% 4.52% 1.18% 1.31%
The difference in self-concept, shown in the first line of Table 12, is striking. Conditioning on high math interest shifts the percentage of US students with high self-concept from 40% to 76%, while for the Turkish students it drops self-concept from 25% to 3%. The relationship with self-efficacy is similar in the two countries. In both cases conditioning on high math interest increases self-efficacy.
Table 13.Selected conditional probabilities. \
US Students Turkish Students
Baseline Level 4 Math Achieve Baseline Level 4 Math Achieve
Pr(High Self Concept) 39.9% 56.6% 25.2% 34.2%
Pr(High Self Efficacy) 68.4% 86.7% 67.3% 92.0%
Pr(High Math Interest) 29.7% 37.8% 39.6% 46.1%
Figure 4. Bayes model depicting marginal probabilities after observing high math interest for the US students.
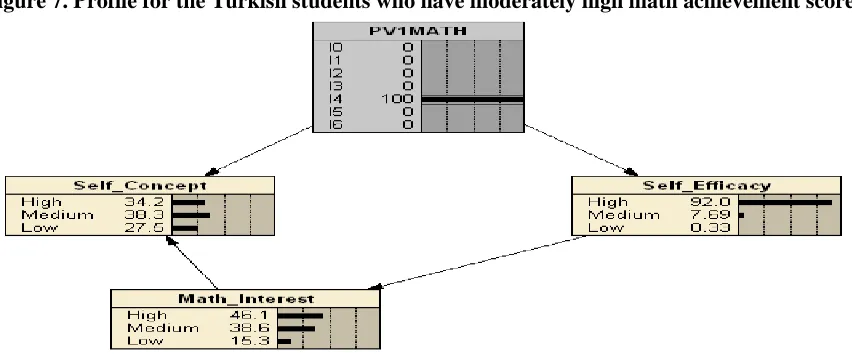
Figure 5. Bays model depicting marginal probabilities after observing high math interest for the Turkish students.
Figure 7. Profile for the Turkish students who have moderately high math achievement score.
Figure 5 and Figure 6 depict that the comparisons of the profile for the students who have moderately high math achievement seem slightly different. Both of the populations have high self-efficacy and similar math interest scores. However, self-concept seems to be much more independent. US students have higher self-concept scores compared to Turkish students.
4.
Discussion and Conclusion
The graphical structure provides a way to visualize the relationship among the four variables. As the graph is fully connected, the four factors are all related, which confirms the findings of other authors (Hackett & Betz, 1989; Wilkins, 2004; Lazarides & Ittel, 2012; Heinze et al., 2005; Stevens et al., 2006; Xu et al., 2008; Causapin, 2012; Ebert, 2012). More interesting is the difference in the graphical structure between US and Turkey (Figures 1 and 2). The lack of an edge between math interest and self-efficacy in the US graph indicates that the relationship is completely mediated by the self-concept and achievement level factors, while in the Turkish data, this is incomplete. It would be interesting to see if similar mediation relationships exist in other large scale assessments that measure those constructs and how other countries compare on these structures.
However, the Bayesian networks provide a tool for dynamic visualization that allows a closer look at the relationships among the variables. Strikingly, when conditioning on high math interest, the self-concept of the US students increased, while that of the Turkish students decrease. Prior research on self-concept suggests that the relationship between math interest and self-concept should be positive, so the negative relationship in the Turkish data is a bit of a puzzle, suggesting cultural differences. Western cultures emphasize the importance of expressing one’s own individuality (Markus & Kitayama, 1991) where Asian cultures favor an interdependent view of the self (Swann, Jetten, Gómez, Whitehouse, & Bastian, 2012). Additionally, Hung and Liou (2013) studied TIMSS 2007 data from Taiwan, Japan, and Hong Kong. These Eastern Asian countries had outstanding academic performance despite low self-concept. This inverse relationship might be because of the high stress of academic performance and the virtue of humbleness in the shared culture (Leung, 2002). Hung and Liou (2013) emphasized that the teachers play important role to improve students’ knowledge of their strengths and weaknesses so that they can improve their self-concept where they are lacking of confidence. It is unclear whether Turkey, which sits on the border between Europe and the Near East, will behave more like its European or Asian neighbors. Building Bayesian network models for other countries might help illuminate that difference.
5.
Limitations and Future Work
In this example, the reason why the relationship between math interest and the other variables was so different probably requires more variables to fully explore. A second issue is the arbitrary cut-off for when to include or not include an edge.We used .1, but changing that value might cause another edge to be added or removed from the model, giving the US and Turkish models different shape. Also, this is only one approach to building an appropriate Bayesian network (Neapolitan, 2004) and others should be explored. A logical next step would be to explore networks for more countries. In particular, it would be interesting to compare Turkey to countries, which are closer to it geographically, particular, countries in Southern Europe and the Near East. If similar patterns hold, it may be worthwhile exploring interventions which change these variables. As PISA is cross-sectional data, it is difficult to infer causal relationships; however, the dynamic nature of the Bayesian network display may suggest places where causal intervention might produce an interesting result. This would in turn suggest a more carefully causal study.
6.
References
Almond, R.(2015). RNetica: R interface to Netica(R) Bayesian Network Engine. R package version 0.3-4. http://ralmond.net/RNetica.
Almond, R. G. (2015). An IRT-based Parameterization for Conditional Probability Tables. In John Mark Agosta, & Rommel N. Carvalho (Eds.), Bayesian Model Application Workshop 2015 (pp. 14-23). CEUR. Retrieved from http://ceur-ws.org/Vol-1565/bmaw2015_paper4.pdf
Almond, R. G. (2010). “I can name that Bayesian network in two matrixes!” International Journal of Approximate Reasoning, 51(2), 167-178.doi:10.1016/j.ijar.2009.04.005
Almond, R. G., Mislevy, R. J., Steinberg, L. S., Williamson, D. M., & Yan, D. (2015). Bayesian Networks in Educational
Assessment. Springer.
Almond, R. G., Shute, V. J., Underwood, J. S., & Zapata-Rivera, J. (2009). Bayesian networks: A teacher’s view. International Journal Of Approximate Reasoning, 50(3), 450-460. doi:10.1016/j.ijar.2008.04.011
Bandura, A. 1986. Social foundations of thought and action: A social cognitive theory. Englewood Cliffs, NJ: Prentice Hall. Becker, R. A. and Cleveland, W. S. 1987.Brushing scatterplots.Technometrics, 29 (2): 127–142.
Bong, M., &Skaalvik, E. M. 2003. Academic self-concept and self-efficacy: How different are they really? Educational
psychology review, 15(1): 1–40.
Byrne, B. M. 1984. The general/academic self-concept nomological network: A review of construct validation research.
Review of educational research. 54:427–456.
Causapin, M. G. A. 2012. Mathematics self-efficacy and its relation to proficiency-promoting behavior and performance
(Order No. 3506120). Available from ProQuest Dissertations & Theses Full Text. (1014166396). Retrieved from "http://search.proquest.com/docview/1014166396?accountid=4840"http://search.proquest.com/docview/101416639 6?accountid=4840
Ebert, K. P. C., 2012. Sustaining student interest in stem: A study of the impact of secondary education environments (school
& home) on students' inclination, achievement and continued interest in math (Order No. AAI3460749). Available
from PsycINFO. (1017620644; 2012-99050-067). Retrieved from
http://search.proquest.com/docview/1017620644?accountid=4840http://search.proquest.com/docview/1017620644? accountid=4840
Friedman, N., Linial, M., Nachman, I., and Pe'er, D. 2000. Using Bayesian networks to analyze expression data. Journal of
Computational Biology, 7(3-4): 601–620. doi:10.1089/106652700750050961
García, P., Schiaffino, S., and Amandi, A. 2008. An enhanced Bayesian model to detect students’ learning styles in Web-based courses. Journal Of Computer Assisted Learning, 24(4), 305–315. doi:10.1111/j.1365-2729.2007.00262.x Hackett, G., and Betz, N. 1989. An Exploration of the Mathematics Self-Efficacy. Journal For Research In Mathematics
Education, 20(3): 261–273.
Hahn, M. M., Lee, K. K., and Jo, N. N. 2015. Scenario-based management of individual creativity. Computers In Human
Behavior, 42: 36–46.
Heinze, A., Reiss, K., and Franziska, R. 2005. Mathematics achievement and interest in mathematics from a differential perspective. ZentralblattfüurDidaktik der Mathematik, 37(3): 212–220. doi:10.1007/s11858-005-0011-7
Hu, L., and Bentler, P. 1999. Cutoff criteria for fit indexes in covariance structure analysis: Conventional criteria versus new alternatives. Structural Equation Modeling: A Multidisciplinary Journal, 6(1): 1–55.
doi:10.1080/10705519909540118
Hung, Y. C., and Liou, P. Y. Examining the relationship between student academic achievement and self-concept in the I/E, BFLPE, and combined models-Evidence from East Asian countries’ data in TIMSS 2007.
Krapp, A. 2000. 5 Interest and human development during adolescence: An educational-psychological approach. Advances in
Lazarides, R., and Ittel, A. 2012. Instructional quality and attitudes toward mathematics: Do self-concept and interest differ across students' patterns of perceived instructional quality in mathematics classrooms? Child Development
Research, 2012.
Leung, F. K. S. 2002. Behind the high achievement of East Asian students. Educational Research and Evaluation, 8(1): 87– 108.
Mardia, K. V. 1970. Measures of multivariate skewness and kurtosis with applications. Biometrika, 57(3): 519–530.
Markus, H. R., and Kitayama, S. 1991. Culture and the self: Implications for cognition, emotion, and motivation.
Psychological review, 98(2): 224.
Marsh, H. W., and Seaton, M. A. R. J. O. R. I. E. (2013). Academic self-concept. International guide to student achievement, 62–63.
Middleton, J. A. 2013. More than motivation: The combined effects of critical motivational variables on middle school mathematics achievement. Middle Grades Research Journal, 8(1): 77.
Möller, J., Pohlmann, B., Köller, O., and Marsh, H. W. 2009. A meta-analytic path analysis of the internal/external frame of reference model of academic achievement and academic self-concept. Review of Educational Research, 79(3): 1129–1167.
Neapolitan, R. E. 2004. Learning bayesian networks. Upper Saddle River, N.J: Pearson Prentice Hall.
Neufeld, E. 1993. Review: Judea pearl, probabilistic reasoning in intelligent systems: Networks of plausible inference. The
Journal of Symbolic Logic, 58(2): 721–721.
Norsys, LLC (2012).Netica(software for Bayesian Inference).Retrieved January, 2016 from http://www.norsys.com.
O’Mara, A. J., Marsh, H. W., Craven, R. G., and Debus, R. L. 2006. Do self- concept interventions make a difference? A synergistic blend of construct validation and meta-analysis. Educational Psychologist, 41(3): 181–206.
Organisation for Economic Cooperation and Development (OECD) 2014, PISA 2012 Technical Report, PISA, OECD
Publishing.
Pearl, J. (1988).Probabilistic Reasoning in IntelligentSystems:Networks of Plausible Inference.San Mateo, CA:Morgan Kaufmann.
Pearl, J. (2009).Causal ineference in statistics:An overview.Statistics Surveys, 3, 96–146.
Renninger, K. A. 2000. “Individual interest and its implications for understanding intrinsic motivation”. In Intrinsic and extrinsic motivation: The search for optimum motivation and performance, edited by C. Sansone and J. M. Harackiewicz , 373–404. New York, NY: Academic Press.
Rosen, J. A., Glennie, E. J., Dalton, B. W., Lennon, J. M., and Bozick, R. N. 2010. Noncognitive Skills in the Classroom:
New Perspectives on Educational Research. RTI International. PO Box 12194, Research Triangle Park, NC
27709-2194.
Salini, S., and Kenett, R. S. 2009. Bayesian networks of customer satisfaction survey data. Journal Of Applied Statistics, 36(11): 1177–1189. doi:10.1080/02664760802587982
Shavelson, R. J., Hubner, J. J., and Stanton, G. C. 1976. Self-concept: Validation of construct interpretations. Review of
educational research, 46(3): 407–441.
Shavelson, R. J., and Bolus, R. 1982. Self-concept: The interplay of theory and methods. J. Educ. Psychol. 74: 3–17.
Siegle, D., and McCoach, D. B. 2007. Increasing Student Mathematics Self-Efficacy through Teacher Training. Journal Of
Advanced Academics, 18(2): 278–312.
Stevens, T., Olivarez, A. J., and Hamman, D. 2006. The Role of Cognition, Motivation, and Emotion in Explaining the Mathematics Achievement Gap between Hispanic and White Students. Hispanic Journal Of Behavioral Sciences, 28(2): 161–186.
Swann Jr, W. B., Jetten, J., Gómez, A., Whitehouse, H., and Bastian, B. 2012. When group membership gets personal: a theory of identity fusion. Psychological review, 119(3): 441.
Valentine, J. C., DuBois, D. L., and Cooper, H. 2004. The relation between self- beliefs and academic achievement: A meta-analytic review. Educational Psychologist, 39(2): 111–133.
West, P., Rutstein, D. W., Mislevy, R. J., Liu, J., Choi, Y., Levy, R., CrawfordCrawford, A., DiCerbo, K.E., Chappel, K. and Behrens, J.T. 2010. A Bayesian Network Approach to Modeling Learning Progressions and Task Performance. CRESST Report 776. National Center for Research on Evaluation, Standards, and Student Testing (CRESST). Wigfield, A., Eccles, J. S., Mac Iver, D., Reuman, D. A., and Midgley, C. 1991. Transitions during early adolescence:
Changes in children's domain-specific self-perceptions and general self-esteem across the transition to junior high school. Developmental Psychology, 27(4): 552.
Wilkins, J. 2004. Mathematics and science self-concept: An international investigation. The Journal of Experimental
Education, 72(4) 331–346. doi:10.3200/JEXE.72.4.331-346
Wolters, C.A. and Rosenthal, H. 2000. The relation between students’ motivational beliefs and their use of motivational regulation strategies. International Journal of Education Research, 33 (7-8): 801–820.
Xu, F., Shi, J., and Liu, H. 2008. Academic self-concept and its relation to academic achievement of middle school students.
Chinese Journal of Clinical Psychology, 16(1), 59–62. Retrieved from