Applications of 3-D Structural Interpretation and
Seismic Attribute Analysis to Hydrocarbon
Prospecting Over X – Field, Niger-Delta
Rotimi Oluwatosin John
1, Ameloko Anthony Aduojo
1, Adeoye O. Taiwo
1 1Petroleum Engineering Department, Covenant University, Canaanland, Ota, Nigeria.
Abstract-- Complexly faulted subsurface configuration is capable of causing erroneous deductions in the absence of a well packaged interpretation approach and workflow for an oilfield exploration programme, thus a well prepared analysis saddled on the use and integration of sufficient data is indispensable to the unravelling of complex field subsurface structure as the search for oil and gas progresses into deeper waters. S uite of signatures from wireline logs and seismic volume was employed to gain more insight into the complexities of the hydrocarbon hosting units within and outside the vicinity of well control in the X-field Niger Delta. Horizons and fault interpretation were carried out to produce subsurface structure maps. Amplitudes of the horizons mapped were extracted and were used to study the distri bution of the hydrocarbon sand.
Three hydrocarbon bearing reservoirs were delineated within the study interval, namely: ROJ A, ROJ C and ROJ D. Well to seismic tie revealed that these reservoirs tied direct hydrocarbon indicators (bright spots) on the vertical sections. The structure maps produced revealed a series of NW-S E and E-W trending growth faults and fault echelons, most of which dip to the south. Fault assisted closure s were revealed at the southern part of the field, which correspond to the crest of roll over structures and possibly served as the trapping mechanism for the reservoirs.
The reflection amplitude of the studied horizons shows a fine network of anomalies that can be correlated to the prediction of the lateral distribution of the hydrocarbon sand. The conclusion of the study was that the western part of horizon ROJ A is a highly prospective area as bright spots were observed in the region. Also in the adjace nt southern direction of this horizon, hydrocarbon accumulations have been confirmed from wells. These gas sands are possibly trapped in anticlinal closures located in the same area. On the other hand, the results from the study of horizon ROJ C suggest development opportunities in the southern area. High amplitude gas sands are seen to spread to the south and stratigraphy was assumed to play a major role in hydrocarbon migration. The study over horizon ROJ D reveal likely geologic features like regional sand pinch outs and channels in the southern part of the field. S pectral decomposition interpretation was suggested to be used further in improving the delineation of the thin reservoir sand bodies and for better outlining of their geometries but was not available on the workstation used.
The study has shown the feasibility of integrating structural interpretation and instantaneous amplitude in prospect identification and reservoir prediction.
Index Term-- reservoirs, fault, hydrocarbon, seismic, amplitudes, structures
I. INT RODUCT ION
Structural interpretation is an important aspect of the development programme of a field. It has diverse application in many areas of 3- D seismic interpretation among which include: helping to effectively analyze controlling influences on reservoir geometry, position and hydrocarbon migration pathways. Structural-stratigraphic integration can allow the spatial correlation of the tectono-stratigraphic sequences [5]. Sometimes the estimate of reserves may even be dependent on structural interpretation when fluid contacts located on depth structure maps are needed as inputs in volumetric analysis [14].
However, the application of structural interpretation to this research has been limited to the description and characterization of the structural styles. Subsurface configurations must be understood in detail to effectively delineate the structures that are favourable for hydrocarbon accumulation [6]. This is because hydrocarbons are found in geologic traps, that is, any combination of rock structure that will keep oil and gas from escaping either vertically or laterally, [21].However these traps can either be structural or stratigraphic. According to [7], majority of the traps in the Niger Delta are structural and therefore focus in th e study has been channelled towards mapping the structural traps available within the study area.
On the other hand seismic attributes have come a long way since their introduction in the early 1970s and have become an integral part of seismic interpretation projects. For example, amplitude, average reflection strength and spectral decomposition are useful tools for locating reservoir quality, outlining their geometry and possibly displayin g lateral changes in thickness [17].
Today, seismic attributes are being used widely for lithological and petrophysical prediction of reservoirs (reservoir characterization) and various methodologies have been developed for their application to broader hydrocarbon exploration and development decision making [3].
Objectives
This study reports the results of an investigation from structural interpretation and instantaneous amplitude attributes to predict reservoir accumulations laterally and away from well control.
will also on the overall provide better and detailed understanding of the subsurface geologic structure in the area for future reference purpose.
This study includes lateral prediction of hydrocarbon prospects outside the vicinity of well control.
II. GEOLOGY SET T ING OF T HE ST UDY AREA The Niger-Delta forms one of the world’s major Hydrocarbon provinces, and it is situated on the Gulf of Guinea on the west coast of central Africa (Southern part of Nigeria). It covers an area between longitude 4 – 9ºE and Latitude 4-9º N (Figure 1). It is composed of an overall regressive clastic sequence, which reaches a maximum thickness of about 12km [11].
Fig. 1. Basemap of X-field, Niger Delta showing well locations
Lithostratigraphy
The Niger-Delta consists of three broad formations [18]. These are the continental top facies (Benin formation) which is the shallowest part of the sequence and consists predominantly of fresh water bearing continental sands and gravels, Agbada formation which underlies the Benin Formation and consists primarily of sand and shale and it is of fluviomarine origin (it is also the hydrocarbon window) and the Akata formation. The lithofacies of the Akata formation is composed of shales, clays and silts at the base of the known Delta sequence. They contain a few streaks of sand, possibly of turbidite origin.
Hydrocar bon Source Rock
There has been much dis cussion about the source rock for petroleum in the Niger Delta which has reflected in [9], [10], [16], [4], [7]. Possibilities include variable contributions from the marine interbedded shale in the
Agbada Formation, the marine Akata shale and the Cretaceous shale [20], [8], [10], [16], [7], [19], [12], [13]. The Agbada Formation has intervals that contain organic -carbon contents sufficient to be considered good source
rocks. The intervals, however, rarely reach thickness sufficient to produce a world-class oil province and are immature in various parts of the delta [11], [19]. The Akata shale is present in large volumes beneath the Agbada Formation and is at least volumetrically sufficient to generate enough oil for a world class oil province such as the Niger Delta. In the case of the cretaceous shale, it has never been drilled beneath the delta due to its great depth; therefore, no data exis t on its source-rock potential [11].
Reservoir Rock
described in [7] as Miocene paralic sandstones with 40% porosity, 2 darcys permeability, and a thickness of 100 meters. The lateral variation in reservoir thickness is strongly controlled by growth faults; the reservoir thickens towards the fault within the down-thrown block [20].
Traps and Seals
Most known traps in Niger Delta fields are structural although stratigraphic traps are not uncommon, [7]. The structural traps developed during synsedimentary deformation of the Agbada paralic sequence [11], [19]. Structural complexity increases from the north (earlier formed depobelts) to the south (later formed depobelts) in response to increasing instability of the under-compacted, over-pressured shale. [7] describe a variety of structural trapping elements, including those associated with simple rollover structures; clay filled channels, structures with multiple growth faults, structures with antithetic faults, and collapsed crest structures. On the flanks of the delta, stratigraphic traps are likely as important as structural traps, [7].
The primary seal rock in the Niger Delta is the interbedded shale within the Agbada Formation. The shale provides three types of seals —clay smears along faults, interbedded sealing units against which reservoir sands are juxtaposed due to faulting, and vertical seals [7].
III. MET HODOLOGY
The structure of the field of s tudy was interpreted using 3-D seismic data integrated with well logs. GeoGraphix software was used to interpret seismic data and to generate maps and well log cross sections.
The gamma ray log was used for Lithology identification (differentiating between sand and shale) since it is acknowledged that, in the Niger Delta, hydrocarbon reservoirs are found within sand units.
Also, in the interpretative process, the identification of wet zones is as important as the discovery of intervals containing hydrocarbons, because the comparison of the two helps clearly identify the presence of hydrocarbons, [2]. This was done with the deep resistivity logs (LLD). It was used to differentiate between water and hydrocarbon in the pores of the delineated sand reservoirs.
Well-to-seismic tie of the hydrocarbon reservoirs were carried out using check-shot data.
Horizon and fault interpretation were then carried out. Interpretation procedure of the main structural framework can be summarized as follows:
1) Identification of main seismic reflectors, from well ties using checkshots.
2) Manual picking of horizons at this spot on inlines and crosslines. A combination of volume autotracking and interpolation were then used to infill the interpretation. 3) Identification of faults networks (synthetic faults and other related secondary faults) on the seismic sections. The time structure maps were generated from the horizons and the mapping range on the seismic section is 1.5milliseconds (ms) to 2.5milliseconds (ms).
The contour interval 20 was used while the minimum and maximum contour were 1360 to 1960, 1480 to 2040, and
1620 to 2180, for horizons ROJ A, ROJ B, and ROJ C respectively. Having carefully carried out the well to seismic volume tie, the depth structure maps were gen erated from them which were used for the deductions.
Using GeoGraphix, amplitude extracts were generated for all the interpreted horizons. Vertical and lateral variations in amplitude were analyzed using the horizon slices.
IV. RESULT AND DISCUSSION
Well Log Interpretation
Hydrocarbons were initially delineated on well logs with the aid of gamma ray and deep resistivity logs. The essence was to test for the availability of hydrocarbon at the location of each exploratory well. This will provide control for reservoir distribution prediction.
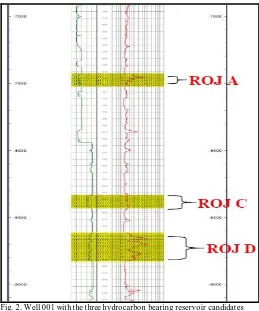
Fig. 2. Well 001 with the three hydrocarbon bearing reservoir candidates mapped (ROJ A, ROJ C, and ROJ D)
Figure 2 shows the interpreted the hydrocarbon -bearing reservoirs formations (Reservoir ROJ A, ROJ C and ROJ D) delineated using the combination of gamma and resistivity logs. The gross thickness of the sandstone formations ranges from between 25m to 69m. Because the reservoir was intercalated with shale, the net thickness varies between 21m to 53m. In all, three hydrocarbon-bearing reservoirs were identified from the wells log analysis within the study interval upon which all interpretations and deductions were based.
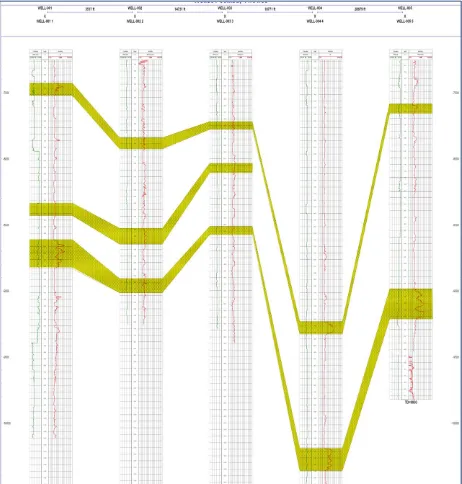
Fig. 3. Arbitrary correlation of the wells in X-field (wells arrangement 001,002,003,004, and 005)
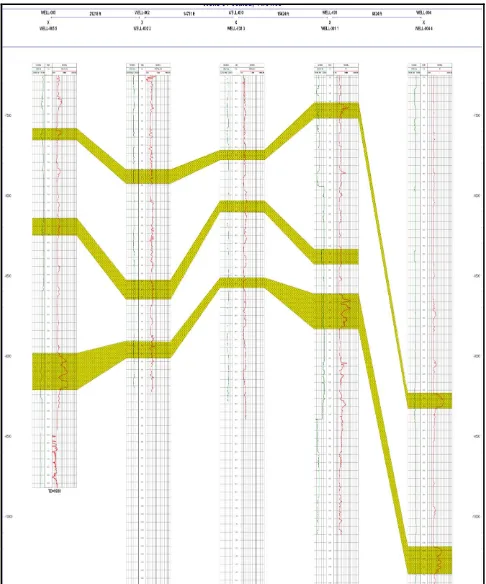
The absence of ROJ C in the most distal well 004 was clearly seen as some more structurally inclined correlations methods were adopted to have an insight into the subsurface lithological patterns of the study area. A basinward correlation done to investigate more on the continuity of ROJ C proved successful as the formation was not sampled by the most proximal well, a situation which was revealed to have occurred as a res ult of increased lithological and structural instability (figure 4).
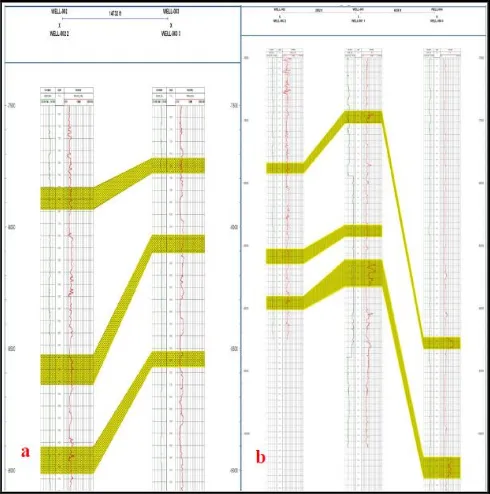
Fig. 5. Wells correlation in the strike (a) and dip (b) direction for the formations mapped
T he whole reservoir packages are embedded with shales which are serving as seals for the trapped hydrocarbon.
Horizon and Fault Interpretation
The 3D seismic data was interpreted on an interactive workstation. The three key horizons (ROJ A, ROJ C and ROJ D) were interpreted and mapped using adequate seismic to well correlation and their seismic continuity. Bright spot reflections were also observed as horizon tracking continued.
Horizon ROJ A is characterized by Low-to-high or variable amplitude reflections, with poor-to-low continuity. In some places, it is disturbed by some truncations which are more of fault related than lithologic heterogeneity.
Horizon ROJ C was characterized by high amplitude moderate-to-good continuity reflections, mostly appearing parallel-to- sub parallel.
Horizon ROJ D was characterized by high amplitude with moderate-to-good continuity reflections, mostly disturbed by some truncations.
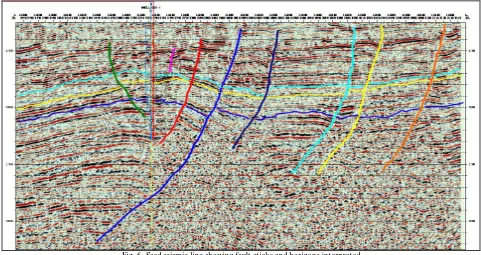
Fig. 6. Seed seismic line showing fault sticks and horizons interpreted Faults A1, A3, and A4 trend approximately east-west while
fault A2 trend northeast – southwest and Fault A5 trend north west- southeast. All faults dip in the south except the antithetic fault A8 that dips counter-current in the northern direction.
Interpretation of Structure Maps Horizon ROJ A
From the horizon and fault interpretation, structure maps
were produced. Structural highs are stretch over the field in the northeastern direction while structural lows were observed in the southwest.
Figure 7 is the depth structure map of horizon ROJ A. The field fault population is characterized mostly by east-west trending faults that are curvy- shaped, all almost parallel to the main fault boundary (Growth fault A1).
The only antithetic fault A8 is of limited lateral extent and of no much effect on the layout of the prospect, as it does not form any compartment in the field. It is clear in this picture that the deformation increases in the northeast direction, particularly along the major growth fault.
The possible petroleum trapping system are the large roll over anticlines on the hanging wall of the thrusts most appearing as dip closed structures while some of the closures have a dependency on fault components along their south eastern thrust (pushed) margins in the southern part of the field.
In the northeastern part of the field, a fault-assisted closure was observed at the two way time of 2460 and 2550ms on the vertical seismic sections. This closure closes on fault A3 and A5. This zone also forms a potent trapping system. The vertical displacements of the major and subsidiary faults were measured from both vertical seismic sections (inlines and crosslines) and well log cross section and it was
observed that the amount of throw varied from line to line but averagely is in the range of 30ft and increases in the northern part of the field (between 83-148ft). Therefore it is suspected that the little vertical offsets along these faults may help in acting as lateral flow barriers. Growth fault A1 for example has a throw of about 22ft in this horizon and therefore may be sealing although further analysis like shale gouge ratio along the fault planes need to be carried ou t.
Horizon ROJ C
Horizon ROJ C (Figure 8) is similar in characteristics to the horizon ROJ A although it is located at a considerable deeper depth, but they have the same style structurally. The ten synthetic faults (A1, A2, A3, A4 A5, A6 A7 and A8) identified on the depth structural map of horizon ROJ A were seen to penetrate this horizon with an additional one antithetic fault labelled A11.
Fig. 8. Depth structure map of the horizon ROJ C with faults polygons
There is a roll-over anticlinal closure at some portions of the field - southern and western part. The closure was observed at the depth of 7450ft. This structure is consistent with the
roll over anticline previously identified in the conformably overlying horizon (horizon ROJ A).It is a possible trap for hydrocarbon. Some of the closures are marked X. It tallies
X
with the crest of a rollover anticline observed on the vertical seismic sections. This closure was observed at the two -way travel time of 2760ms on the seismic line mapped. It is strongly bounded by the growth fault (A4) and antithetic fault towards its flanks. Well information reveals hydrocarbon shows (from reservoir ROJ A) in wells 005, 002 003 and 001 in this area. So it is presumed that the hydrocarbon accumulation here is located within good traps with the embedding shale serving as seals. However the map shows that there is a decrease in area of the closure at the center of the field. The anticline trends northward, but the
axis turns northeastward on the north, as the fold enters the adjoining fault.
Two of the faults are synthetic growth faults (as they have been previously identified on horizon ROJ A). They are evenly distributed. Growth faults A4 and A5 trend east -west while the others (antithetic faults and other subsidiary faults) also trend east-west and in the northwest-southeastern direction as seen on vertical seismic sections.
The vertical displacement of the major and subsidiary faults was measured from both vertical seismic sections (inlines and crosslines) and well logs cross section. It was observed that the amount of throw varied from line to line but on the average it is not less than 50ft and increases in the northern part of the field (between 34-140ft). This little to moderate
vertical offsets along the faults may assist fault sealing capability of the faults.
Horizon ROJ D
This formation of interest occurs deeper in the field of study and has it sampled by all the wells correlated (Figure 9). All faults delineated in the earlier horizon are all presen t and can easily be seen to penetrate this horizon, and all faults except the antithetic fault dip in the same direction (South).
The figure reveals the growth faults (A1, A2 and A3) in the middle and northern portion of the area. It is observed as sets of increased pene-contemporaneous faults and sedimentation, with their intensity increasing towards the east and other major deformation observed are the anticlines, created by their attendant cumulative structural instability. The fault themselves appear as curvilinear shaped. The degree of curvature ranges from linear to crescent and to very wavy –shape.
The possible petroleum trapping system is the large roll over anticline in the southern part of the field. It appears as fault dependent closure, with fault (A1, A11 and A5) cutting through it. Hydrocarbons are trapped in the hanging wall of the anticline as revealed by well information from well 002, 001, and 004 from the dip line correlation panel (figure 5).
The closure at the far south-eastern part of the field would have provided a good trap for hydrocarbon but for the limitations of the data which ends abruptly at this point and the tendency of hydrocarbon leaking at this location. This closure was observed at the two way travel time of 2760ms (7550ft). It is broken up by synthetic faults A1 and A2 towards its flanks. It is considered a probable trapping system.
V. AM PLITUDE MAP INTERPRETATION
Horizon ROJ A
The idea of utilizing amplitude for the analysis is from the assumption that lithology, rock properties and fluid content should affect seismic character.
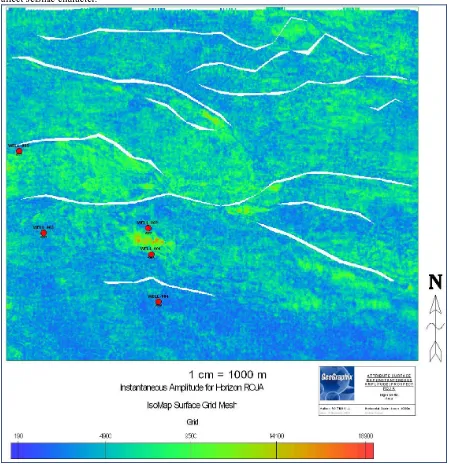
Figure 10 is the instantaneous amplitude map of horizon ROJ A. The high amplitudes zones on the map seem to be constrained to three major color bands (red, light yellow and green). At the south-west the high amplitudes zones (red colour), seen, are believed to originate from acoustic impedance contrast of the hydrocarbon saturated sand and the embedding shale. The red and orange colors were interpreted as outlining the hydrocarbon sand portions where hydrocarbon accumulations have been previously confirmed (from wells).
Fig. 10. Instantaneous amplitude map for horizon ROJ A with fault polygons
Interestingly, on the seis mic sections these zones have been observed as bright spots. Based on their geometry, we tend to believe the reservoir types are point bars of distributaries channels. The explanation assumed was that distributary
channels cut into the underlying unconformities and probably resulted into the point bar deposits.
(blue) was interpreted to come from lateral lithofacie changes. However, it would have been lovely to further delineate the thickness of the sandstone accumulations by using spectral decomposition but for the unavailability of spectral decomposition on the software package that was used.
Horizon ROJ C
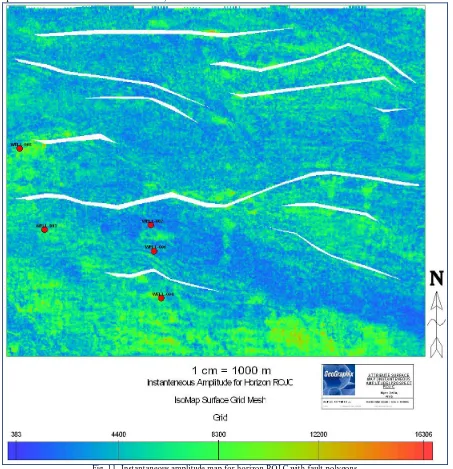
Figure 11 shows amplitude distribution over horizon ROJ C. High amplitude features are seen in the South, south -west
and pockets in the north and east. Farther north west, broad high amplitude anomalies are also seen.
In the Northwestern segment of the field, the high amplitude feature trending in the NW-SE direction correlates with the truncation of the Shale at the drilled wells; a low impedance unit that is 9-18 m (30-60 ft) thick is observed. According to [3], a shape or pattern which is unrelated to structure may prove to be interpretable as a depositional, erosional or lithologic feature.
Fig. 11. Instantaneous amplitude map for horizon ROJ C with fault polygons
Therefore, we assume drastic lateral variations in amplitude here may suggest fast lateral stratigraphic changes. In the South-west high amplitude features (dots of red and yellow) observed as east-west trending lineaments, broadening away from wells 002, 003 and 005 were suspected as channels (from their meandering geometry). They were interpreted as younger sand bodies (channel sand fills) as carrier beds conveying hydrocarbons migrating into their respective
traps. Although this formation was found to have thinned out in the most distal well 004 more light colored band are encountered which is an indication of greater accumulations of hydrocarbon basinward.
slice opened along this portion on the seismic volume. Blue colored areas may likely represent shale or any other high impedance layer. Higher amplitudes represented by red
bands likely represent the stacks of highest sand accumulation but do not necessarily reflect reservoir quality.
Horizon ROJ D
In the southern part of the field of Figure 12, high amplitude oriented portion NW-SE is seen, but this is much beyond well 004 having hydrocarbons (from well logs) in the low amplitude zone (Blue colours). Thus it appears here, that, amplitude may be a poor predictor of both the non economic and the pay sands, probably because it is affected by the thin nature of the reservoirs in well 004 which is obviously in a downthrown segment of the syndepositional episode of the field of study to the more distal southern end [1].
Using spectral decomposition technique would provide better outlining of the (thin) reservoir geometry and therefore better prediction, although this is not available on the software used.
Geologic features with high amplitudes similar to a lobe occurring in the centre of the field could be regional sand pinch outs or sand bars within the channels. Along th e northern dip-controlled boundary the amplitude gradient can be extrapolated to find the actual down-dip reservoir limit. The figure also reveals that a concentration of low amplitude (blue) features can be observed in the centre and also over the entire field. This may represent thick clay bodies or shale development within the parallic and continental sequences in the delta fringe.
Fig. 12. Instantaneous amplitude map for horizon ROJ D with fault polygon
VI. CONCLUSIONS
The research involved the delineation of hydrocarbon bearing reservoirs on well logs at a depth of between 8,000ft (2,134m) and 11,500ft (3,507m), 3-D structural
that hydrocarbon bearing reservoirs were associated with bright spots on seismic sections. The bright spots were seen on attribute surface analysis carried out on the horizon slice as high amplitude zones. They were used to map the lateral continuity of the gas sand observed in the southern part of the field.
Three horizons were studied and seven faults mapped for the purpose of carrying out 3-D subsurface structural
interpretation. These were used in generating the time structure maps that were subsequently converted to depth structure maps. From the maps, it was observed that the principal structure responsible for hydrocarbon entrapment in the field for the three horizons considered are the structural highs at the southern and south-western part of the field. These structures correspond to the crest of rollover structure in the field.
VII. ACKNOWLEDGEMENT
The Shell Petroleum Development Company is well appreciated for the release of the data for this study. Special thanks to the donor of the subsurface research laboratory in the Geology Department, University of Ibadan, for donating the workstation and providing the license used for interpretation. The assistance of Dr. Orodu in proof reading the manuscript is also appreciated.
REFERENCES
[1] Ainsworth, R. B., (2005) Sequence stratigraphic-based analysis of reservoir connectivity: influence of depositional architecture – a case study of a marginal marine depositional setting. Petroleum Geoscience, EAGE/ Geological Society, London. 11, 257 -276 [2] Asquith G, (2004) Basic well log analysis. AAPG methods in
exploration series: American Association of Petroleum Geologists, T ulsa, Oklahoma, 16, 12-135
[3] Brown A. R., (2004) Int erpretation of three-dimensional seismic data: American Association of Petroleum Geologists, Memoir 42 SEG investigations in geophysics, 9, 12-99
[4] Bustin, R. M., (1988) Sedimentology and characteristics of dispersed organic matter in T ertiary Niger Delta: origin of source rocks in a deltaic environment: American Association of Petroleum Geologists Bulletin, 72, 277-298.
[5] C obos, L. S., (2005) Structural Interpretation of the Monagas Foreland T hrust Belt, Eastern Venezuela. *Adapted from extended abstract prepared for presentation at AAPG Annual Convention, Dallas, T exas, April 17-21, 2004.
[6] C offen, J. A., (1984) Interpreting seismic data: Penwell Publishing Company, T ulsa Oklahoma. 39-118.
[7] Doust, H., and Omatsola, E., (1990) Niger Delta, in, Edwards, J. D., and Santogrossi, P.A., eds., Divergent/passive Margin Basins, AAPG Memoir 48: Tulsa, American Association of Petroleum Geologists, 239-248.
[8] Eje dawe , J.E., (1979) Patterns of incidence of oil reserves in Niger Delta Basin: American Association of Petroleum Geologists, 65, 1574-1585.
[9] Ekwe oz or, C . M., Okogun, J.I., Ekong, D.E.U., and Maxwell J.R., (1979) Preliminary organic geochemical studies of samples from the Niger Delta, Nigeria: Part 1, analysis of crude oils for triterpan es. Chemical Geology, 27, 11-28.
[10] Ekwe oz or, C .M., and Okoye, N.V., (1980) Petroleum source-bed evaluation of T ertiary Niger Delta: American Association of Petroleum Geologists Bulletin, 64, 1251-1259
[11] Evamy, B.D., Haremboure, J., Kamerling, P., Molloy, F.A., and Rowlands, P.H., (1978) Hydrocarbon habitat of Tertiary Niger Delta: American Association of Petroleum Geologists Bulletin, 62, 1 -39. [12] Frost, B.R., (1997) A Cretaceous Niger Delta Petroleum System, in,
Extended Abstracts, AAPG/ABGP Hedberg Research Symposium, Petroleum Systems of the South Atlantic Margin, November 16-19, 1997, Rio de Janeiro, Brazil.
[13] Haack, R.C., Sundararaman, P., and Dahl, J., (1997) Niger Delta petroleum System, in, Extended Abstracts, AAPG/ABGP Hedberg Research Symposium, Petroleum Systems of the South Atlant ic Margin, November 16-19, 1997, Rio de Janeiro, Brazil. [14] Jon G. and Richard S., (2004) Petroleum Geoscience: Blackwell
Publishing, USA. 54 – 112
[15] Kulke, H., (1995) Regional Petroleum Geology of the World. Part II: Africa, America, Australia and Antarctica: Berlin, Gebrüder Borntraeger. 143-172.
[16] Lambe rt-Aikhionbare, D. O ., and Ibe , A.C ., (1984) Petroleum source-bed evaluation of the T ertiary Niger Delta: discussion: American Association of Petroleum Geologists Bulletin, 68, 387-394. [17] Ryan Neal J. O (2007) Seismic and well log attribute analysis of the
Jurassic Entrada/curtis interval within the north hill creek 3 -D Seismic survey, uinta basin, Utah, a case history. An unpublished T hesis, Brigham Young University.
[18] Short S. and Stauble G. (1967) Outline of Geology of Niger Delta: American Association of Petroleum Geologists Bulletin pp. 761 -768 [19] Stache r, P., (1995) Present understanding of the Niger Delta
hydrocarbon habitat, in, Oti, M.N., and Postma, G., eds., Geology of Deltas: Rotterdam, A.A. Balkema.
[20] W e ber, K. J., and Daukoru, E.M., (1975) Petroleum geology of the Niger Delta Proceedings of the Ninth World Petroleum Congress, Geology: London, Applied Science Publishers, Ltd., 2, 210-221. [21] W an Qin (1995) Reservoir delineation using 3-D seismic data of the
Ping Hu field, East China, T hesis, University of Colorado. 6-8
Biography
Rotimi O . John has a BSc and MSc degree in Geology and Applied geophysics respectively from two foremost and reputable universities in Nigeria. His research interests are in reservoir characterisation, structural analysis and interpretation of subsurface units, and subsurface architectural modelling of oil fields. Currently he is working on recent trends in the determination of vertical heterogeneity in saturation of hydrocarbon phases. He is a PhD student in the Petroleum Engineering Department of Covenant University, Canaanland, Nigeria. Email- orotimi@covenantuniversity.com
Ame loko A. A. attended the University of Jos, Nigeria after his secondary school education between 1994 and 1999, where he bagged a Bachelor of Science degree (B.Sc.) in Geology and Mining. He earned his master’s degree from ABU Zaria in May 2006. He currently lectures geosciences in the department of Petroleum Engineering, Covenant University Ota, Ogun State. His research interests are in electrical imaging and seismic methods of exploration geophysics. Email- aduojo2001@yahoo.com

