AN APPROACH FOR RETRIEVING AN IMAGE USING GENETIC
ALGORITHM
R Shiva Shankar1, K Sravani2, L V Srinivas3 & D Ravibabu4
1. INTRODUCTION
In past, pictures were seen largely within the type of building plans and maps. The necessity and use of pictures grew with the time, significantly with the arrival of photography round the sixteenth century. The introduction of laptop and advances in science and technology gave birth to low value and economical digital storage devices and therefore the World Wide net, that successively became the catalyst for increasing acquisition of digital data within the type of pictures.
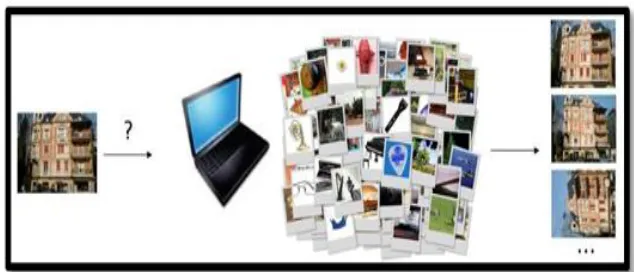
People usually need expeditiously storing and retrieving image knowledge to perform assigned tasks and to form a call. Therefore, developing correct tools for the image retrieval on the idea of image content from massive image information is difficult [1]. Generally the square measure has two different kinds of approaches (1) text primarily {based} retrieval (2) content based retrieval, square measure typically adopted in image retrieval. Within the text-based system, the photographs square measure manually outlined by text descriptors and so employed by a management system to perform image retrieval. However, square measure has two restrictions of exploitation one of the approaches within the keywords accustomed succeed image retrieval. The big works is needed to do for manual image annotation and therefore the task of describing image content is extremely subjective [2, 3]. The side of matter descriptions given by Associate in nursing commentator may well be completely different from the angle of a user. In alternative words, the square measure inconsistencies between users matter queries and image annotations or descriptions. In Fig 1, the image retrieval is distributed in stepwise with the image contents. This system is supposed content-based image retrieval (CBIR). The first goal of the CBIR system is to construct pregnant descriptions of physical attributes from pictures to facilitate economical and effective retrieval [4].
Fig 1: General View for Image Retrieval Problem.
1
Assistant Professor, Dept. of CSE, S.R.K.R Engineering College, Bhimavaram, AP, India
2
Assistant Professor, Dept. of CSE, S.R.K.R Engineering College, Bhimavaram, AP, India
3
Assistant Professor, Dept. of CSE, S.R.K.R Engineering College, Bhimavaram, AP, India
4
Assistant Professor, Dept. of CSE, S.R.K.R Engineering College, Bhimavaram, AP, India
International Journal of Latest Trends in Engineering and Technology
Vol.(9)Issue(2), pp.057-064
DOI: http://dx.doi.org/10.21172/1.92.10
e-ISSN:2278-621X
Abstract: The use of digital image retrieval process has escalated dramatically. This System is used to for retrieving images from large databases. So, the problems of image retrieval are becoming widely recognized. In order to increase the accuracy of image retrieval, a technology generally referred to as content-based Image retrieval (CBIR) is proposed. We proposed an image extractor method using genetic algorithm on multi feature similarity synthesis extended by using relevance feedback methods to magnify retrieval performance. Here the similarity measure is performed between the query image features and the database image features. The CBIR systems do not have potential to efficiently allied with human perception. The experimental result shows feature selection using Genetic algorithm reduces the time for retrieval and also increases the retrieval precision, thus it gives better and faster results as compared to traditional methods of image indexing techniques using features like color, texture and fusion of color-texture feature similarity score with equal weights.
CBIR has become Associate in nursing innovative and leading analysis space in image retrieval within the last decade. An enormous analysis activities in CBIR have progressed in following areas (1) region-level options based (2) world image properties based (3) connectedness feedback and (4) linguistics based image retrieval. Initially, developed algorithms exploit the low-level options of the image like color, texture, Associate in nursing form of an object to assist retrieve pictures [5]. It's a lot of easier to implement and perform well for pictures that square measure either straightforward or contain few linguistics contents. However, the linguistics of a picture square measure troublesome to be disclosed by the visual options, and these algorithms has several limitations once managing broad content image information. Therefore, to boost the potency and retrieval accuracy of CBIR systems, region primarily based image retrieval strategies exploitation initial low level segmentation were introduced [6,7]. These strategies commit to overcome the drawbacks of worldwide options by representing pictures at object presents within the image obtained by combining the low level options that is meant to be near the perception of human sensory system. However, the performance of those strategies is especially supported potency of initial segmentation and extraction technique. The distinction between the user’s data want and therefore the image illustration is termed the linguistics gap in CBIR systems. The foremost drawback within the retrieval accuracy of pictures is central base of retrieval systems that is basically owing to the inherent linguistics gap. To scale back and top off the gap, the interactive connectedness feedback is introduced into CBIR. The judgment of human perception is one amongst the key motivating reasons to form use of interaction model and specifically connectedness feedback in CBIR systems. Human perception judgment may be appeared at the various level of judgment [8].
The basic plan behind connectedness feedback is to include human perception judgment into the question method and supply users with the chance to gauge the retrieval results. There square measure differing kinds of similarity measures that square measure mechanically refined on the idea of those evaluations. However, though connectedness feedback will considerably improve the retrieval performance, its relevance still suffers from many drawbacks. However, understanding and discovering the semantic-based image retrieval square measure high level psychological feature tasks and so exhausting to change [9]. There square measure completely different approach of CBIR algorithms has been planned; however most of them target the similarity computation part to search out effectively and expeditiously a desired image or a gaggle of pictures that square measure like the given question. To realize higher results of the user’s selection data want for the subsequent search within the image information, involving user’s interaction is important for a CBIR system [10, 11]. During this paper, we tend to review a user-oriented CBIR technique that uses the genetic algorithmic program (GA) to infer that pictures within the databases would be of most interest to the user. There are 3 visual options, color, texture, and shape, of a picture square measure utilized in our approach [12]. GA provides Associate in nursing interactive mechanism to higher capture user’s intention. There square measure only a few CBIR systems considering machine learning, however [5] is that the representative one. They thought of the red, green, and blue (RGB) moreover as HSV, YCbCr color model.
2. PROBLEM FORMATION
An image is Kinsfolk’s areas unit is ready to justify a narrative from a picture on the idea of observations and specifically their background. One necessary question that arises is whether or not it will be develop AN intelligent model to find out image ideas like human. There’s little question that the formidable efforts are created to develop AN intelligent model within the past decade. The foremost simple kind of image retrieval systems, merely asks the user to specify one or additional relevant pictures. To boost the question results, some systems enable the user to manually modification the burden of image options. This offers higher weights to options within which example pictures area unit similar and provides lower weights to those options wherever the pictures dissent. Some systems enable the users to specify digressive pictures as negative examples [13]. This approach, however, introduces undesirable aspect effects as a result of it tries to cluster negative examples into one category. Truly, negative examples will be several categories of pictures within the info.
There is a unit some literatures that survey the foremost necessary CBIR systems. Also, there are units some papers that summary and compare this techniques during this space. Since the first studies on CBIR, varied color descriptors are adopted. Yoo et. al. planned a signature-based color-spatial image retrieval system. A CBIR theme supported the world and native color distributions in a picture are given. Votive et. al. have introduced AN integrated approach for capturing special variation of each color and intensity levels and shown its quality in image retrieval applications.
3. PROPOSED SYSTEM
Content based mostly image retrieval system typically provides a graphical computer program for retrieving data and human action with the user. It collects the specified options, together with the question image, and conjointly same options from pictures within the info from the user and displays the retrieval results to him. However, because the pictures area unit matched supported low-level visual options, the target or the similar pictures is also isolated from the question within the feature area, and that they aren't came back within the restricted variety of retrieved pictures of the primary show. Therefore, in some retrieval systems, there's a connation feedback from the user, wherever human and laptop will act to extend retrieval performance. Before matching of similarity options we've divided the pictures in KxK blocks to supply the block wise compression. Consistent with the said thought, we have a tendency to style a graphical computer program image retrieval system supported GA, as shown in Fig 1. Our technique of operations is explained as in Fig 2:
Fig 2: Block Diagram for Proposed System
3.1 RGB Color Space:
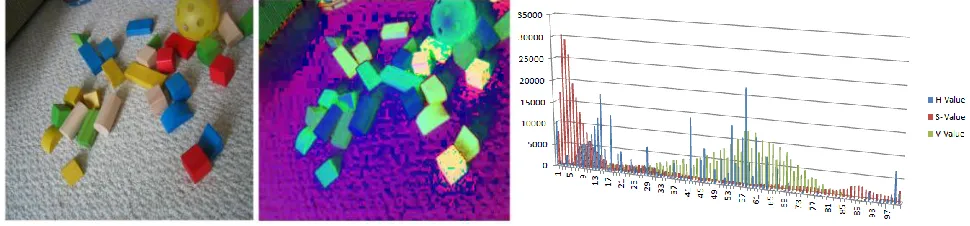
A bar graph will be N-dimensional. though more durable to show, a three-dimensional color bar graph for the on top of example might be thought of as four separate Blue histograms, wherever every of the four histograms contains the Red-Blue values for a bin of inexperienced (0-63, 64-127, 128-191, and 192-255).The bar graph provides a compact summarization of the distribution of knowledge in a picture. The color bar graph of a picture is comparatively invariant with translation and rotation concerning the viewing axis, and varies solely slowly with the angle of read. By scrutiny histograms signatures of 2 pictures and matching the color content of 1 image with the opposite, the color bar graph is especially similar temperament for the matter of recognizing AN object of unknown position and rotation among a scene. Significantly, translation of AN RGB image into the illumination invariant rg-chromaticity area permits the bar graph to control well in variable light-weight levels.
3.2 HSV Color Space:
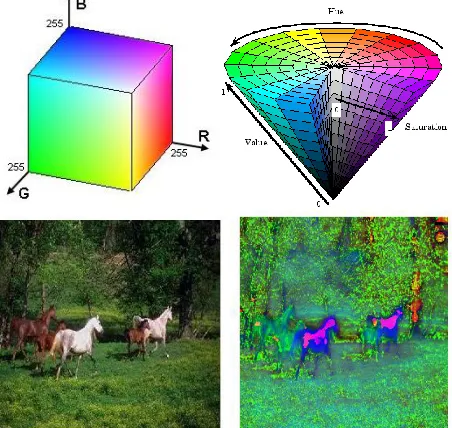
A three dimensional illustration of the HSV color area may be a hexatone, wherever the central vertical axis Represents the Intensity. Hue is outlined as AN angle within the vary [0,2π] relative to the Red axis with red at angle zero, inexperienced at 2π/3, blue at 4π/3 and red once more at 2π. Saturation is that the depth or purity of the color and is measured as a radial distance from the central axis with price between zeros at the middle to one at the outer surface Fig 3. For S=0, in concert moves higher on the Intensity axis, one goes from Black to White through varied reminder grey.
Fig 3 :(a)RGB Image; Fig3:(b)HSV Image Fig 3 :( c) HSV Calculation
calories the HSV area will be reworked to a shade of grey by sufficiently lowering the Saturation. The worth of Intensity determines the actual grey shade to that this transformation converges. Once Saturation is close to zero, all pixels, even with completely different Hues look alike and as we have a tendency to increase the Saturation towards one, they have a tendency to induce separated and area unit visually perceived because the true colors delineated by their Hues as shown in figure one. Thus, Eq.1 shows low values of Saturation, a color will be approximated by a grey price such by the magnitude whereas for higher Saturation; the color will be approximated by its Hue.
(V) = 1.0 – (1)
The Saturation threshold that determines this transition is once more captivated with the Intensity. It’s determined that for higher values of intensity, a saturation of zero.2 differentiate between Hue and Intensity dominance shown in Fig 4. Presumptuous the most Intensity price to be 255, we have a tendency to use the subsequent mathematical function to work out if a element ought to be delineated by its Hue or its Intensity as its dominant feature. Within the on top of equation, we have a tendency to see that for V=0, th(V) = 1.0, which means that each one the colors area unit approximated as black no matter be the Hue or the Saturation. On the opposite hand, with increasing values of the Intensity, Saturation threshold that separates Hue dominance from Intensity dominance goes down.
Fig 4: Block Diagram: RGB2HSV Color Component
3.3 Discrete Wavelet Transform:
The wave illustration provides data regarding the variations within the image at totally different scales. In our retrieval context, we might prefer to extract salient points from any a part of the image wherever “something” happens within the image at any resolution.
Fig 5: DWT Process
is obtained because the convolution of the image with the wave performs expanded at totally different scales. We have a tendency to think of orthogonal wavelets with compact support as shown in Fig 6.
Fig 6: DWT Segment Images 3.4 Entropy Features
E = entropy (I) returns E, a scalar price representing the entropy of single plane image I as shown in Eq 2. Entropy could be a applied mathematics live of randomness that may be accustomed characterize the feel of the input image. Entropy is outlined as
Entropy = - (2)
Where p contains the bar graph counts. By default, entropy uses 2 bins for logical arrays and 256 bins for uint8, uint16, or double arrays.
3.5 Genetic Algorithm:
GAs, among the sphere of organic process computation, is robust, process, and random search procedures sculpture square on the mechanics of natural genetic systems. GA’s square measure familiar for his or her talents by expeditiously exploring the unknown regions of the search area and exploiting the data gained via search within the neighborhood of known prime quality solutions.
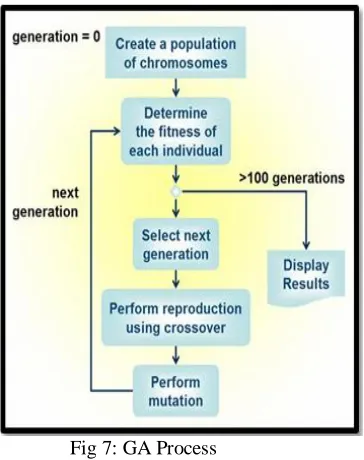
In general, a GA contains a fixed-size population of potential solutions over the search area. These Potential solutions of the search area square measure encoded as binary or floating-point strings, referred to as chromosomes and it is shown in Fig 7.
Fig 7: GA Process
The initial population will be created every which way or supported the matter specific data. In every iteration, referred to as a generation, afresh population is made supported a preceding one through the subsequent 3 steps:
3.6 Evaluation
Each body of the recent population is evaluated employing a fitness perform and given a worth to denote its advantage
3.7 Selection
3.8 Mating
Genetic operators like crossover and mutation square measure applied to the chosen chromosomes to provide new ones for consecutive generation.
The aforesaid 3 steps square measure iterated for several generations till a satisfactory answer is found or a termination criterion is met. GAs has the subsequent blessings over ancient search methods:
They directly work with cryptography of the Parameter set;
The search method is dole out from a population of potential solutions. Pay-off data is employed rather than derivatives or auxiliary data. Probabilistic transition rules square measure used rather than settled ones.
Recently, since the computation talents of computers became staggeringly increased, GAs is wide applied in several areas of engineering like signal process, system identification, and information mining issues. The author projected a genetic-based answer for a coordinate transformation take a look at of worldwide Positioning System positioning.
Through recurrent rounds of content generation and fitness assignment, immune gamma globulin allows distinctive content to evolve that suits the user’s preferences. supported this reason, immune gamma globulin will be accustomed solve issues that square measure troublesome or not possible to formulate a process fitness perform, as an example, evolving pictures, music, numerous creative styles, and forms to suit a user’s aesthetic preferences.
3.9 Solution representation:
In order to use GA to a given drawback, one needs to build a call to search out associate applicable genotype that the matter wants, i.e., the body illustration. Within the projected approach, a body represents the thought of 3 styles of image options (i.e., color, texture, and edge) in a picture.
3.10 Initial population:
The immune gamma globulin needs a population of potential solutions to be initialized at the start of the GA method. Usually, the low-level formatting method varies with the applications; here, we have a tendency to adopt the primary question results of a sample image as initial candidate pictures.
3.11 Fitness function:
The fitness perform is utilized to gauge the standard of the chromosomes within the population. The utilization of immune gamma globulin permits the fusion of human and pc efforts for drawback finding. Since the target of our system is to retrieve the photographs that square measure most glad to the users’ would like, the analysis would possibly at the same time incorporate users’ subjective analysis and intrinsic characteristics of the photographs. Hence, in our approach Eq.3 represents, letter of the alphabet quality of a body C with relevance the question q is outlined as
F (q, C) = W1.sim (q, C) + W2.δ (3)
where sim(q,C) represents the similarity live between pictures, δ indicates the impact issue of human’s judgment, the coefficients w1 and w2 confirm the relative importance of them to calculate the fitness, and Σ WI = one. In this, they're each set to zero.5. The similarity live between pictures is outlined as in Eq 4.
Sim(q,C)= (4)
+ + +
3.12 Genetic operators:
The selection operator determines that body’s square measure chosen for sexual activity and the way several offspring that every elect chromosome produces. Here, we have a tendency to adopt the tournament choice methodology as a result of the time quality of its low. It doesn't need a world fitness comparison of all people during a population; thus, it will accelerate the evolution method.
4. FEATURE EXTRACTION
A statistical procedure of examining texture that considers the abstraction relationship of pixels is that the Feature Extraction, conjointly referred to as the gray-level abstraction dependence matrix. The Feature Extraction characterize the feel of a picture by shrewd however usually pairs of element with specific values and during a specified abstraction relationship occur in a picture, making Feature Extraction, and so extracting applied mathematics measures from this matrix. The quantity of grey levels within the image determines the scale of the Feature Extraction. The gray-level co-occurrence matrix will reveal bound properties regarding the abstraction distribution of the grey levels within the texture image. as an example, if most of the entries within the Feature Extraction square measure targeted on the diagonal, the feel is coarse with relevance the required offset.
To create a Feature Extraction, use the grey co-matrix perform. The grey co-matrix perform creates Feature Extraction by shrewd however usually an element with the intensity (gray-level) price I happens during a specific abstraction relationship to a element with the worth j. By default, the abstraction relationship is outlined because the element of interest and also the element to its immediate right horizontally adjacent.
After making the Feature Extraction s, image distinction, energy, Correlation and homogeneity will be computed as follows:
4.1 Contrast:
Gray-level co-occurrence measures the native variations within the matrix. Distinction is zero for a continuing image. The distinction is given in Eq.5
Contrast = (5)
4.2 Correlation:
Element pairs measures the probability incidence of the required. Correlation is one or -1 for a wonderfully absolutely or negatively correlate image. Correlation is Nan for a continuing image. The correlation is given in Eq.6
Correlation = (6)
4.3 Energy:
Feature Extraction provides square components, conjointly referred to as uniformity or the angular moment. Energy is one for a continuing image. The energy is given in Eq.7
Energy = (7)
4.4 Homogeneity:
Feature Extraction diagonal measures the closeness of the distribution of components within the Feature Extraction. Homogeneity is one for a diagonal Feature Extraction computation of entropy. Homogeneity is given in Eq.8
Homogeneity = (8)
An important property of the many textures is that the repetitive nature of the position of texture components within the image. The autocorrelation perform of a picture will be accustomed assess the number of regularity furthermore because the fineness/coarseness of the feel gift within the image.
5. EXPERIMENTAL RESULT 5.1 Similarity Measurement Analysis:
The Eq. 9 have a tendency to employ in derivation the gap between 2 color histograms is that the quadratic distance metric:
d Q I
H
QH A H
IH
t
Q I
2
,
(9) The equation consists of 3 terms. The derivation of every of those terms are explained within the following sections. The primary term consists of the distinction between 2 color histograms; or a lot of exactly the distinction within the variety of pixels in every bin. This term is clearly a vector since it consists of 1 row. The variety of columns during this vector is that the number of bins during a bar graph. The third term is that the transpose of that vector. The center term is that the similarity matrix. The ultimate result d represents the color distance between 2 pictures. The nearer the gap is to zero the nearer the photographs square measure in color similarity. The additional the gap from zero the less similar the photographs square measure in color similarity. As will be seen from the color histograms of 2 pictures Q and that i within the figure below, the color patterns discovered within the Jim Crow square measure entirely totally different.
square measure mated that's the options from the photographs that square measure a lot of almost like the question image square measure combined for the effective retrieval. During this means user will ingeminate the result until he's glad.
6. CONCLUSION
This paper has bestowed a user-oriented framework in interactive CBIR system. In distinction to traditional approaches that area unit supported visual options; our methodology provides AN interactive mechanism to bridge the gap between the visual options and also the human perception. Additionally, the entropy supported the GLCM and edge bar chart is taken into account as texture descriptors to assist characterize the pictures. Above all, the immunoglobulin A is thought-about and used as a semi machine-controlled exploration tool with the assistance of a user that may navigate a fancy universe of pictures. Experimental results of the projected approach have shown many improvements in retrieval performance. More work considering a lot of low-level image descriptors or high-level linguistics within the projected approach is ongoing.
7. REFERENCES
[1] T.C. Lu and C.C. Chang. Color image retrieval technique based on color features and image bitmap. Inf. Process. Manage. 2017 March, 43(2), pp. 461– 472.
[2] X. S. Zhou and T. S. Huang. Relevance feedback in content-based image retrieval: Some recent advances. Inf. Sci 2002 December, 148(1-4), pp. 129– 137.
[3] J. Han, K. N. Ngan, M. Li, and H.-J. Zhang. A memory learning framework for effective image retrieval. IEEE Trans. Image Process. 2005 April, 14(4), pp. 511–524.
[4] M. H. Pi, C. S. Tong, S. K. Choy, and H. Zhang. A fast and effective model for wavelet sub and histograms and its application in texture image retrieval. IEEE Trans. Image Process. 2006 October, 15(10), pp. 3078–3088.
[5] H. Takagi. Interactive evolutionary computation: Fusion of the capacities of EC optimization and human evaluation. Proc. IEEE, 2001 September, 89(9), pp. 1275–1296.
[6] A. Vadivel, S. Sural, and A. K. Majumdar. An integrated color and intensity co-occurrence matrix. Pattern Recognit. Lett. 2007 June, 28(8), pp. 974– 983.
[7] R. Shiva Shankar, A. BalaKrishna, J. Rajanikanth and Ch. Someswara rao. Implementation of Object Oriented Approach to Querry Processing for Video Subsequence Identification. Proc. IEEE. 2012 November, pp.978–982.
[8] Y. Liu, D. Zhang, G. Lu, and W. Y.Ma. A survey of content-based image retrieval with high-level semantics. Pattern Recognit. 2007 January, 40(1), pp. 262–282.
[9] A. W. M. Smeulders, M. Worring, S. Santini, A. Gupta, and R. Jain. Content based image retrieval at the end of the early years. IEEE Trans. Pattern Anal. Mach. Intell.2000 December, 22(12), pp. 1349–1380.
[10] S. Antani, R. Kasturi, and R. Jain. A survey of the use of pattern recognition methods for abstraction, indexing and retrieval of images and video. Pattern Recognit.2002 April, 35(4), pp. 945–965.
[11] N. Jhanwar, S. Chaudhuri, G. Seetharaman, and B. Zavidovique. Content based image retrieval using motif co-occurrence matrix. Image Vis. Comput., 2004 December 22(14), pp. 1211–1220.
[12] H.W. Yoo, H.S. Park, and D.S. Jang. Expert system for color image retrieval. Expert Syst. Appl. 2005 February, 28(2), pp. 347–357.