198
International Journal of Pharmaceutical Sciences and Drug Research
2015; 7(2): 198-204
Research Article
CODEN (USA): IJPSPP
ISSN: 0975-248X
Development and Validation of Chemometric Assisted Spectrophotometric
Technique for Simultaneous Estimation of Cinitapride and Pantoprazole
from Bulk and Combined Dosage Form
Jasmine Karanjia
*Ramanbhai Patel College of Pharmacy, Charotar University of Science and Technology, Charusat Campus, Changa, Gujarat- 388421, India
ABSTRACT
This paper describes two sensitive, accurate and precise chemometric spectrophotometric methods for the simultaneous determination of Cinitapride hydrogen tartarate (CNT) and Pantoprazole sodium (PANTO) in bulk powder and capsules without prior separation. Multivariate calibration chemometric methods are proposed for simultaneous determination of CNT and PANTO. The chemometric methods applied are Principal Component Regression (PCR) and Partial Least Squares (PLS). These approaches are successfully applied to quantify both drugs using the information included in the absorption spectra of appropriate solutions. In these multivariate methods, calibration sets of standard samples composed of different mixtures of CNT and PANTO have been designed. The methods were validated according to The International Conference on Harmonization (ICH) guidelines. The specificity of the proposed methods was tested using laboratory-prepared mixtures. The developed methods were successfully applied for the determination of CNT and PANTO in bulk powder and dosage form combination.
Keywords: Chemometric, Cinitapride hydrogen tartarate, Pantoprazole sodium, Principal Component Regression (PCR), Partial Least Square (PLS).
INTRODUCTION
Cinitapride hydrogen tartarate is chemically designated as 4-amino-N-[1-(3-cyclohexen-1-ylmethyl)-4 piperidinyl]-2-ethoxy-5-nitrobenzamide hydrogen L-(+)-tartarate [1] (Fig. 1 a). It is a new prokinetic agent. It
is a substituted benzamide with 5-HT receptor antagonist and 5-HT- receptor agonist activity. Several procedures are reported for quantitative determination of CNT including UV spectrophotometry [2], Extractive
*Corresponding author: Ms. Jasmine Karanjia,
Ramanbhai Patel College of Pharmacy, Charotar University of Science and Technology, Charusat Campus, Changa, Gujarat- 388421, India; Tel.: +91-9825069733; E-mail: [email protected]
Received: 25 January, 2015; Accepted: 21 March, 2015
spectrophotometry [3], Colorimetric method [4], HPLC [5], HPTLC [6], and also from human plasma. [7]
O H N N+
O O
-O N
H2N
4-amino-N-[1-(3-cyclohexen-1-ylmethyl)-4 piperidinyl]-2-ethoxy-5-nitrobenzamide
a)
N H N
S
O N
O O
O F
F
6-(difluoromethoxy)-2-{[(3,4-dimethoxypyridin-2-yl)methane]sulfinyl}-1H-1,3-benzodiazole
b)
Pantoprazole sodium is chemically designated as 6-
(difluoromethoxy)-2-{[(3,4-dimethoxypyridin-2-yl)methane]sulfinyl}-1H-1,3-benzodiazole [8] (Fig. 1 b).
It is a proton pump inhibitor. It is a substituted benzimidazole indicated for the short term treatment in the healing and symptomatic relief of erosive oesophagitis. It is official in Indian pharmacopoeia and European Pharmacopoeia. Official methods of analysis include chromatographic method. [8-9] Other reported
methods include UV spectrophotometric methods [10-12],
RP-HPLC methods [13-15], HPTLC method [16],
Colorimetric method [17], Titrimetric and
spectrophotometric method [18], and stability indicating
HPLC method. [19]
Under controlled instrumentation computer- multivariate calibration methods are playing a very important role in the multi- component analysis of mixtures by UV–VIS spectrophotometry. [20-24] These
approaches are useful for the resolution of band overlapping in quantitative analysis. Multivariate calibration has been found to be the method of choice for complex mixtures. [24-26] In order to avoid
time-consuming procedures, attempts to resolve overlapping spectra by using various chemometric methods have been done. Multivariate statistical analysis methods presume that there is a linear relationship between absorbance and component concentrations. Each method has a calibration step in which the relationship between the spectra and the component concentrations is elucidated from a set of reference samples (calibration set). This step is followed by a prediction step in which the results of the calibration are used to calculate the component concentrations from an “unknown” sample spectrum (Validation set). [23]
Reviewing the literature in hand, there are no reported chemometric determination methods for this combination. The multivariate calibration methods investigated in this manuscript include the two most common methods. These are principal component regression (PCR) and partial least squares (PLS). In this work, multivariate calibration methods were applied to the determination of CNT and PANTO. The proposed procedures were successfully applied for determination of CNT and PANTO in bulk powder and in its pharmaceutical dosage form (capsules).
MATERIALS AND METHODS Instrumentation
Spectrophotometric analysis was carried out on a Shimadzu 1800 double beam spectrophotometer with a fixed slit width (2 nm) using a pair of 1 cm matched quartz cells. The spectrophotometer is connected to an IBM PC. The bundle software, UV-Probe spectroscopy software version 2.42 (Shimadzu, Kyoto, Japan), was used to process absorption.
Software
Microsoft Excel 2010 was used for handling and storing absorbance data. The computations were made using The Unscrambler X Version 10.3 (64 bit).
Materials Pure samples
Pure drug samples of CNT and PANTO were kindly supplied by RPCP Drug Bank, Charusat Campus, Changa, India.
Pharmaceutical dosage form
CINTODAC capsules (Cadila Healthcare Ltd), labeled to contain 3 mg Cinitapride hydrogen tartarate and 40 mg Pantoprazole sodium per capsule were purchased from local pharmacies.
Solvent
Methanol (AR grade, Loba Chemie, India).
Stock and working standard drug solutions Standard stock solutions
CNT and PANTO standard stock solutions (both are 1 mg ml-1), prepared by dissolving 100 mg of CNT and PANTO, each, in a few milliliters of methanol in to two 100 ml volumetric flasks and then completing to the mark with the same solvent.
Working standard solutions
From the stock solution of CNT 10 ml of solution was transferred to a 100 ml volumetric flask and the volume made up to 100 ml with methanol to give a working standard solution of 100µg/ml CNT.
From the stock solution of PANTO 10 ml of solution was transferred to a 100 ml volumetric flask and the volume made up to 100 ml with methanol to give a working standard solution of 100µg/ml PANTO.
Procedure
Spectral characteristics and wavelengths selection
The absorption spectra of 3µg/ml of CNT, 40µg/ml of PANTO and a mixture of both containing the same previous concentration of each drug over the wavelength range of 200–400 nm were recorded.
Preparation of Calibration set
Multilevel multifactor design was used for the construction of 41 binary mixtures. A five level two-factor design was used. [27] A calibration set of standard
mixture solutions containing 1-5µg/ml CNT and 13-65µg/ml PANTO was made from a standard stock solution of 100µg/ml. A calibration set of 25 synthetic mixtures was prepared and made up to the mark with methanol.
Preparation of Validation set
A validation set of standard mixture solutions containing 1-5µg/ml CNT and 13-65µg/ml PANTO was made from a standard stock solution of 100µg/ml. A validation set of 16 synthetic mixtures was selected on random basis from calibration set and these selected mixtures data has not been utilized for preparation of model.
Int. J. Pharm. Sci. Drug Res. March-April, 2015, Vol 7, Issue 2 (198-204)
external validation set. Concentrations of the two compounds in both calibration and validation sets are presented in Table (1 a & b).The absorbance of these mixtures were measured between 210 and 330 nm at 10 nm intervals against methanol as blank.
Preparation of sample solution for assay
Twenty capsules were accurately weighed and the contents collected by opening the caps. Capsule powder equivalent to 100 mg of Pantoprazole sodium was accurately weighed and transferred to 100 ml volumetric flask and 50 ml methanol was added. The mixture was sonicated for 20 mins and diluted up to the mark with methanol (Solution A), and filtered through Whatman filter paper 41. From this Solution A, 10 ml aliquot was withdrawn into 100 ml volumetric flask and diluted up to mark with methanol (Solution B). From Solution B, 3.9 ml aliquot was withdrawn into 10 ml volumetric flask and diluted up to mark with methanol Solution C (having concentration 39 µg/ml of Pantoprazole sodium and 3µg/ml of Cinitapride hydrogen tartarate.
Constructing the models
For the two techniques, the absorbance data matrix for the training set concentration matrix (Table 1) was obtained by the measurement of absorbances between 210.0 and 330.0 nm in the intervals of 10 nm. In these techniques, calibration or regression was obtained by using the absorbance data matrix and concentration data matrix for prediction of the unknown concentrations of CNT and PANTO in their binary mixtures and pharmaceutical formulation. For the PCR and PLS models, the training set absorbance and concentration matrices together with The Unscrambler X 10.3 (64 bit) software were used for calculations.
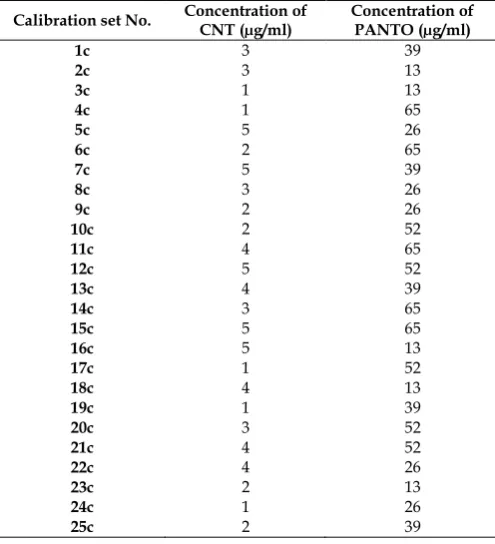
Table 1 A): Concentrations of CNT and PANTO in calibration set Calibration set No. Concentration of
CNT (µg/ml)
Concentration of PANTO (µg/ml)
1c 3 39
2c 3 13
3c 1 13
4c 1 65
5c 5 26
6c 2 65
7c 5 39
8c 3 26
9c 2 26
10c 2 52
11c 4 65
12c 5 52
13c 4 39
14c 3 65
15c 5 65
16c 5 13
17c 1 52
18c 4 13
19c 1 39
20c 3 52
21c 4 52
22c 4 26
23c 2 13
24c 1 26
25c 2 39
Table 1 B): Concentrations of CNT and PANTO in validation set Validation set No. Concentration of CNT (µg/ml) Concentration of PANTO (µg/ml)
1v 1 13
2v 1 26
3v 2 26
4v 2 65
5v 5 26
6v 2 13
7v 1 52
8v 4 52
9v 4 26
10v 2 52
11v 4 13
12v 1 65
13v 5 65
14v 5 52
15v 4 65
16v 5 13
Selection of the optimum number of latent variables to build the PCR and PLS models
The cross validation method was used, leaving out one sample at a time, to select the optimum number of latent variables (LVs). Given a set of twenty five calibration samples, PCR and PLS calibrations were performed, and using this calibration, the concentration of the sample left out was predicted. The predicted concentrations were then compared with the actual concentrations and the root mean square error of cross validation (RMSECV) was calculated. The maximum number of LVs used to calculate the optimum RMSECV was selected to be ten. The RMSECV indicates both the precision and accuracy of predictions. It was recalculated upon addition of each new LV to the PLS and PCR models.
RESULTS AND DISCUSSIONS
Multivariate calibration is useful for spectral analysis because the simultaneous inclusion of many spectral wavelengths instead of single wavelength greatly improves the precision and predictive ability. [28] The
full-spectrum methods have the ability to achieve improved precision since there is a signal averaging effect when many or all the spectral intensities are included in the analysis making it less susceptible to noise in the spectra.
Haaland and Thomas [24] made a comparison of the
different multivariate calibration methods for quantitative spectral analysis. They concluded that it is difficult to generalize about the superiority of one method over another, because the relative performance of the methods is often dependent on particular data set being analyzed. CLS method requires that all components in the calibration samples must be known regarding number of constituents and concentration of every constituent. For PCR and PLS methods, unlike CLS all overlapping spectral components do not have to be known.
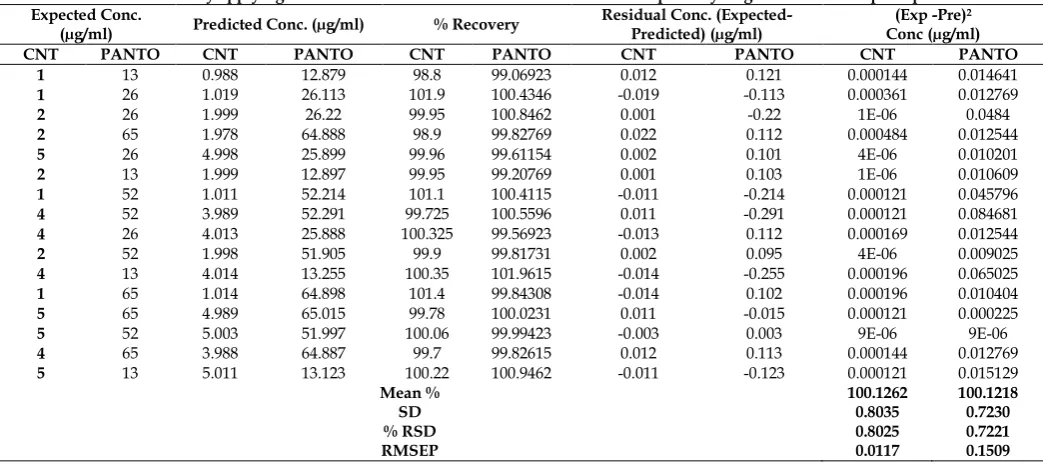
Table 2: Results obtained by applying PCR calibration methods to validation set of Cinitapride hydrogen tartarate and pantoprazole sodium Expected Conc.
(µg/ml) Predicted Conc. (µg/ml) % Recovery Residual Conc. (Expected-Predicted) (µg/ml) (Exp -Pre)2 Conc (µg/ml)
CNT PANTO CNT PANTO CNT PANTO CNT PANTO CNT PANTO
1 13 0.998 12.987 99.80 99.90 0.002 0.013 4E-06 0.00016
1 26 1.02 26.123 102.00 100.47 -0.02 -0.123 0.0004 0.01512
2 26 1.989 26.019 99.45 100.07 0.011 -0.019 0.00012 0.00036
2 65 1.988 64.898 99.40 99.84 0.012 0.102 0.00014 0.01040
5 26 4.988 25.894 99.76 99.59 0.012 0.106 0.00014 0.01123
2 13 1.997 12.991 99.85 99.93 0.003 0.009 9E-06 8.1E-05
1 52 1.001 52.003 100.10 100.00 -0.001 -0.003 1E-06 9E-06
4 52 3.999 52.09 99.97 100.17 0.001 -0.09 1E-06 0.0081
4 26 4.01 25.99 100.25 99.96 -0.01 0.01 1E-04 0.0001
2 52 1.988 51.995 99.40 99.99 0.012 0.005 0.00014 2.5E-05
4 13 4.012 13.012 100.30 100.09 -0.012 -0.012 0.00014 0.00014
1 65 1.004 64.889 100.40 99.82 -0.004 0.111 0.00001 0.01232
5 65 4.979 65.014 99.58 100.02 0.021 -0.014 0.00044 0.00019
5 52 5.017 51.967 100.34 99.93 -0.017 0.033 0.00028 0.00108
4 65 3.987 64.989 99.67 99.98 0.013 0.011 0.00016 0.00012
5 13 5.002 13.002 100.04 100.01 -0.002 -0.002 4E-06 4E-06
Mean % 100.020 99.988
SD 0.6249 0.1838
% RSD 0.6248 0.1838
RMSEP 0.0115 0.0609
Table 3: Results obtained by applying PLS calibration methods to validation set of Cinitapride hydrogen tartarate and pantoprazole sodium Expected Conc.
(µg/ml) Predicted Conc. (µg/ml) % Recovery
Residual Conc. (Expected-Predicted) (µg/ml)
(Exp -Pre)2
Conc (µg/ml)
CNT PANTO CNT PANTO CNT PANTO CNT PANTO CNT PANTO
1 13 0.988 12.879 98.8 99.06923 0.012 0.121 0.000144 0.014641
1 26 1.019 26.113 101.9 100.4346 -0.019 -0.113 0.000361 0.012769
2 26 1.999 26.22 99.95 100.8462 0.001 -0.22 1E-06 0.0484
2 65 1.978 64.888 98.9 99.82769 0.022 0.112 0.000484 0.012544
5 26 4.998 25.899 99.96 99.61154 0.002 0.101 4E-06 0.010201
2 13 1.999 12.897 99.95 99.20769 0.001 0.103 1E-06 0.010609
1 52 1.011 52.214 101.1 100.4115 -0.011 -0.214 0.000121 0.045796
4 52 3.989 52.291 99.725 100.5596 0.011 -0.291 0.000121 0.084681
4 26 4.013 25.888 100.325 99.56923 -0.013 0.112 0.000169 0.012544
2 52 1.998 51.905 99.9 99.81731 0.002 0.095 4E-06 0.009025
4 13 4.014 13.255 100.35 101.9615 -0.014 -0.255 0.000196 0.065025
1 65 1.014 64.898 101.4 99.84308 -0.014 0.102 0.000196 0.010404
5 65 4.989 65.015 99.78 100.0231 0.011 -0.015 0.000121 0.000225
5 52 5.003 51.997 100.06 99.99423 -0.003 0.003 9E-06 9E-06
4 65 3.988 64.887 99.7 99.82615 0.012 0.113 0.000144 0.012769
5 13 5.011 13.123 100.22 100.9462 -0.011 -0.123 0.000121 0.015129
Mean % 100.1262 100.1218
SD 0.8035 0.7230
% RSD 0.8025 0.7221
RMSEP 0.0117 0.1509
Selection of the optimum number of latent variables for PCR and PLS methods
Selection of the optimum number of LVs for the PCR and PLS techniques was a very important step before constructing the models. If the number of LVs retained was more than the required, more noise will be added to the data. On the other hand, if the number retained was less than the required, meaningful data that could be necessary for the calibration might be ignored. To select the optimum number of LVs for PCR and PLS methods, a cross- validation method using leave one out, was used. [29-30] Given the set of 25
calibration spectra corresponding to the samples listed in Table 1 a), the PCR and PLS models were constructed using 24 calibration spectra samples. The concentration of the sample left-out during calibration was predicted. This process was repeated 25 times until each calibration sample had been left-out once.
The predicted concentration of the compound in each sample was compared with the actual known concentration of the drug. The RMSECV was calculated in the same manner each time. The method described by Haaland and Thomas [23] was used for selecting the
optimum number of LVs. The method used an F-test to compare RMSECV values from cross-validation. The procedure starts by finding the smallest RMSECV value, RMSECV (k*) then all the models with fewer LVs (k < k*) are compared with the model with k*LVs.
F (k) = RMSECV (h)/RMSECV (k*) Where, k = 1, 2, 3, 4,……….k*
Int. J. Pharm. Sci. Drug Res. March-April, 2015, Vol 7, Issue 2 (198-204)
becomes smaller. [31] The maximum number of LVs
used to calculate the optimum RMSECV was selected as ten. Seven LVs was found suitable for PCR and PLS respectively, as in Figures 2 and 3. The results predicted by the multivariate methods for the training set model are summarized in Table 2 and 3.
Fig. 2: RMSEC plot of the cross validation results of the calibration set as a function of the number of latent variables used to construct the PCR calibration.
Fig. 3: RMSEC plot of the cross validation results of the calibration set as a function of the number of latent variables used to construct the PLS calibration.
Selection of the optimum number of wavelengths for model building and sample recovery for CLS, PCR and PLS methods
The absorption spectra of training and validation sets for CPM and ETF mixtures were recorded over the wavelength range of 200–400 nm at an interval of 0.1, 0.5, 1, 2, 5, 7 and 10 nm. But from these satisfactory results were obtained in the range 210-330 nm with 10 nm interval.
Comparison of the results from the proposed methods
The results confirm the considerable degree of agreement between the three techniques and indicate that these methods are suitable for this analysis in the given calibration domain for each drug if compared with the official methods. The evaluation of the predictive abilities of the models was performed by plotting the actual known concentrations against the predicted concentrations. The results are obtained in Table 4.
Fig. 4: PCR- Expected v/s Residual conc. of Cinitapride hydrogen tartarate
Fig. 5: PCR- Expected v/s Residual conc. of Pantoprazole sodium
Fig. 6: PLS- Expected v/s Residual conc. of Cinitapride hydrogen tartarate
Another diagnostic test was carried out by plotting the concentration residuals against the predicted concentrations. The residuals appear randomly distributed around zero, indicating adequate models as shown in Figures 4-7. The RMSECV was used as a diagnostic test for examining the error in the predicted concentrations. RMSECV indicates both the precision and accuracy of predictions. RMSECV plays the same role of standard deviation in indicating the spread of the concentration errors. In Table 4, the RMSECV, slope and intercept of predicted Vs. true concentrations are obtained. As can be seen, the results are satisfactory and indicate good predictive abilities of the developed models. The chemometric methods were applied successfully to the analysis of CNT and PANTO in CINTODAC capsules. The interfering species were not included in calibration samples but were present during capsule determination.
Table 4: RMSECV and statistical parameter values for Cinitapride hydrogen tartarate and Pantoprazole sodium prediction using multivariate calibration methods
Parameter CNT PANTO
PCR PLS PCR PLS
Range
Wavelength (nm) 1 - 5 µg/ml 210 – 330 13 – 65 µg/ml 210 - 330
∆ λ (nm) 10 10
Factor 7 7 7 7
% recovery 100.020 100.126 99.988 101.121
SD 0.624 0.803 0.183 0.723
% RSD 0.062 0.802 0.183 0.722
Correlation
Coefficient (r2) 0.9999 0.9996 0.9998 0.9999
Intercept 0.0008 0.007 -0.105 -0.064
Slope 0.9993 0.9996 0.9993 1.0007
RMSECV 0.0554 0.0277 0.2958 0.0392
RMSEP 0.0115 0.0117 0.0609 1.1509
Method Validation
Validation of the proposed methods was assessed according to ICH guidelines. [32-33]
Accuracy
The accuracy of the proposed methods was performed by applying the suggested procedures for
determination of the validation samples as well as different blind samples of CNT and PANTO. The concentrations were obtained from the corresponding model, from which the percentage recoveries suggested good accuracy of the proposed methods. Results are shown in Table 5 and 6.
Table 5: Accuracy data of Cinitapride hydrogen tartarate by PCR and PLS methods
Level
Amoun t taken (µg/ml)
Amount
found (µg/ml) % Mean ± SD % RSD
PCR PLS PCR PLS PCR PLS
80 2.4 2.401 2.399 2.397
2.398 2.403 2.402
2.399±
0.002 2.401± 0.002 0.083 0.110
100 3 3.003 3.010
2.998 2.998 3.001 2.989
3.003±
0.006 2.996± 0.006 0.200 0.208
120 3.6 3.599 3.602 3.604
3.603 3.597 3.598
3.601±
0.002 3.599± 0.003 0.069 0.089
Table 6: Accuracy data of Pantoprazole sodium by PCR and PLS methods
Level
Amount taken (µg/ml)
Amount found
(µg/ml) % Mean ± SD % RSD
PCR PLS PCR PLS PCR PLS
80 31.2 31.199 31.201 31.204
31.197 31.199 31.201
31.201 ± 0.002
31.199±
0.002 0.008 0.006
100 39 39.003 38.997 38.989
38.995 39.012 39.001
38.996 ± 0.007
39.002±
0.008 0.018 0.022
120 46.8 46.798 46.802 46.800
46.804 46.799 46.801
46.803 ± 0.006
46.801±
0.002 0.013 0.005
Application of the method in assay of capsules
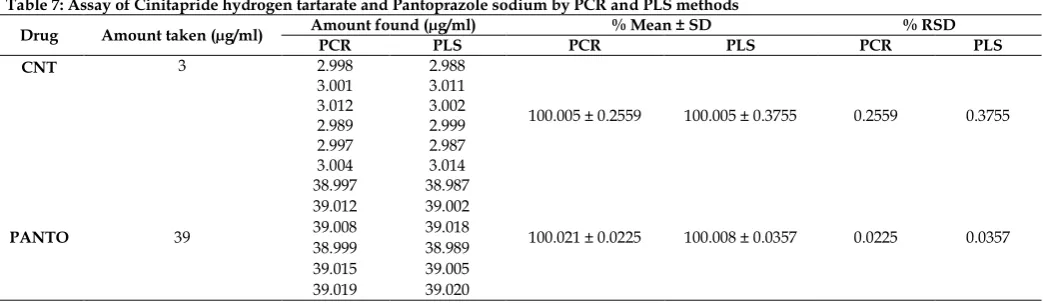
The proposed spectrophotometric multivariate calibration methods were applied for the determination of CNT and PANTO in their combined pharmaceutical formulation (CINTODAC Capsules) as shown in table 7. It shows that the developed methods are accurate and specific for determination of the cited drugs in presence of dosage form excipients.
Table 7: Assay of Cinitapride hydrogen tartarate and Pantoprazole sodium by PCR and PLS methods
Drug Amount taken (µg/ml) Amount found (µg/ml) PCR PLS PCR % Mean ± SD PLS PCR % RSD PLS
CNT 3 2.998 2.988
100.005 ± 0.2559 100.005 ± 0.3755 0.2559 0.3755
3.001 3.011
3.012 3.002
2.989 2.999
2.997 2.987
3.004 3.014
PANTO 39
38.997 38.987
100.021 ± 0.0225 100.008 ± 0.0357 0.0225 0.0357
39.012 39.002
39.008 39.018
38.999 38.989
39.015 39.005
39.019 39.020
In this manuscript, two chemometric techniques have been investigated to determine which technique is the most suitable for the simultaneous determination of CNT and PANTO without the use of preliminary separation step. The good recoveries obtained in all
Int. J. Pharm. Sci. Drug Res. March-April, 2015, Vol 7, Issue 2 (198-204)
dosage forms with satisfactory precision. The proposed methods are simple, sensitive, accurate, precise and economical. They could be easily applied in quality control laboratories for the routine analysis of the studied drugs in pure bulk powder and dosage form without any preliminary separation step. The most striking features of the methods are their simplicity and rapidity. Method validation has been demonstrated by accuracy, % recovery and assay of marketed formulation.
ACKNOWLEDGEMENTS
The author would like to thank Ramanbhai Patel College of Pharmacy for providing the drug samples as well as the infrastructure and facilities to complete the research work and All India Council for Technical Education (AICTE) for providing funds to complete my research work.
REFERENCES
1. O’Neil. The Merck Index: An Encyclopedia of Chemicals, Drugs and Biologicals. New Jersey, Merck Research Laboratories, Division of Merck and Co, Whitehouse Station, 2006.
2. Thangabalan B, Prabhakar AE, Kalaichelvi R, Vijayraj P,
Reddy KC. UV Spectrophotometric Method for
Determination of Cinitapride in Pure and its Solid Dosage Form. E- J of Chem. 2009; 6: 21-24.
3. Thangabalan B, Prabhakar AE, Vijayraj P. Validated Extractive Spectrophotometric Estimation of Cinitapride in Pure and Solid Dosage Form. Int J of Pharm and Pharm Science. 2010; 2: 153-155.
4. Homaira S, Dey A, Raju A, Sanaullah S. Applications of Colorimetric Methods for the Determination of Cinitapride Hydrogen Tartarate in Drug Formulations. Int J of Pharm and Pharm Science. 2010; 2: 134-136.
5. Roy SMN, Mangaonkar KV, Desai AY, Yetal SM. RP-HPLC Method for the Determination of Cinitapride in The Presence of its Degradation Products in Bulk Drugs. E- J of Chem. 2010; 7: 311-319.
6. Kumarand M, Shrinivasan BP. Stability Indicating HPTLC Method for Determination of Cinitapride Hydrogen Tartarate in Bulk and Pharmaceutical Formulation. IPC Abstract. 2009; 530 section 41.
7. Roy SMN, Yetal SHM, Chavan SV, Pradhan VR, Joshi SS. Determination of Free Levels of Cinitapride in Human
Plasma by Liquid Chromatography Tandem-Mass
Spectrometry. E- J of Chem. 2008; 5: 3453-3460.
8. Commission, Indian Pharmacopoeia, Ministry of Health and Family Welfare. Ghaziabad. 2010; 3:1856-1857.
9. European Directorate for the Quality of Medicines and Healthcare, European Pharmacopoeia. 2: 2664-2665.
10. Kumar R, Singh H, Singh P. Development of UV
Spectrophotometric Method for Estimation of Pantoprazole in Pharmaceutical Dosage Form. J of Chem and Pharm Res. 2011; 3(2): 113-117.
11. Pandya J, Solanki S, Patel M. Development and Validation of Differential Spectrophotometric Method for Determination of Pantoprazole in Tablet Dosage Form. J of Pharm Science and Bio-Scientific Res. 2012; 2(1): 2-4.
12. Okram Z, Basavaiah K. Validated Spectrophotometric Determination of Pantoprazole Sodium in Pharmaceuticals Using Ferric Chloride and Two Chelating Agents. Int J of Chem Res. 2010; 2(1): 624-632.
13. Rao K, Keshar N, Choudhary P, Pattnaik A. RP-HPLC Method for Estimation of Pantoprazole Sodium. Int Med and Bio Science. 2012; 1(1): 1-5.
14. Mohankandhasamy R, Dharuman J, Thiagarajan M. High
Performance Liquid Chromatography Method for
Quantification of Pantoprazole in Rat Plasma. Int J of Chemtech Res. 2010; 2(2): 585-594.
15. Birajdarl A, Meyenathan S, Suresh B. Determination of Mosapride and Pantoprazole in Fixed Dose Combination by UV Spectrophotometric Method and RP-HPLC. Int J of Pharm Stud and Res. 2011; 2(2): 29-36.
16. Patel S. High Performance Thin Layer Liquid
Chromatography Estimation for Pantoprazole in Injection. Int Res J of Pharm. 2011; 2(3): 132-133.
17. Kalaichelvi R, Fatima Rose M, Vadivel K, Jayachandran E.
Simple Extractive Colorimetric Determination of
Pantoprazole Sodium by Acid Dye Complexation Method in Solid Dosage Form. Int J of Chem Res. 2010; 1(1): 6-8. 18. Basavaiah K, Tharpa K, Rajendraprasad N. Titrimetric and
Spectrophotometric Assay of Pantoprazole in
Pharmaceuticals Using Permanganate. J of the Mexican Society. 2009; 53(1): 34-40.
19. Vaithiyanathan S, Rajappan M, Valliappan K. Stability Indicating RP-HPLC Method for the Simultaneous Determination of Pantoprazole, Rabeprazole, Lansoprazole and Domeperidone from Their Combined Dosage Forms. Int J of Drug Develop and Res. 2011; 3(4): 323-335.
20. Badawy AM, Mostafa NM, Abd elaleem AB, Lamie NT. Stability Indicating PLS and PCR Chemometric Methods for the Determination of Rosuastatin in Presence of its Two Degradation Products. Int J of Pharm and Pharm Sci.2011; 3(3): 232-237.
21. Espinosa MA, Munoz de la Pena A, Salinas F, Martinez Galera M. Simultaneous Determination of 2-Furfuraldehyde and 5-Hydroxymethylfurfuraldehyde and Malonaldehyde in Mixtures by Derivative Spectrophotometry and Partial Least Squares Analysis. Anal Chim Acta. 1993; 276(1): 141-149. 22. Geladi P, Kowalski BR. Partial Least Squares Regression: A
Tutorial. Anal Chim Acta. 1986; 185: 1-17.
23. Haaland DM, Thomas EV. Partial Least Squares Methods for Spectral Analysis: Relation to Other Quantitative Calibration Methods and the Extraction of Qualitative Information. Anal Chem. 1988; 60: 1193-202.
24. Haaland DM, Thomas EV. Comparison of Multivariate Calibration Methods for Quantitative Spectral Analysis. Anal Chem. 1990; 62: 1091-1099.
25. Ibrahim N, Rizk M, Ibrahim A, Tawakkol S, Ali S. Simultaneous Determination of Amlodipine Besylate and Atorvastatin Calcium by Using Chemometric Method with Multivariate Calibration and HPLC Method With Design of Experiment. Int J of Pharm and Pharm Sci. 2014; 6(1): 419-425.
26. Meras ID, Pena AMdl, Mansilla AE, Salinas F.
Multicomponent Determination of Flavour Enhancers in Food Preparations By Partial Least Squares and Principal Component Regression Modelling of Spectrophotometric Data. The Analyst. 1993; 118(7): 807-813.
27. Brereton RG, Multilevel Multifactor Designs for Multivariate Calibration. The Analyst. 1997; 122: 1521-1529.
28. Ni YG, G X. Simultaneous Spectrophotometric Determination of Mixtures of Food Colorants. Anal Chim Acta. 1997; 354: 163-171.
29. O'Haver TC, Green GL. Numerical Error Analysis of Derivative Spectrometry for the Quantitative Analysis of Mixtures. Anal Chem. 1976; 48: 312-318.
30. O'Haver TC, Green GL. Derivative and Wavelength Modulation Spectrometry. Anal Chem.1979; 51: 91 A-100 A. 31. Kramer R, Chemometric Techniques for Quantitative
Analysis. New York, Marcel Dekker Inc. 1998.
32. ICH, Q2 (R1), In proceedings of the International Conference on Harmonisation, Validation of Analytical Procedure: Text and Methodology. Geneva.2005.
33. Danzer K, Otto M, Currie LA. Guidelines for Calibration in Analytical Chemistry Part 2: Multicomponent Calibration (IUPAC Technical Report). 2004; 76(6): 1215-1225.