Abstract— TiO2 nanoparticles were synthesized by the P-25 powder modified sol-gel method under different TTIP (Titanium tetraisopropoxide) concentrations, P-25 loading and the gelation pHs. Based on XRD analysis SEM results and BET technique, the crystalline compositio, the level of crystallinity, the particle size and the surface area of the as-prepared samples were found to be affected by these parameters. Response surface methodology based on central composite design was used to optimize these synthesis parameters in photodegradation of Acid Red 73. The degradation efficiency was significantly affected by P-25 loading, pH value of gelation and the interaction effect between TTIP concentration and P-25 loading. The optimal values of parameters were found to be a pH of 1.34, a TTIP concentration of 0.25 M and a P-25 loading of 39.76 g/L. Regression analysis with an R2value of 0.9549
showed a good agreement between the experimental results and the predicted value.
Index Terms—Modified sol-gel method, Response surface methodology, structural properties, titanium dioxide nanopowders.
I. INTRODUCTION
The most recently completed assessment, published in 2013 by the World Health Organization (WHO) has reported that 768 million people around the world lacked access to “improved water supply”[1]. These figures are expected to increase in the future due to overwhelming discharge of contaminants into the natural water cycle. To slow the growth of the clean water shortage, the development of low-cost and effective technologies for wastewater treatment is needed. In recent decades, a great deal of interest has been devoted to photocatalytic degradation of organic water pollutants utilizing TiO2 as photocatalyst [2], [ 3]. It is mainly due to the
high potential of TiO2 in mineralization of a wide range of
organic pollutants at ambient temperature and pressure into CO2 and water. However, so far, little progress has been
made in the development of a photocatalytic technology for water treatment in large applications. The presence of a number of system factors that require rapid coverage testing is one of the technical obstacles to scaling up photocatalytic technology processes [4]. The traditional one-factor-at-a-time (OFAT) approach, as the most common method for optimization, is time-consuming and expensive
Manuscript received July 31, 2013; revised September 11, 2013. Optimization of Synthesis Parameters in Photodegradation of Acid Red 73 using TiO2 Nanoparticles Prepared by the Modified Sol-gel Method.
Somayeh Alijani, Mohammad Vaez, and Abdolsamad Zarringhalam Moghaddam are with Chemical Engineering Department, Tarbiat Modares University, Tehran, Iran (email: [email protected], [email protected], [email protected]).
due to reagent costs [5]. Moreover, this univariate approach does not show the interactions between the independent variable [4]. Therefore, there is currently an effort to replace this inefficient practice with effective chemometric methods [5]. The response surface methodology (RSM), as an efficient chemometric technique, has been successfully applied for various processes to achieve optimization using experimental designs, including TiO2 /UV oxidation [6], [7].
However, there have been no reports of research on the optimization of synthesis parameters and their interactions using experimental design methodology during the synthesis of TiO2 via the modified sol-gel method for degradation of
Acid Red 73. TiO2 nanoparticles as photocatalyst have been
usually synthesized by the well-known sol-gel method [8]. Some investigators have reported that modification of the sol-gel method by incorporation of P-25 into the sol can improve the structural properties of the TiO2 nanocatalyst
and its photocatalytic efficiency [9], [10]. In the present study, TiO2 nanoparticles were synthesized by the P-25 powder
modified sol-gel method (PPMSG) under different synthesis parameters and the interaction effect of these parameters on the photocatalytic degradation of Acid Red 73 was studied using central composite design (CCD) based on the response surface methodology (RSM) and the optimal values of these parameters were determined.
II. EXPERIMENTAL
A. Experimental Design and Optimization by Response Surface Methodology
In this study, the experimental conditions in the synthesis of nanosized TiO2 powders by P-25 powder-modified sol-gel
method were investigated and optimized in the photodegradation of Acid Red 73 using central composite design (CCD) at five levels. The Design Expert 7.0 software was used to analyze the experimental findings obtained under changing synthesis conditions. The concentration of titania precursor (TTIP concentration), P-25 loading and gelation pH were chosen as independent variables and he degradation percentage of Acid Red 73 was considered as the dependent variable (response). The ranges and levels of the studied variables are given in Table I. In according to Table I, TiO2
nanoparticles were synthesized through 20 experiments with different synthesis conditions.
B. Synthesis of TiO2 Nanoparticles
TiO2 nanocrystals were prepared by the P-25 modified
sol-gel method as follow: various volume of titanium isopropoxide (TTIP, Ti(O-i-C3H7)4, purity 98%, Merck) was
Somayeh Alijani, Mohammad Vaez, and Abdolsamd Zarringhalam Moghaddam
Optimization of Synthesis Parameters in
Photodegradation of Acid Red 73 Using TiO
2
dissolved in a 20 mL of anhydrous ethanol to provide solution with various TTIP concentrations (Table I). The solution was stirred at room temperature for 30 min. Then, a mixture of deionized water and dilute nitric acid was added dropwise to the above solution to adjust the pH solution to a desirable value (Table I). After stirring for 1 h, P-25 powder with a loading according with Table 1 was ultrasonically dispersed in the sol. The obtained white dispersion was then aged for 12 h followed by gelation at room temperature. The resultant gel was dried at 80 0C for 10 min and then calcinated
at 600 0C for 1 h with a heating and cooling rate of 1 0C/min. TABLEI:EXPERIMENTAL RANGE AND LEVELS OF THE INDEPENDENT TEST
VARIABLES
Variables Ranges and levels
-2 -1 0 1 2 TTIP concentration (M) (x1) 0.1 0.18 0.3 0.42 0.5
P-25 loading (g/L) (x2) 10 18.10 30 41.89 50
Gelation pH (x3) 1 1.2 1.5 1.8 2
C.Characterization
The XRD patterns of the prepared titania nanoparticles were obtained using PHILIPS PW1800 analyzer with a Cu Ka X-ray source. The main grain size (L) and the rutile content in samples were calculated by the formula as mentioned in our previous work [11]. The morphology of the powders was determined using Field Emission Scanning Electron Microscopy (FESEM, Hitachi S-4160). The Brunauer-Emmett-Teller (BET) method with a Micromeritics 2000 instrument (ASAP 2000, Micromeritics, USA) was used to measure the specific surface area of samples by nitrogen adsorption–desorption at 77 K.
D.Photocatalytic Activity Measurement
The photocatalytic activities of TiO2 powders (0.1 g/L)
prepared by PPMSG method were evaluated by the photodegradation of Acid Red 73 as the model compound. Experiments were carried out in a batch-mode rectangular reactor made of Pyrex glass with total volume of 1 L. The artificial irradiation was provided by four UV-A lamps (9W, Philips, 1.8 mW/ cm2), positioned parallel to each other in the
box. The scheme of the employed photocatalytic reactor has been presented in our previous work [12]. The dye solution was aerated using two air pumps with a 1 L/min flow rate. The reactor was cooled by a fan placed at the box. Before each experiment, the aqueous solution of acid dye was agitated with gentle air in the presence of TiO2 sample in the
darkness for at least 30 min to achieve the complete equilibrium of adsorption process. Photocatalytic degradation processes were performed at 298 K with 250 mL of solution and an initial Acid Red 73 concentration of 20 mg/L. Samples were taken out at regular time intervals, and an Optizen 3220UV Double Beam spectrophotometer was used to analysis the samples. Before the measurement of residual dye concentration, each sample was filtered (pore size < 0.22 μm) to remove any possible TiO2 particles present
in the solution. The maximum wavelength (λmax) of Acid Red
73 is 545 nm.
III. RESULTS AND DISCUSSION
A. Model Fitting and Analysis of Variance (ANOVA)
Depending upon the experimental design and the experimental results and the predicted responses, the relationship between the response and the studied variables was derived and expressed by the following empirical second-order polynomial equation in actual form:
% degradation = -170.00171+ 4.26293 ¯TTIP+ 4.28598¯ P25+ 150.95228¯ pH -0.04118 ¯TTIP¯
P25+0.79902¯ TTIP¯pH -0.32880¯ P25 ¯pH -0.14758
¯TTIP2 -0.041896¯ P252 - 55.24231¯ pH2
Based on the negative coefficients of quadratic terms xii2 in
the polynomial expression, an excess of TTIP concentration (x1), the P-25 loading (x2) and pH gelation (x3) in the system
produces a negative influence on the photocatalytic performance (decreased Acid Red 73 %degradation). The negative coefficient of x1x2 parameter in polynomial
expression indicates an antagonistic effect between these variables [5].
According to the ANOVA results (Table II), the model F-value of 45.75 implies the model is significant. There is only a 0.01% chance that the “model F value” could occur due to noise. The p value for the model, which is less than 0.0001, also indicates that the model is significant.
TABLEII:ANOVARESULTS FOR THE RESPONSE SURFACE QUADRATIC MODEL
Source Sum of squares Degree of freedom squares Mean valueF p value
Model 2190.23 9 243.36 45.75 <0.0001
Residual 53.19 10 5.32
Lack of
fit 38.47 5 7.69 2.61 0.1578
Pure
error 14.73 5 2.95
Total 2243.43 19
Std. Dev. 2.31
The "lack-of-fit F-value" of 2.61 implies that the lack of fit is not significant relative to the pure error. There is a 15.78% chance that the “Lack-of-Fit F-value” could occur due to noise. The non-significant lack-of-fit term indicates the ability of the model to predict the experimental results accurately. The good predictability of the model was also confirmed by the “Pred R-Squared” of 0.8566 which is in reasonable agreement with the “Adj R-Squared” of 0.9549.
The results obtained from the analysis of variance (ANOVA) at 95% confidence level are given in Table III.
According to the monomial coefficient values of the In according to the p-value of each factor, the P-25 loading (x2), pH gelation (x3) and the second-order effect of factors
(xii2) are highly significant parameters with p<0.001. The
interaction effect between the concentration of TTIP (x1) and
P-25 loading (x2) is significant at p< 0.05. Moreover, the
first-order effect of TTIP concentration (x1) and the
TABLEIII:COEFFICIENTS OF REGRESSION AND THEIR SIGNIFICANCES
Factor F-value 95% confidence
interval Low
95% confidence
interval High p-value
Interc ept
x1 x2 x3 x1 x2 x1 x3 x2 x3 x12 x2
2 x2
3
- 3.69 158.72
36.33 12.76 3.00 2.03 73.76 95.11 64.59
36.29 -2.59 6.47 -5.15 -4.73 -0.40 -2.98 -6.57 -7.28 -6.24
40.48 0.19 9.25 -2.37 -1.10 3.23 0.65 -3.86 -4.57 -3.53
- 0.0835
< 0.0001 0.0001 0.0051 0.1139 0.1844 < 0.0001
< 0.0001
< 0.0001
B. Response Surface Analysis
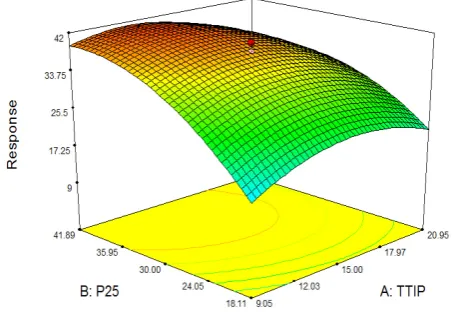
The three-dimensional plots display the model-predicted response graphically to provide a clearer view of the response surface and a better understanding of interactions between variables [12].
Fig. 1. Effects of TTIP concentration and P-25 loading on Acid Red 73 degradation (Gelation pH: 1.5)
Fig. 1 shows the simultaneous effect of TTIP concentration and P-25 loading on Acid Red 73 degradation. Degradation increases with an increase in TTIP from 0.1 to 0.28 M and decreases gradually when the TTIP concentration increases beyond 0.3 M. This behavior can be attributed to the rutile-anatase distribution in the crystalline framework, as shown in Table IV. Based on the XRD analysis, the rutile content in TiO2 catalysts increases with increasing TTIP
amount to a middle concentration and decreases as TTIP concentration goes over an optimal value.
Although the anatase phase of TiO2 has been reported to be
more active as a photocatalyst compared with the rutile, the synergistic effect between rutile and anatase can improve the photocatalytic performance of TiO2 [13].
However, the high loading of P-25 slows down the positive effect of TTIP concentration significantly and accelerates its negative effect on the photocatalytic performance. Incorporating P-25 loading into the sol favors the rutile formation in resulting crystal structure, as XRD results shown in Fig. 2.
Fig. 2.XRD patterns of TiO2 powders prepared with TTIP concentration: 0.3
M, pH: 1.5 and the sol containing no P-25 powder (a) 10 g/L P-25 powder (b) 30 g/L P-25 powder (c) and 50 g/L P-25 powder (d)
Although the presence of rutile in the crystalline structure improves the photocatalytic activity, the anatase/rutile proportion can be also an important parameter in evaluation of photocatalytic efficiency. The best result of photoactivity is observed for the sample possesses the crystalline composition of rutile and anatase close to that of commercial P-25 TiO2 (70/80:30/20) [14]. Generally, both P-25 loading
above 35 g/L and TTIP concentration more than 0.3 M decrease the decolorization of catalyst efficiency.
The effects of TTIP concentration and pH gelation on Acid Red 73 degradation efficiency are shown in Fig. 3. The effect of TTIP concentration on the color removal efficiency exhibited the similar trends.
Fig. 3. Effects of TTIP concentration and gelation pH on Acid Red 73 degradation (P-25 loading: 30 g/L)
At higher value of gelation pH, the increased rutile content regression model, p(x1) = 0.0835 (TTIP concentration), p(x2)
< 0.0001 (P-25 loading) and p(x3) = 0.0001 (pH gelation), the
order of importance among the factors is P-25 loading (x2) >
pH gelation (x3) > TTIP concentration (x1).
TABLE IV: PHYSICALPROPERTIES OFTiO2POWDERSOBTAINED FROM
MODIFIEDSOL-GEL METHOD AT DIFFERENTTTIP CONCENTRATION,
GELATION PH: 1.5AND P-25 LOADING: 30G/L
TTIP concentration (M)
Crystal size (nm)
Anatase content (%)
SBET
(m2/g)
0.1 35.75 95 21.36
0.3 42.29 75 22.58
and the decreased size of particles can slightly enhance the negative impact of TTIP concentration. The XRD analysis, presented in Fig. 4, show that increasing acidity in medium solution promotes the rutile formation. In addition, it was found that the width of the diffraction peaks of anatase become wider with increasing pH. The size of the crystallites calculated by Scherrer’s equation decreases with increasing pH from 56.71 nm at pH=1 to 31.66 nm at pH=2. As suggested by literature, bigger TiO2 particles are formed at
pHs away from the range of isoelectric point (5-6.8) [15].
Fig. 4. XRD patterns of TiO2 powders prepared by modified sol-gel method
at TTIP concentration: 0.3 M, P-25 loading: 30 g/L and pH: 1 (a) pH: 1.5 (b) and pH: 2 (c)
Therefore, at higher pH value, the negative impact of TTIP concentration is accelerated, since the powders with a small size of particles are usually associated with large amounts of crystalline defects, which favor the electron–hole recombination leading to a poor photoactivity [16].
However, it is also noted that small grain size can confer sufficiently active surface to adsorb organic molecules and promotes photocatalytic efficiency, as a result. The BET analysis of the samples prepared at different pH of gelation show the increase in the surface area from 17.31 m2/ g to
28.01 m2/ g as gelation pH increases from 1 to 2. Therefore,
as shown in Fig. 3, there is an optimum value for gelation pH
leading to an optimal value for particles size and consequently high level of crystallinity combined with good surface area which contributes to high efficiency of TiO2
catalysts.
Fig. 5 shows the effects of P-25 loading and gelation pH on decolorization. The influence of loading of P-25 on the degradation of Acid Red 73 is highly significant.
Fig. 5. Effects of P-25 loading and gelation pH on Acid Red 73 degradation (TTIP concentration: 0.3 M)
As the amount of P-25 powder incorporated into sol increases, the degradation percentage of acid dye increases drastically, whether gelation pH has a low or high value. This positive effect can be ascribed to the increased rutile content in the final crystal structure which confers more electron capture traps. However, at higher loading of P-25, a slight decrease in acid dye decolorization is observed. This negative impact can be explained by decreasing the grain size of samples at higher loading of P-25, as FESEM analysis shown.
Fig. 6 shows the morphology of powders prepared at 10, 30 and 50 g/L P-25 in sol.
Fig. 6. FESEM images of TiO2 powders prepared at TTIP concentration: 0.3 M, pH:1.5 and by the sol containing 10 g/L P-25 powder (a) 30 g/L P-25
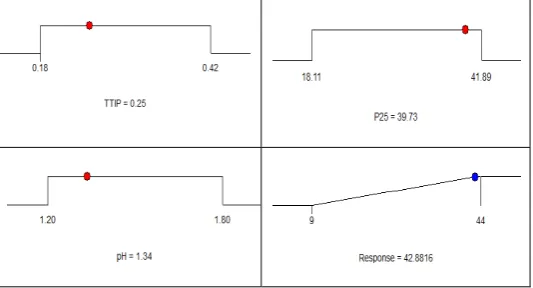
Fig. 7. Desirability ramp for numerical optimization
As it is obvious by comparing Figs. 6 (a), (b) and (c), the decrease in average of grain size is observed with increasing the loading of P-25 in the modified sol, as it is clear from Figs. 6 (a), (b) and (c). The average grain size of powders prepared at various loading of P-25 was measured by Measurement Software. It was found that the average size of grain for the samples obtained at 10, 30 and 50 g/L of P-25 in the modified sol was approximately 185, 141 and 123 nm, respectively. As suggested by literature, the P-25 particles may act as sites for nucleation of TiO2 nanoparticles derived from alkoxide sol
[10]. As P-25 loading increases, the number of crystallites formed from the alkoxide sol is not enough to form a large size grain and the grain size decreases as a result.
C.Optimization of the Synthesis Conditions
The optimal conditions for the degradation of Acid Red 73 were determined on the basis of the desirability function. The numerical optimization program was applied to find a set of conditions that maximizes this function. For such studies, the maximum degradation which is the main objective of optimization was considered by adjusting the ‘importance’ to 5 like the previous work [12] and the ‘importance’ of 3 was provided for the three independent variables. Based on these settings, the optimal synthesis conditions for maximum Acid Red 73 degradation efficiency (42.88%) were found as shown in Fig.7.
D.Model Validation and Confirmation
Verification experiments were carried out at the optimal synthesis conditions obtained from the experimental design proposed by CCD to confirm the adequacy of the model for predicting of the maximum percentage degradation of Acid Red 73. An average maximum degradation of 43.03% was derived from three replicative experiments performed by titania synthesized under optimal conditions. The good agreement between the predicted and the observed results verifies the validity of the model for simulating the photodegradation of Acid Red 73.
IV. CONCLUSION
TiO2 nanoparticles were prepared by the modified sol-gel
method under different synthesis parameters including TTIP concentration, P-25 loading and gelation pH. Structural properties of nanoparticles were characterized by XRD, FESEM and BET analysis. The experimental design methodology was used to optimize the selected parameters
for synthesize of TiO2 nanoparticles using the modified
sol-gel method for the degradation of Acid Red 73. Under the optimized conditions of a 0.25 M TTIP concentration, 39.76 g/L P-25 loading and a pH value of 1.34, the degradation efficiency of Acid Red 73 approached 42.88% after 1 h.
REFERENCES
[1] W. H. Organization and UNICeF, "Progress on sanitation and drinking-water-2013 update," Mrch 2013.
[2] D. F. M. Oliveira, P. S. Batista, P. S. Muller Jr, V. Velani, M. D. França, D. R. de Souza, and A. E. H. Machado, "Evaluating the effectiveness of photocatalysts based on titanium dioxide in the degradation of the dye Ponceau 4R," Dyes and Pigments, vol. 92, pp. 563-572, January2012. [3] R. J. Tayade, H. C. Bajaj, and R. V. Jasra, "Photocatalytic removal of organic contaminants from water exploiting tuned bandgap photocatalysts," Desalination, vol. 275, pp. 160-165, July2011. [4] M. N. Chong, B. Jin, C. W. K. Chow, and C. P. Saint, "A new approach
to optimise an annular slurry photoreactor system for the degradation of Congo Red: Statistical analysis and modelling," Chemical Engineering
Journal, vol. 152, pp. 158-166, October2009.
[5] V. A. Sakkas, M. A. Islam, C. Stalikas, and T. A. Albanis, "Photocatalytic degradation using design of experiments: A review and example of the Congo red degradation," Journal of Hazardous
Materials, vol. 175, pp. 33-44, March2010.
[6] D. Vildozo, C. Ferronato, M. Sleiman, and J. M. Chovelon, "Photocatalytic treatment of indoor air: Optimization of 2-propanol removal using a response surface methodology (RSM)," Applied
Catalysis B: Environmental., B, vol. 94, pp. 303-310, February2010.
[7] A. R. Khataee, M. Fathinia, S. Aber, and M. Zarei, "Optimization of photocatalytic treatment of dye solution on supported TiO2
nanoparticles by central composite design: Intermediates identification," Journal of Hazardous Materials, vol. 181, pp. 886-897, September2010.
[8] C.-J. Tseng, C.-H. Wang, and K.-W. Cheng, "Photoelectrochemical performance of gallium-doped AgInS2 photoelectrodes prepared by
electrodeposition process," Solar Energy Materials and Solar Cells,
vol. 96, pp. 33-42, January 2012.
[9] G. Balasubramanian, D. D. Dionysiou, M. T. Suidan, V. Subramanian, I. Baudin, and J. M. Laîné, "Titania powder modified sol-gel process for photocatalytic applications," Journal of Materials Science, vol. 38, pp. 823-831, February2003.
[10] Y. Chen and D. D. Dionysiou, "TiO2 photocatalytic films on stainless
steel: The role of Degussa P-25 in modified sol-gel methods," Applied
Catalysis B: Environmental, vol. 62, pp. 255-264, February2006.
[11] M. Vaez, A. Z. Moghaddam, N. M. Mahmoodi, and S. Alijani, "Decolorization and degradation of acid dye with immobilized titania nanoparticles," Process Safety and Environmental Protection, vol. 90, pp. 56-64, January 2012.
[12] M. Vaez, A. Zarringhalam Moghaddam, and S. Alijani, "Optimization and Modeling of Photocatalytic Degradation of Azo Dye Using a Response Surface Methodology (RSM) Based on the Central Composite Design with Immobilized Titania Nanoparticles," Industrial
& Engineering Chemistry Research, vol. 51, pp. 4199-4207, February
2012.
Journal of Environmental Management, vol. 92, pp. 311-330, March 2011.
[14] Y. Bessekhouad, D. Robert, and J. V. Weber, "Synthesis of photocatalytic TiO2 nanoparticles: optimization of the preparation
conditions," Journal of Photochemistry and Photobiology A:
Chemistry, vol. 157, pp. 47-53, April2003.
[15] C. Su, B.-Y. Hong, and C.-M. Tseng, "Sol–gel preparation and photocatalysis of titanium dioxide," Catalysis Today, vol. 96, pp. 119-126, October2004.
[16] O. Carp, C. Huisman, and A. Reller, "Photoinduced reactivity of titanium dioxide," Progress in Solid State Chemistry, vol. 32, pp. 33-177, October2004.
M. Vaez was born on September 1985 in Khomeyn,
Iran. He has gotten his B.Sc. degree in chemical engineering, university of Arak, Arak, Iran (2009) and his M.Sc. degree in chemical engineering at Tarbiat Modares University, Tehran, Iran (2011). He is a Ph.D student in chemical engineering at Tarbiat Modares University (Tehran, Iran) and Lecturer at Buinzahra Branch Islamic Azad University (Qazvin, Iran). His research mainly focuses on waste water treatment, photocatalys and catalyst, modelling and simulation, nanoparticle material, environment, etc. M. Vaez has published several papers and journal articles in the aforementioned fields. Some selected papers have been cited as reference.
A. Zarringhalam Moghaddam was born on Jun
1948 in Tabriz, Iran. He has gotten his B.Sc. degree in applied chemistry at Tabriz University, Tabriz, Iran, (1973) and his M.Sc. in chemical engineering at Glamorgan University, Wales, UK (1981) and his Ph.D. degree in chemical engineering at Glamorgan University, Wales, UK (1984). He is associate professor in Tarbiat Modares University (Tehran, Iran). His research mainly focuses on environment, hazardous waste water treatment using photocatalytic methods, fire behaviour study of materials, HSE, synthesis and characterization of nano-structured powdered materials, etc. A. Zarringhalam Moghaddam has published numerous papers and journal articles in the aforementioned fields.