Abstract—The objectives of structural seismic design against various seismic risk levels (weak, moderate, severe and maximum credible earthquakes) are different. However in seismic design codes, only the design base earthquake ground motion (severe earthquake) is usually proposed. This research attempts to determine conversion coefficients of design base earthquake ground motion (10% probability of occurrence) to other earthquake acceleration levels (2%, 5%, 20%, 50% and 64%). For this purpose, two susceptible areas of Sari (Elburz zone in North of Iran) and Fereidoonshahr (Zagros zone in west part of Iran) were chosen and their design accelerations relevant to the various seismic levels were determined. Major fault systems of the sites were reviewed and modeled using suiTable attenuation parameters. The conversion coefficients are (0.2, 0.28, 0.64, 1.51 & 2.41) and (0.36, 0.43, 0.74, 1.33 & 1.88) for Sari and Fereidoonshahr, respectively.
Index Terms—Seismic risk analysis, seismic factors, maximum horizontal acceleration, Seismic risk levels, Sari, Fereidoonshahr.
I. INTRODUCTION
In seismology, the earthquakes of each region are divided into four levels. In seismic design codes, different levels of earthquake are named variously, but the general nomination is as weak, moderate, severe (or strong) and maximum credible (maximum) earthquakes. Here definitions of each of these levels for a particular region are given:
a) Weak earthquake is an earthquake that happens several times during the serviceable life of a building in a particular region.
b) Moderate earthquake is an earthquake that sometimes or at least one time happens during the serviceable life of a building in a particular region.
c) Strong earthquake rarely happens in a given region during the serviceable life of a building.
d) Maximum earthquake is the strongest one that may happen in a particular region.
In 3th edition of Iran’s seismic design codes (2800 standards) [1], two seismic risk levels have been defined for each region; weak (operation) earthquake and strong (Deign Base Earthquake). According to these codes, weak earthquake is a one that its occurring probability is 99.5% during the fifty years of the serviceable life of a building. Return period of this kind of earthquake is 10 years. Strong earthquake (Deign Base Earthquake) is a one that its
Manuscript received December 28, 2015; revised May 2, 2016. The authors are with Shahid Rajaee Teacher Training University, Faculty of civil engineering, Tehran, Iran (e-mail: [email protected]).
occurring probability is 10% during the fifty years of the serviceable life of a building. Return period of this kind of earthquake is 475 years. In 2800 standards, the amounts of design acceleration are only presented for 475-year earthquake and it is suggested that in the case that the acceleration of 10-year earthquake is needed the acceleration of design base earthquake is divided by six and used as weak earthquake; that is conversion coefficient is defined as 1/6.
In Instruction for Seismic Rehabilitation of Existing Buildings (Iranian code for rehabilitation) [2], different levels of earthquakes have been defined, which two more important of them are strong earthquake (risk level-1) and maximum earthquake (risk level-2). Risk level-1 determined based on 10% probability of occurring in 50 years that is return period of 475 years, and Risk level-2 determined based on 2 percent probability of occurring in 50 years that is return period of 2475 years and is known as MPE (Maximum Probable Earthquake).
In 96-01 SSC report of Applied Technology Council (ATC), three levels of moderate, strong and maximum earthquake have been defined for each region. According to this guide, moderate earthquake is the one that its probability of occurring is 50% during the 50 years of serviceable life of a building. The return period of this earthquake is 70 years and is reputed as 70-year earthquake. Strong (Design Base) earthquake, is an earthquake that its probability is 10% during the 50 years of serviceable life of a building and its definition is the same as those of design base earthquake in 2800 standards and Risk level-1 of Instruction for Seismic Rehabilitation of Existing Buildings. Maximum earthquake is a one that its probability is 5% during 50 years and its return period is 1000 years. Based on this guide, if the design base acceleration is available, it is possible to determine the design acceleration of moderate earthquake as half of that of design base earthquake (conversion coefficient of 0.5); and design acceleration of maximum earthquake as 1.25 to 1.5 of that of design base earthquake (conversion coefficient of 1.25 to 1.5) [3].
Other seismic design codes like Japan seismic design codes (BSL), Tri-Services Manual of USA army, New Zealand seismic design codes (NZS), China seismic design codes (GBJ), and UBC have offers the same definitions for weak, moderate, and strong earthquake [4].
As it was mentioned, in various seismic design codes, there are different seismic risk levels for designing but mostly the design acceleration of strong earthquake (475 years) is introduced and to have the accelerations of other
Evaluation of Conversion Coefficients of Design Base
Acceleration to Accelerations of Other Seismic Risk
Levels
levels, the acceleration of strong earthquake should be multiply by a conversion coefficient.
The purpose of the present study was the investigation and evaluation of the offered coefficient of different seismic design codes for determining of designing accelerations of weaker and stronger than design base earthquake. For this purpose, two regions of Sari and Fereidoonshahr were chose as the sample and the amounts of design accelerations of different seismic risk levels for these regions were determined. Then, the proportion of these amounts to design basis earthquake acceleration was computed and they were compared with proposed amounts of the standard codes.
Risk evaluation maps are very important in preventing geological disasters or at least reducing them to minimum and also as the guide for reconstruction after earthquake [5]. Ghodrati Amiri et al. [6] analyzed seismic risk for East Azarbayejan, (East Province in Iran) through probability method using four attenuation equations of Ghodrati, Ambersis, Sedigh and Kampbel for a 20 21 mesh with distances of 15 km. They represent the results as the co-acceleration maps at two risk levels of 2% and 10% during 50 years of serviceable life of a building.
Ebadi et al. [7] studied the seismic risk of Khark island limits; and, according to the geological properties, divided the area to 11 seismic states. They computed seismic parameters based on seismological characteristics. They analyzed seismic risk using two methods of determining and probability and computed maximum acceleration of every state.
Ghodrati Amiri et al. [8], by means of probability method of seismic risk analysis, computed the maximum acceleration on bed stone in four seismic risk levels of 2%, 10%, 20%, and 50% for Sanandaj city. Besides, Ghodrati Amiri et al. [9] prepared the maps of co-acceleration lines of different seismic risk levels of the area of mashhad using three attenuation equations of Ghodrati, Ambersis, and Sarma.
Chey and et al. evaluate the behavior of smart building isolation system under multi-level earthquake excitations [10].
Fig. 1. Active faults in Sari region.
II. SEISMOTECTONICS OF SARI AND FEREIDOONSHAHR
In order to compute and evaluate the seismic risk of a region all sources of probable data should be recognized and be checked to see whether they have the capability of affecting plate movement (Plate Tectonics). First step to do this is accurate and perfect recognition of the faults of Sari and Fereidoonshahr’s area. Therefore, a list of name, length, and maximum seismic power of the faults of Mazandaran
province’s region (in a radius of 200km around Sari city) is presented in Fig. 1 and Table I [10]. Moreover, Figure 2 shows the map of active faults of Fereidoonshahr in a radius of 200km. It should be mentioned that the amounts of maximum seismic power computed based on the equation 1 proposed by Norouzi [11] in which L is the length of the fault.
Ms=1.259+1.244Log(L) (1)
TABLEI:CHARACTERISTICS OF ACTIVE FAULTS IN SARI REGION
Magnitude (R) Fault Length (km)
Fault Name
7.1 105
Behshahr
6.7 50
Gorgan
6.7 50
Babol
7.2 130
Khazar
7.2 135
North khazar
III. SEISMICITY OF REGIONS
The history of past earthquakes of each area shows the seismicity of that area. In order to access the geological characteristics of each area, a complete list of seismic events of the area should be provided. In the present study, large seismic events of Sari and Fereidoonshahr in a radius of 200km are presented.
Fig. 2. Active faults of Fereidoonshahr region. TABLEII: HISTORICAL SEISMIC DATA OF SARI
Earthquake Year Magnitude (R) Chardangeh 1127 6.8
Farim 1301 6.8 Gorgan 1436 5.3 Gorgan 1470 5.5 Gorgan 1498 6.5
Historical sources and reports of destructions and damages of previous centuries, demonstrates the number and repetition of fault movements Sari and Fereidoonshahr. seismic data of twenty century contain different errors in surface center, focal depth, and magnitude of the earthquakes, they have more importance because of machinery recording; and with the advent of seismograph network in 1963 and the use of telemetric method in recent decades, these errors have been reduced.
Besides, Table IV and V demonstrate the earthquakes of Fereidoonshahr since 1052 till now. These Tables (II, III, IV, and V) report the name, coordinates of focus, magnitude, and the source of the reports of the earthquakes [12].
IV. SEISMICITY PARAMETERS OF SARI AND
FEREIDOONSHAHR
In order to compute the basic parameters of Seismicity of each region, which are λ and β, the historical and recorded data of regions should be gathered. As the independency of earthquake is the fundamental assumption in estimating the basic parameters of Seismicity, temporal and spatial window [13] method was used to eliminate pre- and post-earthquakes.
TABLEIII: RECORDED SEISMIC DATA OF SARI
Earthquake Year Magnitude (R) Talar roud 1935 5.8
Kosout 1935 6.3 Bandpey 1957 6.8 Babolkenar 1971 5.2 Bayjan 1983 5
In analyzing seismic risks usually a magnitude like Ms related to surface waves or mb of volume waves is used. However, as the earthquakes that both of their magnitudes were available were not numerous in the previously mentioned list of the study, the following equation that offered by Iran’s national committee of large dams was utilized [14]:
Ms=1.21mb-1.29 (1)
TABLEIV: IMPORTANT HISTORICAL EARTHQUAKES IN
FEREIDOONSHAHR Magnitude East longitude North latitude Occurrence of earthquake 6.8 50.00 31.50 Khouzestan 1502 6.2 49.40 33.50 Golpaygan 1316 6.5 50.50 32.10 Zagros 1666 6.4 51.40 33.60 Kashan 1844 5.5 50.30 32.60 1853
TABLEV:IMPORTANT RECORDED EARTHQUAKES IN FEREIDOONSHAHR
Magnitude East longitude North latitude Occurrence of earthquake 6.3 49.60 32.06 1929 6.2 49.80 32.26 1951 6.1 50.70 31.99 1973 6.1 49.65 32.14 1978 5.6 49.33 32.00 2002
The seismicity parameters are computed based on occurring the earthquakes and their frequency-magnitude ratio. In the present study the new method of Kijko and Selol [15] was utilized in computing the seismic parameters. In this method by considering the errors of seismic data during various eras and by means of Kijko’s model, the occurring of earthquakes can be used in estimation of seismic parameters λ and β. The results of this method consist of parameters λ and β, return period, occurring probability, and non-occurring of earthquake in different times. In this method three types of earthquake have
generally been considered:
1) First type was the historical earthquakes that their magnitudes were considered as 0.3, 0.4, and 0.5 unit of magnitude for good, average, and bad respectively.
2) Second type was the earthquakes of present century before the installation of international geometer (from 1900 to 1963) that their magnitude was considered as 0.2 unit and threshold magnitude as Ms=4.5.
3) Third type was the earthquakes after 1964 that were recorded and had high accuracy. Their magnitude was considered as 0.1 unit and threshold magnitude as Ms=4.
Parameters of seismic activity that were used in this study are shown in Tables VI, VII, and VIII
.
TABLEVI:COMPUTED PARAMETERS OF SEISMIC ACTIVITY FOR SARI
β b λms=3.9 Mmax 0.01±2.09 0.01±0.82 0.10±1.39 0.64±8.4 TABLEVII:PERCENT OF THE CONTRIBUTION OF DATA OF DIFFERENT
ERAS Seismic parameters Before 1900 1900-1964 1964-2011 β 34.2 32.8 33 λ 9.2 34 56.8
TABLEVIII:PARAMETERS OF SEISMICITY OF FEREIDOONSHAHR
β b λms=3.99 Mmax 0.08±2.09 0.03±0.91 0.1±1.39 0.71±7.90
V. PROBABILISTIC METHOD
(
PSHA)
In Probabilistic method, economic and safety issues are considered. By modeling the seismic sources of the region and probabilistic theory for every percent of seismic risk, the maximum acceleration (PGA( would be computed. The software of SEISRISK III [16] was used for modeling and computing maximum acceleration. In order to have more logical results, a number of attenuation equations in addition to logical tree were utilized to calculate average weight of the accelerations.
A. Choosing Attenuation Equations
B. Design Base Acceleration
According to aforementioned issues, forming a 67 mesh for Sari and a 57 mesh for Fereidoonshahr with dimensions of about 1000m, and calculating the acceleration in different parts, co-acceleration map of risk levels of 10% in 50 years, 10% in 50 years, 2% in 50 years, 5% in 50 years, 20% in 50 years, 50% in 50 years, and 64% in 50 years was provided. The final results of probable risk analysis of Sari region for different risk levels are shown in Figs 4 to 9. In these Figures vertical and horizontal axes show the location of Sari that the amounts of acceleration of each part are given on co-acceleration curves. In Fig. 4 which shows the acceleration of risk level of 2%, the maximum acceleration is 0.96g and minimum is 0.56g. As the distance from the fault becomes larger the acceleration reduces. The amount of 0.96g is related to very close area to the fault.
Fig. 3. Logical tree of maximum horizontal axe.
Fig. 4. Acceleration (PGA) for risk level of 2%.
Fig. 5. Acceleration (PGA) for risk level of 5%.
Fig. 6. Acceleration (PGA) for risk level of 10%.
Fig. 6 is related to risk level of 10%. Its maximum acceleration is 0.35g and minimum is 0.26g. In 2800 standards, the amount of the acceleration of risk level of 10% for Sari was suggested as 0.3g.
Fig. 7. Acceleration (PGA) for risk level of 20%
Fig. 8. Aacceleration (PGA) for risk level of 50%
Fig. 9. Acceleration (PGA) for risk level of 64%.
The results related to Fereidoonshahr are presented in Fig. 10 to 15.
Fig. 10. Acceleration (PGA) for risk level of 2%.
Fig. 11. Acceleration (PGA) for risk level of 5%.
The maximum and minimum of design base acceleration for risk level of 10% according to Fig. 12 are 0.35g and 0.26g respectively. 2800 standards suggested the amount of 0.3g for this region.
Fig. 13. Acceleration (PGA) for risk level of 20%.
Fig. 14. Acceleration (PGA) for risk level of 50%.
Fig. 15. map of acceleration (PGA) for risk level of 64%.
Fig. 16. Proportion of acceleration of 2% to acceleration of 10% for under study parts of Sari.
VI. DETERMINING CONVERSION COEFFICIENTS OF
ACCELERATION
According to the data represented in pervious parts, conversion coefficients of acceleration can be calculated for every part and for every risk level. This was done for nodes of the mesh for risk levels of 2 to 64 percent. For example for calculating conversion coefficients of a part with risk level of 2% the acceleration of this risk level would be divided by the risk level of 10% in that part. Figure 16 shows this proportion for all under study parts of Sari. In
order to make these proportions applicable, the average of them was computed and came out as 2.42. Therefore, based on the results of this study, it can be said that by having the acceleration of risk level of 10% and multiplying it by 2.42, the acceleration of risk level of 2% would be obtained. Fig. 17 shows these computations for Fereidoonshahr and the proportion came out as 1.88.
Fig. 17. Proportion of acceleration of 2% to acceleration of 10% for under study parts of Fereidoonshahr.
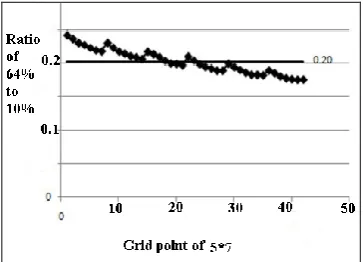
This process was done for all risk levels. However, to save the space, just the results related to risk level of 64% are presented in Figs 18 and 19 for Sari and Fereidoonshahr respectively. Table IX represents the maximum accelerations for Sari and Fereidoonshahr.
For calculation of conversion coefficients of accelerations, the average of division outcomes of all accelerations with every risk level of every part by design base acceleration of that part with risk level of 10% was obtained. This was done for every risk level of every region of Sari and Fereidoonshahr separately and presented in Tables X and XI.
Fig. 18. Proportion of acceleration of 64% to acceleration of 10% for under study parts of Sari.
TABLEIX:FINAL RESULTS OF RISK ANALYSIS (PGA) FOR SARI AND
FEREIDOONSHAHR
Risk (%)
Return Period
(Year) Sari Fereidoonshahr 10 475 0.31 0.31
2 2475 0.75 0.59 5 975 0.47 0.41 20 225 0.2 0.23 50 72 0.08 0.13 64 50 0.06 0.11
TABLEX:CONVERSION COEFFICIENTS OF ACCELERATIONS FOR SARI Result
Risk (%) 2.41 2
1.51 5
0.64 20
0.28 50
0.2 64
TABLEXI:CONVERSION COEFFICIENTS OF ACCELERATIONS FOR
FEREIDOONSHAHR
Result Risk (%)
1.88 2
1.33 5
0.74 20
0.43 50
0.36 64
VII. CONCLUSION
The purpose of this study was investigation and evaluation of the offered coefficient for different seismic design codes for determining of design accelerations of weaker and stronger earthquakes than design base earthquake with risk level of 10%. For this purpose design accelerations for risk levels of 2, 5, 10, 20, 50, and 64 percent for regions of Sari and Fereidoonshahr were calculated and their ratio of these amounts to accelerations with risk level of 10% was computed. Accordingly the following results were obtained:
1) The design base acceleration for Sari and Fereidoonshahr obtained as 0.31g which confirms with suggested amount in 2800 design code.
2) The conversion coefficients of accelerations of different risk levels of 2%, 5%, 20%, 50%, and 64% to design base earthquake (10%) for Sari were 2.41, 1.51, 0.64, 0.28, and 0.2 respectively.
3) The conversion coefficients of accelerations of different risk levels of 2%, 5%, 20%, 50%, and 64% to design base earthquake (10%) for Fereidoonshahr were 1.88, 1.33, 0.74, 0.43, and 0.36 respectively. 4) In ATC code, the conversion coefficient of 10%
earthquake to 5% is suggested as 1.25 to 1.5 that confirms with obtained amounts for Sari and Fereidoonshahr.
REFRENECES
[1] Iranian Building and Housing Research Center, Iranian Code of
Practice for Seismic Resistant Design of Buildings, Standard No.
2800, 2005.
[2] Iranian Management And Planning Organization, Instruction for
Seismic Rehabilitation of Existing Buildings, No. 360, 2005.
[3] Applied Technology Council, Seismic Evaluation and Retrofit of
Existing Concrete Building, ATC40, Redwood, 1996.
[4] M., Mahmoudi, Philosophy of Performance Based Seismic Design,
Shahid Rajaee Teacher Training University, pp. 7-9, 2009.
[5] N. Q. C. Weiming, L. Yong, X. Y. L. Hengxing, and C. Yanyong, “Risk assessment of secondary geological disasters induced by the yushu erthquake,” J. Mt. Sci, vol. 9, pp. 232-242, 2012.
[6] G. G. Amiri, M. A. Rahimi, H. R. Razeghi, and S. A. R. Amrei, “Probabilistic seismic hazard analysis of province of east azarbyjan,”
in Proc. First Conference on Passive Defence and Resistant
Structures, Babol University of Technology, Iran, March 2011.
[7] R. Ebadi, M., Zare, A., Solgi and F. Sinaeyan, “A study on seismic hazard in khark island,” Journal of the Earth, vol. 5, no. 1, pp. 21-28, Spring 2010.
[8] G. G. Amiri, K. S. A. Andisheh, and R. Amri, “Probabilistic seismic hazard assessment of sanandaj,” Structural Engineering And
Meechanics, vol. 32, no. 49, 2009.
[9] G. G. S. A. Amiri, R. Amrei, and S. R. Pashanejati, “Seismic assessment of imam reza (peace be upon him), holy shrine region,”
Journal of Science & Technology, vol. 51, no.1, pp. 33-39, 2010.
[10] M. H. Chey, J. G. Chase, J. B. Mander, and A. J. Carr, "Aseismic smart building isolation systems under multi-level earthquake excitations,” Frontiers of Structural and Civil Engineering, vol. 9, issue 3.
[11] M. S. Zadeh and M. Zare, “A preliminary study of seismicity, seismo tectonics and earthquake fault hazard in the mazandaran province, Iran,” International Institute of Earthquake Engineering and
Seismology, no. 74-95-7/3, Oct. 1995.
[12] A. Nowroozi, “Empirical relations between magnitude and fault parameters for earthquakes in Iran,” BSS, pp. 327-1338, 1985.
[13] IRCOLD, Iranian Committee of Large Dams, Relationship Between
Fault Length and Maximum Expected Magnitude, Internal Report,
1994.
[14] N. N. Ambraseys, and C. P. Melville, A History of Persian
Earthquake, Cambridge University Press, Britain, 1991.
[15] J. K. Gardanerand and L. Knopoff, “Is the sequence of earthquake in southern California, with aftershocks removed,” Poissonian, pp. 1363-1367, 1974.
[16] A. K. Statical, “Timation of maximum regional earthquake magnitude mmax,” Workshop of seismicity Modeling in seismic Hazard Mapping,
poljce, Slovenia, May, 22-24, 2000.
[17] B. Bender and D. M. Perkins, "Seisrisk-III: A computer program for seismic hazard estimation, US Geological Survey," Bulletin 1772 1987.
[18] G. G. Amiri, A. Mahdavian, and F. M. Dana, "Attenuation Relationships for Iran,” Journal of Earthquake Engineering, vol. 11, no. 4, pp. 469-492, 2007.
[19] H. R. Ramazi, “Attenuation laws of Iranian earthquakes,” in Proc. the Third International Conference on Seismology and Earthquake
Engineering, Tehran, Iran, pp. 337-344, 1999.
[20] S. K. Sarma and M. Srbulov, “Á simplified method for prediction of kinematic soil foundation interaction effects on peak horizontal acceleration of a rigid foundation,” Earthquake Engineering and
Structural Dynamics, vol. 25, no. 8, pp. 815-836, 1996.
Mussa Mahmoudi was born in Iran in 1963. He received his B.Sc. in civil eng. from Ferdowsi University of Mashhad Mashhad, Iran, 1990; He received his M.Sc. in structural eng. from Tarbiat Modarres University, Tehran, Iran, 1993; He received his Ph.D. in structural and earthquake eng. from Tarbiat Modarres University, Tehran, Iran, 1999 He participated in some structural projects as a desighner and project manager such as: tall buildings, bridge, silo, cooling tower, wharf, airport and water intake. He LECTURES several topics in civil engineering field in B.Sc., M.Sc., and Ph.D. courses. He is an assistant professor in Shahid Rajaee University in Tehran, Iran. He writes two books: Philosophy of performance based seismic design 2009, and Design of base plate connection in steel structures 2014, Publisher: Shahid Rajaee University. He also writes about 60 articles in structure and earthquake engineering presented in journal and conferences. His research interests are structural dynamics, nonlinear analysis, response modification factors, structural rehabilitation.