Abstract— Flight test is conducted to prove performance re-quired. Aircraft development engineers or flight test engineers use visualization tools for flight test to monitor aircraft perfor-mance in Flight Telemetry Ground Station. Thereafter,telemetry flight data are analyzed by analyzing tools after flight test. Con-ventional systems used for flight test record the real time flight data into certain storage medium based on file. Thus, to analyze data after flight test, complicated steps of download and import process are needed. In this paper, two kinds of systems based on database are designed and implemented for flight test. Suggested systems provide useful visualization tools that monitor perfor-mance of the aircrafts and designed to store real time telemetry data into database during the flight test. Also, proposed systems are designed to analyze flight test data easily in various search conditions and to revisualize the same situations of past flight test immediately by using. Some tools of the suggested system are already in use in the field of flight test and more tools will be applied.
Index Term— Flight Data Visualization, Post-test Flight Da-ta Analysis, Flight Telemetry Ground SDa-tation, DaDa-tabase, Track Display
I.INTRODUCTION
Aircraft development life cycle is divided into 3 phases;
First, concept phase that the overall aircraft performance and configuration are determined, such as payload and range, air-craft size, number and locations of engines, airfoil, applica-tions of new technologies in design and manufacturing. Se-cond, development phase which consists of function, architec-ture, design and implementation. Last, production and opera-tion phase that producopera-tion and operaopera-tion are managed. Due to the highly complex and integrated nature of modern aircraft systems, the regulatory authorities have highlighted concerns about the possibility of development errors causing or contrib-uting to aircraft failure conditions. Thus, certification proce-dure which applies instructions of DO-178B/ED-12B and DO-254/ED-80 should be followed to prevent development errors on developed aircrafts[1, 2, 3, 4].
Flight test should be conducted by not only safe but also definite means to prove required performance of aircrafts in real world. Also, overall system performance should be moni-tored to confirm PFCS(Primary Flight Control System) and SFCS(Secondary Flight Control System) function correctly under normal operating conditions throughout the aircraft's flight envelope [5, 6].
FTGS (Flight Telemetry Ground Station), a facility that
re-location to monitor the aircraft performance during flight test, is used. In this facility, aircraft development engineers or flight test engineers monitor performance of the aircraft with data visualization tools such as map display, 3D aircraft model display, etc.[7-11].
After each flight test, there are a number of actions that should be taken to assure weather the objectives of the flight were met, no unexpected results were encountered, and to determine when the next flight can be conducted. Analyzing tools are required for PFD (Post Flight Debrief), which is car-ried out after flight test, data may be useful such as telemetry flight data sheets, graphs and video records of flight test
con-ducted in a chronological order to ensure
complete-ness[5].
Conventional flight test tools usually have been developed is that recording the real time telemetry data during flight test into certain storage medium on file basis. Also, real time flight data are categorized and recorded by each flight sorties. Therefore, complicated steps of download and import process-es are required to search certain point of certain parameter for analysis in numerous flight test files.
In this thesis, we propose flight test tools based on database, unlike conventional systems based on files. Suggested tools are grouped together by FDVS(Flight Data Visualization Sys-tem) and PFDAS(Post-test Flight Data Analysis SysSys-tem). FDVS is designed to enable engineers, who conducted flight test or participated in aircraft development, to monitor aircraft status during flight test in real time. Real time telemetry data received during flight test are immediately stored in database. PFDAS is designed not only to debrief and analyze flight test data easily by various conditional search but also to revisual-ize the same situations of past flight test by using database.
II.BACKGROUND
A. Flight Data Visualization
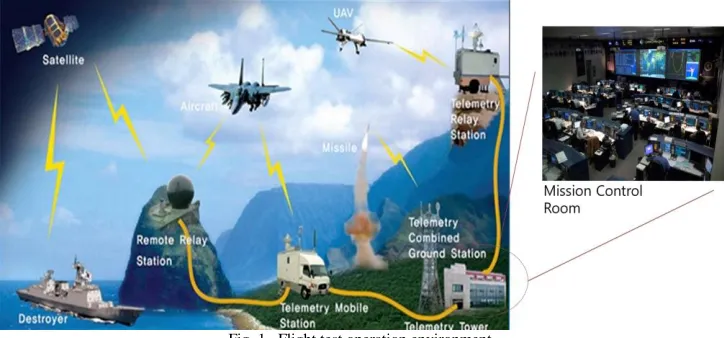
It is very important for aircraft development engineers or flight test engineers to check unexpected failure of on-flight aircraft and to monitor status of the aircraft for decision mak-ing for test[5]. For this reason, flight data visualization tools are used, which collect data of the aircraft from remote loca-tion and display[12-15]. These tools are used in MCR (Mis-sion Control Room) in FTGS, which controls and monitors flight test missions, which is shown as Fig. 1.
Choongnam, 356-706 South Korea (e-mail: [email protected]).
Fig. 1. Flight test operation environment.
[12] research introduces 2D and 3D model visualization and interface structure of precise data display as well as concept for design and implementation of Flight Data Visualization System and also discusses how to manage big scale of geo-graphic models and data sets effectively in real time 3D appli-cation.
[15] research suggests waypoint tracking visualization sys-tem to help pilot recognize current flight status and alarm pos-sible collision by analyzing flight path and geographic infor-mation. This system consists of Flight Manipulation System, Visualization/UDP Engine, Visualization Panel and Waypoint Tracking. This system is designed to be adapted for aircraft development or flight training. However, there are limitations on visualizing primary control surfaces(Aileron, Rudder and Elevator) and 3D motion(Pitch, Roll and Heading).
There is a commercial system used for data visualization in FTGS. This system consists of 3 parts; Mathematical Display Application, 3D Display Application and Map Display Appli-cation to display telemetry data in various forms. Since this system provides Display Editor, which is able to produce complicated images easily, it can be adapted for many types of airplane. However, it doesn't follow DO-178B/C(Software Considerations in Airborne Systems and Equipment Certifica-tion). And this system provides the function of 3D Display by allocating Pitch, Roll, Heading and Altitude for 3D attributes. However, there are limitations in representing precise motions of aircraft such as Aileron, Rudder, Elevation, Landing Gear, etc. Map Display Application of this system provides display of overlaid parameter data in GIS(Geographical Information System) data. This application can display the position and track of airplane on existing GIS data (Roads, Rivers and Po-litical boundaries), as well as zoom-in and zoom-out are avail-able. It also provides tool (lines, test and polygons) so that users can draw additional features on the map. However, there is deterioration in map reality that GIS data are implemented, applied in this application, when compared with real satellite map images. Moreover, it is impossible to display position of aircraft in one map when testing 2 or more aircrafts. In addi-tion, heading of the aircraft can not be expressed.
B.Post-test Flight Data Analysis
Flight test engineers need to analyze stored telemetry data after flight test to confirm abnormal events or defects of facili-ties and define causes.
There are cases that FDR(Flight Data Recorder) and Pro-spector are used to support those needs[16, 17]. In those cases, commercial web browser application is provided which im-ports flight test data into centralized data storage device and
export file to use in analysis system. This application stores
telemetry data during real time flight test into server in certain file format or Chapter 10 format suggested by IRIG 106 [18], which is digital recording standard. To utilize these stored files for analysis after flight test in visualized form, file
im-porting process is required. Application users access through
the web browser, then retrieve required data with web page interface. The retrieved data can be displayed in graphs, also can be saved in CVS or Matlap form of files through export-ing process. The source files used in this application are stored by sortie. This mechanism is the cause of increasing costs of data manipulation and search for analysis after flights test.
[16] reads data from FDR, lists up and schematizes the data. Thereafter, it shows 3 dimensional aircraft model which dis-plays cockpit instrument panel and aircraft control surfaces deflection by using animation function. It also provides air-craft track display by using map images obtained from GIS tool and Google Earth.
C. Requirements
Usually in conventional systems, data for analysis after flights test are stored in certain storage media. To search or to revisualize the data on abnormal event, complicated steps are required. This requirement is the cause of cost increase for analysis, when flights test files are accumulated and increased. To overcome this limitation, it is necessary to utilize database which effectively stores real time telemetry data during flight test, is also able to search data in various conditions immedi-ately, ensures safety of data management and is able to sup-port various applications.
Moreover, improvements are needed as follows on the flight test tools usually used nowadays;
- 3D model display tool should be designed to monitor
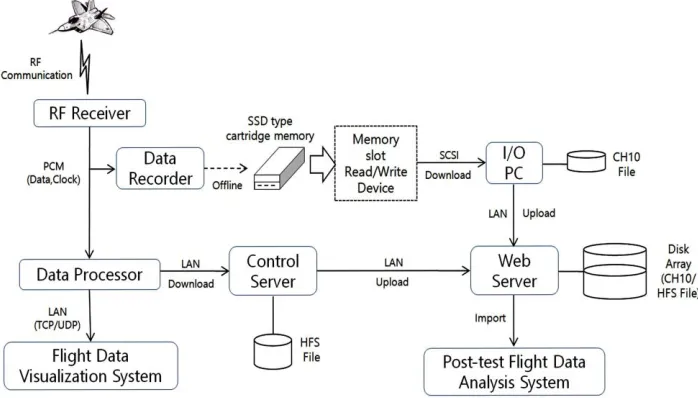
on-Fig. 2. Hardware structure of proposed system.
III. SYSTEMDESIGNANDIMPLEMENTATION
The development scope of the suggested system is the dot-ted part of Fig. 2. It is designed with FDVS, which receives the telemetry data of real time status of the aircraft and moni-tors flight test process and PFDAS, which stores data into da-tabase and helps analyzing data after flight test.
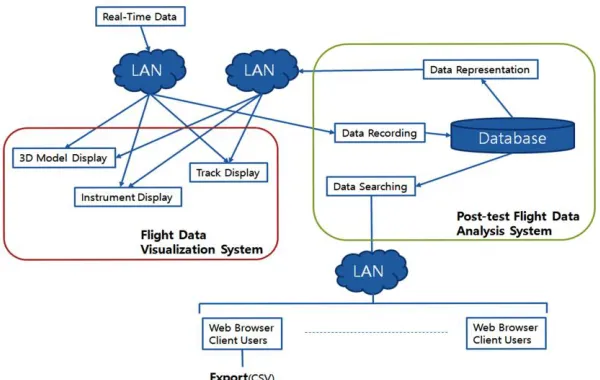
In Fig.3, FDVS is designed to visualize flight test process by providing 3D Display, Instrument Display and Track Dis-play tools. PFDAS consists of Data Searching Module, Data Recording Module and Data Representation Module. These Modules enable to retrieve data for analysis and to output the retrieved data values in graphs or CSV form of file by using database. They are also designed to revisualize past flight test by being interconnected with FDVS.
Fig. 3. Software structure of proposed system.
A.Flight Data Visualization System 1) 3D Model Display
As shown in Fig. 4, 3D Model Display tool displays altitude of aircraft (Pitch, Roll and Yaw) in 3D coordinate system by
Fig. 4. Coordinate system applied to the aircraft.
Furthermore, it displays data of Pitch, Roll, Heading, VOR(VHF Omni Range), Altitude, IAS(Indicated Airspeed), VS(Vertical Speed) and RPM(Revolution Per Minute) on in-strument images. 3D Model Display tool is implemented by Unity 3D which is usually used for 3D visualization sys-tem[21, 22].
3D Model Display tool has 4 layers as shown in Fig. 5. Communication Layer receives real time data by using TCP socket from real-time data transmission module and Data Lay-er intLay-erprets data in pre-designated ordLay-er and records in buffLay-er. 3D Driver Layer displays 3D background and aircraft model on screen, executes the program written in script to display altitude of aircraft model, primary control surfaces, landing gear and operation of engine ignition.
Fig. 5. Block diagram of 3D Model Display.
2) Instrument Display
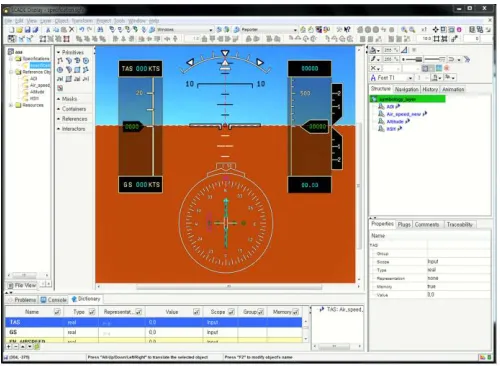
Instrument Display tool is implemented by using SCADE Display and SCADE Suite which have qualified code
genera-tors with DO-178B/C[19, 20].It displays aircraft data and its
environment such as air speed, altitude, Pitch, Roll, Heading and Ground speed, and it is designed to look same as instru-ment display in cockpit of aircraft. Instruinstru-ment Display tool consists of 3 Layers; Data Receive Layer which receives real time data, Display Layer which displays flight data on instru-ment model and I/O Manageinstru-ment Layer which manages input and output between telemetry data and instrument model.
Display Layer displays telemetry data on the screen by us-ing instrument model. Fig.6 shows integrated development environment to design instrument model with SCADE Dis-play.
Fig. 6. Design of instrument model with the SCADE Display.
Fig. 7 shows tool to connect I/Os between SCADE Suite model and SCADE Display model in Fig. 6.
Fig. 7. Data combination with the SCADE Suite.
3) Track Display
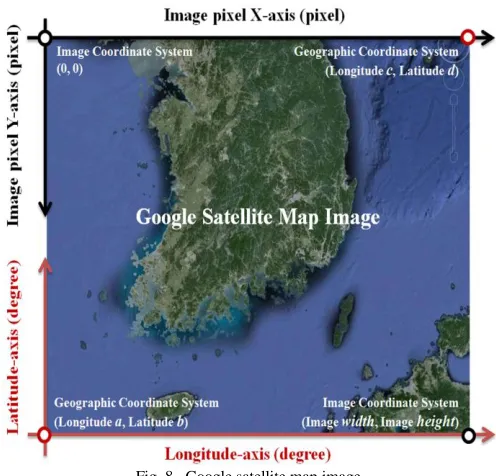
Fig. 8. Google satellite map image.
Function (1) concludes X axis pixel value by receiving Lonθ which is longitude data of aircraft, Function (2) con-cludes Y axis pixel value by receiving Latφ which is latitude data of aircraft. Width, height, a, b, c and d indicate the coor-dinate value of Fig. 8.
Lon a
a c width
x
(1)
d Lat
b d height
y
(2)
TACAN provides VOR and distance from antenna. Position of aircraft is defined from VOR and DME by assuming the position of the antenna as origin. Fig. 9 indicates position of aircraft by using real time data of VOR, DME and ALT on longitude, latitude and altitude axis.
Fig. 9. 3-dimensional Cartesian coordinate system for representing the air-craft position.
real time on the map in aircraft icon. Coordinate system space provided by Win32 API(world, page and device) is used to display the icon. Aircraft icon is rotated by using real time data of aircraft direction in world coordinate system space. Then the center of the rotated icon is moved to the origin, when rotated icon is marked on page coordinate space. There-after, a page with aircraft icon is drawn on monitor screen, the GPS longitude and latitude coordinates are marked on the map in pixel coordinates.
B. Post-test Flight Data Analysis System
In conventional system, flight test data are recorded in cer-tain form of files of storage medium and managed by each flight sortie. Thus, as number of flight sortie increases, time for data search for analysis increases accordingly. This thesis suggests database based integration and management of data, instead of file based flight data managed by flight sortie. This system enables to store all received real time data in database and to manage, so that they can be easily used in several ap-plication programs.
Suggested PFDAS consists of data Recording, Data Search-ing and Data Representation module. Fig. 10 shows block diagram of this system.
Fig. 10. Block diagram of PFDAS.
1) Database
analysis after flight test. It is also used for revisualization of flight test conducted in the past through 3D Model Display, Instrument Display and Track Display tools of FDVS. Data-base is designed to depart real time data and historical data subjectively. It categorizes real time data which is mostly write operations and historical data which mostly perform read
operations, so that it can ensure recording speed and searching speed by index. Database table consists of approximately 200 attributes to record telemetry flight data, it receive 50 times of data per second. Fig. 11 shows some parts of parameters that compose the table.
Fig. 11. Table structure.
2) Data Recording
Data Recording Module is interconnected with real time da-ta process equipment. The received real time dada-ta are stored in database. Communication Layer consists of Connection Man-agement and TCP socket communication, is linked with real-time data transmission equipment through network. Process Layer interprets data framed and transmitted via socket and sends it to Data Buffer. Data Layer accesses database and stores data from Data Buffer.
3) Data Representation
Data Representation Module is used when revisualization of past flight test is needed. Data Representation Module replays historical data stored in database, interconnects with FDVS and revisualizes past flight test. Data Layer accesses and re-trieves data with conditions that are users input from User Interaction Layer. Data Process Layer converts data retrieved from database into socket data transmission form which can be used in FDVS, and transmits by using socket.
4) Data Searching
If unexpected failures of aircraft or events of flight test mis-
sion are found during flight test, flight test engineers would perform data analysis after flight test. Data Searching Module is designed for those analytic works to be easily performed interactively based on web, provides menu driven search func-tions. Searched data are to be displayed in tables and graphs, converted into files for saving. User Interaction Layer consists of ‘Data Chart Display’, ‘Export CSV File’ and ‘Select Ser-vice Menu’, follows user’s command and displays retrieved data.
Menu driven searching functions are ‘Parameters Search’, ‘Comparative Search’, ‘Conditional Search’ and ‘File Export’. ‘Parameters Search’ function shows all parameter data col-lected in certain flight test in table form. ‘Comparative Search’ function is used when parameter comparison analysis is re-quired in timely manner in certain flight test. Number of com-pared parameters is from 2 up to 4. ‘Conditional Search’ func-tion is for every flight test stored in database, and can be used to analyze weather certain selected parameter value is in cer-tain range. ‘File Export’ function is designed for users to con-vert flight test data into certain form of file so that users are able to apply general analytic tools.
data after flight test. First, PCM data from RF Receiver in Chapter 10 format record into cartridge memory of Data Re-corder. To use the data, cartridge memory should be removed from Data Recorder and inserted to Read/Write Device, which is connected with I/O PC and download to I/O PC as file for-mat. Thereafter, upload the files to Disk Array of Web Server and store in Disk Array. Data Processor also records telemetry data in real time. To use the data recorded in Data Processor, it should be downloaded to storage of Control Server, then again uploaded to Disk Array of Web Server. Finally, the flight data stored in Disk Array should be imported for usage of analysis work.
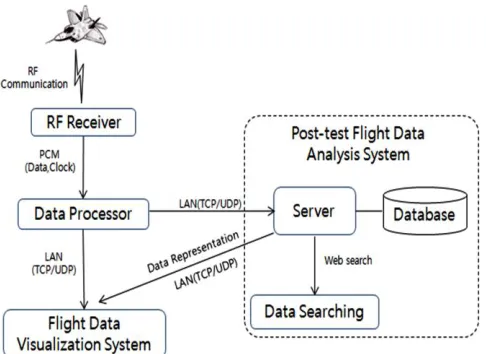
On the contrary, suggested system needs the following pro-cedure, as shown in Fig. 13, for storing real time data storage, analysis and revisualization.
Fig. 13. Flight data processing procedure of propose system.
Flight data are directly stored in the database server con-nected with Data Processor during flight test. The stored data can be immediately used at any time for analysis without any other processes. Suggested system enables real time data pro-cess for analysis not only during flight test but after flight test. Furthermore, Engineers who are participated in development can share data and use in several applications for various
ana-lytic works.Moreover, it enables integrated management,
pol-icy for security maintenance and to ensure physical and logi-cal data independence.
Suggested system can also provides redisplay of situations in past flights test. Hereat, FDVS is used. In other words, past flight test can be immediately revisualized by using 3D Model Display, Instrument Display and Track Display tools of sug-gested FDVS with database.
Fig. 14. Screenshot of 3D Model Display.
The altitude of the aircraft is displayed in the center of the screen by receiving data of Pitch, Roll and Heading. By using mouse, 3D model can be rotated in various angles, zoom in and out are also available. Implemented 3D model can display the motion of primary control surfaces by data of receiving data of Aileron, Rudder and Elevator. It also displays the sta-tus of engine ignition and motion of landing gear when taking-off and landing. Image of dedicated camera for landing gear is displayed in the left bottom of Fig. 14 for zoom-in of landing gear motion. The right bottom of Fig. 14 shows the part which displays instrument information simplified PFD of aircraft. Instrument information displayed here are HDG, Pitch, Roll, Altitude, IAS, Engine Torque, VOR, Vertical Speed Rate, etc.
Fig.15 shows screenshot of instrument display for PFD of
aircraft cockpit,which is implemented by usingSCADE
Dis-play and SCADE Suite.
Fig. 15. Screenshot of Instrument Display.
coordi-nate system have converted into plane coordicoordi-nate system. To correct these errors, functions are implemented that take the latitude and longitude data as parameters and output correction
value. Function (5) corrects longitude errors and function (6) corrects latitude errors.
2 ) 4143 . 124 (
20 ) 81521
. 38 ( ) 5 . 126 (
2 .
0
longitude latitude longitude
R (5)
166 ) 36 (
) 17 ( 5 . 127 )
82521 . 38 ( ) 2
( 2
latitude longitude latitude
S (6)
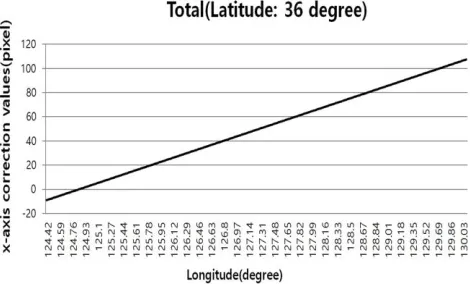
Pixel values from the calibrating functions are shown in Fig. 16 and Fig. 17.
Fig. 16. Correction value of x coordinate at latitude 36 degree.
Fig. 17. Correction value of y coordinate at longitude 127 degree.
Since corrected pixel values are implemented in 2-dimensional map, it is possible to display more precise posi-tion of aircraft. Fig. 18 shows track display performed by re-ceiving telemetry data of aircraft (Latitude, longitude, Head-ing, Altitude, VOR and DME). Up to 4 aircraft icons are dis-played at the locations that synchronized with position data.
Fig. 18. Screenshot of Track Display.
4 boxes on the left top in Fig. 18 display information of on-flight aircrafts, such as position, altitude, speed, etc. Up to 4 aircrafts are visualized on one screen at the same time when multi flight test, it helps decision making since it enables en-gineers to expect aircraft direction by implemented direction of aircraft nose.
C. Post-test Flight Data Analysis System
Fig. 19. Main web page of the data searching module
Menu provides ‘Parameters Search’, ‘Comparative Search’, ‘Conditional Search’, ‘File Export’, etc. In ‘Parameters Search’ function, when search conditions are entered on the search screen, flight test name in that date can be selected on search list. Flight test data list requested is shown in Fig. 20.
Fig. 20. Screenshot of Parameters Search.
‘Comparative search’ function is designed to show data in graphs so that data are to be compared and analyzed as fol-lows Fig. 21, when flight test name and up to 4 parameters to be compared are selected. In the screenshot, the vertical axis indicates unit of parameter values, the horizontal axis indi-cates time unit. Engineers are able to precisely confirm the data value by graph zoom-in and zoom-out.
Fig. 21. Screenshot of Comparative Search.
‘Conditional Search’ function provides data analysis func-tion for every flight test. This menu shows trends of selected values, when users select parameters to be analyzed among every flight test data. In Fig. 22, vertical axis indicates value of search range, horizontal axis indicates time unit.
Fig. 22. Screenshot of Conditional Search.
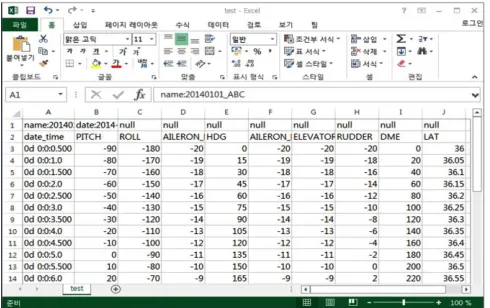
‘File Export’ function performs converting data that re-trieved by entering certain flight test name into file. Fig. 23 shows output of converted Excel file from flight test data.
Fig. 23. Screenshot of File Export.
V. CONCLUSION
abnormal events. In this suggested system, it is possible to store received flight test data into database in real time so that data analysis can be immediately conducted without compli-cated data process procedure, and searching in various condi-tions is also available. 3D Model Display tool of Flight Data Visualization System for real time data monitoring is designed to implement not only the altitude of the flight but also motion of primary control surfaces. Stable Instrument Display tool is implemented by using SCADE Suite and SCADE Display that provide safety-critical programming environment. After sev-eral times of test in field, we could verify the fact that Track Display tool displays the exact position of aircraft on Google satellite images up to 4 aircraft.
Post-test Flight Data Analysis System for data analysis after flight test enables various conditional searching by using data-base. And it is designed to output the retrieved data in graphs or various formats of files. Also, database and Flight Data Visualization System are linked so that past flight test can be easily revisualized.
Some tools of the suggested system have already been used in FTGS. The rest of the tools will also provide improved flight test environment to engineers after several steps of tests and qualification procedures.
ACKNOWLEDGMENT
This work was supported by 2014 research grant from Hanseo University (Project code: 141 Hang-gong 07).
REFERENCES
[1] A. Landi, M. Nicholson, "Guidelines for Development of Civil Aircraft and systems," SAE Int. J. Aero., vol. 4, no. 2, pp. 871-879, Nov. 2011. [2] N. S. Choi, D. W. Ko, G. H. Kim, "Introduction to Civil Aircraft
Devel-opment Process thru KC-100," Int. J. Aeron. Spa. Scie., vol. 13, no. 1, pp. 144-152, 2012.
[3] J. H. Shin, "Shape Determination and Design of the Stability Augmenta-tion System for the Lateral-direcAugmenta-tional Control Surface of Middle Class Airplane," M.S. thesis, Dept. Aero. Eng., Busan Univ., Busan, Korea, 1999.
[4] W. K. Youn, B. J. Yi, "Development Trend of Software Certification Technology for the Safety of Avionic System," Current Industrial and Technological Trends in Aero., vol. 11, no. 2, pp. 189-196, 2013. [5] F. N. Stoliker, "Introduction to Flight Test Engineering," NATO. Res.
Tech. Org., vol. 14, July. 2005. [online]. Available: http://www.dtic.mil/docs/citations/ADA444990. Accessed on: March. 28, 2015.
[6] K. R. Darrow, "An Overview of U.S. Army Developmental Flight Test-ing," presented at the U.S. Air Force T&E Days 2010, Nashville, Ten-nessee, USA, Feb. 2-4, 2010.
[7] B. Kayayurt, I. Yayla, A. Yapici, "Ground Control Station Avionics Software Development in Anka Uav," presented at the 30th Digital Avi-onics Systems Conference, Seattle, WA, USA, Oct. 16-20, 2011. [8] G. Natarajan, "Ground Control Stations for Unmanned Air Vehicles,"
Def. Sci. J., vol. 51, no. 3, July. 2001.
[9] A. Ceruti, F. De Crescenzio, F. Flamigni, F. Persiani, "Design of an Advanced Ground Station for Simultaneous Control of Multiple Uavs in a Coordinated Mission," presented at the 24th Congr. Int. Coun. Aero. Sci., Yokohama, Japan, Aug. 29-Sep. 3, 2004.
[10] M. Jovanovic, D. Starcevic, "Software Architecture for Ground Control Station for Unmanned Aerial Vehicle," presented at the UKSim 10th Int. Conf. on Computer Modelling and Simulation, Cambridge, U.K., Apr. 1-3, 2008.
[11] D. Perez, I. Maza, F. Caballero, D. Scarlatti, E. Casado, A. Ollero, "A Ground Control Station for a Multi-UAV Surveillance System," J. of In-telligent & Robotic Systems, vol. 69, no. 1, pp. 119-130, Aug. 25, 2012.
[12] J. S. Ki, "Study on Developing a Flight Data Visualization," presented at the 2003 Spring Conf. on Korea Industrial and System Engineering, Ko-rea, 2003.
[13] H. Guo, J. Pang, Z. Shan, "Flight Data Visualization for Simulation & Evaluation a General Framework," presented at the 2012 Fifth Int. Symp. on Computational Intelligence and Design, Hangzhou, China, Oct. 28-29, 2012.
[14] C. Mitchell, W. Gekelman, "Real-time Physics Data-visualization Sys-tem Using Performer," Computers in Physics, vol. 12, no. 4, pp. 371-379, 1998.
[15] M. C. Park, H. G. Shin, Y. H. Moon, S. W. Ha, "Open-Source-based Visualization of Flight Waypoint Tracking Using Flight Manipulation System," Int. J. of Computer Graphics, vol. 2, no. 2, pp. 1-10, Nov, 2011.
[16] A.H. Neil, "The Evolution of Flight Data Analysis," presented at the ANZSASI Conf., 2007. [online]. Available: http://asasi.org/papers/2007/The_Evolution_of_Flight_Data_Analysis_N eil_Campbell.pdf. Accessed on: Mar. 15, 2015.
[17] L-3 Telemetry West Inc., "VISTA Prospector Post-Test Data Mining & Analysis," Available: http://www.storm.com/products/r_sw.htm. Ac-cessed: Apr. 26, 2015.
[18] Secretariat, Range Commanders Council, White Sands Missile Range, New Mexico, 88002, "Document 106-15," Available: http://www.irig106.org/docs/106-15. Accessed: Aug. 13, 2015. [19] S. H. Jung, "SCADE and Safety-critical Development," presented at the
2011 Spring Conf. of The Korean Society for Railway, Korea, May. 26-28, 2011.
[20] R. Vincent, "SCADE Display for the Design of Airborne and Ground-Based Radar HMIs," Mistral Solutions Newsletters, vol. 11, no. 4, Jan,
2014. [online]. Available:
http://www.mistralsolutions.com/newsletter/Jan14/Paper-SCADE-Display_Esterel.pdf. Accessed on: July. 4, 2015.
[21] I. S. Shin, M. Beirami, S. J. Cho, Y. H. Yu, "Development of 3D Terrain visualization for Navigation Simulation using a Unity 3D Development Tool," Korean Society of Marine Engineers, vol. 39, no. 5, pp. 570-585, June, 2015.
[22] M. J. Lee, "A Study on Game Production Education Through Recent Trend Analysis of 3D Game Engine," J. of the Korea Convergence Soci-ety, vol. 4, no. 1, pp. 15-20, Mar, 2013.