Volume 7, Issue 8 [August 2018] PP: 01-14
Investigation of Pedestrian Safety - A Case Study
Getu Tamiru
1, Palani Ponnurangam
2*, Gemechu Yilikal Mose
3123
Department of Civil Engineering, College of Engineering and Technology, Mizan Tepi University, Tepi, Ethiopia
*Corresponding Author: [email protected]
ABSTRACT: The needs of the pedestrian should be considered in the design of the urban environment and transportation facilities. Since road infrastructure improvements and designed pedestrian environments are an important part of road safety enhancements that increase walking and decrease fatalities. This study was investigated the pedestrian safety problems and its countermeasures on road segments in Mizan city. This study investigated the existing problems affecting the safety of pedestrian movement, evaluates the service quality of walking facilities, and finally identified the most significant factors affecting pedestrian safety with engineering counter measures in the city. Four routes are selected based on different criteria. Those are Market area, Commercial area, Educational area, and Residential area. The primary and secondary data is used in this study. For the data analysis the study used both objective measurements and subjective assessments to model PLOS using Australian methods. As per field study indicates 60% of the respondents think the sidewalk is not user-friendly. The current sidewalk is encroached either by vendors, utility poles, parking carts or illegal construction materials in different places, and crosswalk facilities are not visible and not enough provided at a logical distant. As a result pedestrians are forced to walk on the carriageway due to these illegal obstructions. The Pedestrian LOS analysis indicates that poor pedestrian conditions exist and the factors that negatively affect pedestrian LOS are wide-ranging. Pedestrian comfort is minimal, and safety concerns within the pedestrian environment are evident in this city road segments. It was concluded that, the most significant factors affecting the pedestrian safety in the city are sidewalk surface quality/continuity, sidewalk environmental problems, crossing opportunity (crosswalk), supporting facility, personal security, sidewalk obstructions, and sidewalk widths. Pedestrian facilities and all the concerned factors should be well provided and maintained to more effective for both encouraging people to walk and improve pedestrian safety.
Key words: Pedestrian facility, Pedestrian Level of Service, Pedestrian safety, Pedestrian problems
---
Date of Submission: xx-01-2019 Date of acceptance: xx-xx-xxxx
--- ---
I. INTRODUCTION
Walking has been a traditional mode of movement between places, irrespective of towns and cities. People walk with different purposes and in large numbers especially in developing countries. A pedestrian-friendly environment plays an important role in encouraging walking as a mode of travel, and this will prove health and environmental benefits(Martin, 2006).
Improved pedestrian facilities enable greater access and mobility within the communities. This research was considered the various factors that influence people's willingness to walk, such as the sidewalk quality problems and obstructions, and other contributing safety issues in the area of a walkway. This research also investigated on pedestrians' perception of their environment and the expectations they have of pedestrian facilities and sought to identify the benefits that can result from improved pedestrian facilities. In situations where sidewalk facilities are either encroached or occupied by vendors and hawkers or are poorly maintained, the pedestrians are forced to walk on a portion of the carriageway or shoulders. Parking of vehicles in this area further pushes the pedestrians onto the lane, thus increasing their interaction with vehicles, and therefore their risk(Americans with Disability Act (ADA), 1990).
At present no proper methodology is available to evaluate Pedestrian Level of Service (PLOS) provided by urban streets in Ethiopia. Defining PLOS criteria is a module of a level of service analysis procedure for urban streets. As the pedestrian level of service is not well established for highly heterogeneous traffic flow condition on urban of Ethiopia, attention has given in this regard to defining one of the pedestrian levels of service criteria in this study(Asadi-Shekari, 2014).
II. RESEARCH QUESTIONS
1. What are the existing conditions of pedestrian walking facilities? 2. What are the pedestrian facilities problems on road segments? 3. What are the most significant factors affecting pedestrian safety? 4. What are the remedial measures of the problem?
III. STUDY AREA
The study area is found in south region which is located around 600 Km from Addis Ababa, Ethiopia. The average geographical location of the study area is 9°5'N latitude, 36°33'E longitudinal and 2088 m elevation. The total population of the study area is around 117,077. Source: Mizan city administration office.
IV. RESEARCH DESIGN
The methodology conducted in this study is statistical analysis; the data was used to show the present pedestrian level of services of the road segments in Mizan. The collection of data includes both quantitative and qualitative data. The subjective assessment is done by pedestrians’ perception over their safety whether the facility is environmentally friend or not which is collected by questionnaire. The objective measurement is implemented using pedestrian level of service to show the extent of the problems in qualitative aspect. The PLOS which is a qualitative measure is chosen as an overall approach to its ability to incorporate different methods and techniques in the collection and analysis of data that focuses on the various issues of the study.
SAMPLE SIZE AND SELECTION
In this study, the method of sampling to select the area used purposive sampling technique, and the selection will be based on their purpose. To represent sample size of the population; if it is more than 10,000 the precise magnitude is not likely to be very important, but if the population is less than 10,000 then a smaller sample size may be required. The required sample size was determined by using single population proportion formula by considering 50% estimated proportion of pedestrian safety problems because there is no such study conducted in the area before.
The sample size is calculated by
SS =Z2∗P∗ 1−P
C2 ……….………..Equation.1
Where; SS = Sample size
P = Proportion or percentage of population picking a choice, expressed as a decimal(50%=0.5) Z = degree of confidence (e.g., 1.96 for a 95 percent confidence level)
C = degree of precision/confidence interval, expressed as decimal (e.g., 0.05 = +/- 5 Percentage points) SS = (1.96)2*0.5*(1-0.5) / (0.05)2= 384
Taking 5% non-response rate = 5% of 384 becomes 19. Adding to the previous one it becomes 403 (pertinent sample size).
DATA SOURCE AND COLLECTION PROCESS
For this study, the primary and secondary data is used. The primary data was collected from the site using questionnaire, field investigation (roadway characteristics on the actual field observations) like quality and width measurement, and pedestrian count (volume) data. The secondary data was collected from Mizan city municipality and Police officers like standard master plan and accident data.
DATA PROCESSING AND ANALYSIS
After data was collected, the analysis and interpretations were done sequentially/accordingly. For data analysis, the collected data from users’ perception of the primary factors are evaluated using subjective assessment, and the objective measurements are processed using Australian PLOS calculation method, Excel, and some related tools, thus the organized data interpreted using descriptive methods in the form of tables, charts, and graphs.
V. RESULTS AND DISCUSSION
pedestrian volume.
Table(1). Details of Existing conditions of the Sidewalk at Mizan
Study Area
Conditions of Sidewalk Continuity of
sidewalks Illegal Occupancy Remark
Market Area Non-continuous Vendors, building portions and
parking Cart Almost no curb ramps
provided and uncovered or opened manholes at different locations present
Commercial Area Non-continuous Vendors, building portions and
parking Cart
Educational Area Almost continuous Almost None
Residential Area Almost continuous Parking lot and building portions
Table(2). Pedestrian Volume Study and Details of the Sidewalk at Mizan
Study Area
Sub-criteria
Pedestrian count (peak/day)
Existing walkway width (m)
Master plan walkway
width
Standard walkway width/from
ADA/
Remark
Market Area 1876 1.90 2.5 3.0
It doesn’t satisfy the master plan and standards It needs upgrading
Commercial
Area 1765 1.40 2.5 3.0
It doesn’t satisfy the master plan and standards It needs upgrading
Educational
Area 2,117 2.40 2.5 3.0
Almost it is enough to satisfy the master plan Residential
Area 1,246 2.10 2.5 3.0
Almost it is enough but needs to upgrade
Fig. 1 Comparison of Existing, Master Plan and Standard Walkway Width
0 0.5 1 1.5 2 2.5 3
Market Area Commercial Area Educational Area Residential Area
Fig. 2 Pedestrian Accident Severity in Mizan city (2011 - 2016)
Fig. 3 Pedestrian Accident Trends in Mizan city (2011 - 2016)
Fig. Error! No text of specified style in document. Pedestrian Behavior and Casualty Location in Mizan city
(2011-2016)
2011 2012 2013 2014 2015 2016 Total
accident
Fatal 12% 11% 15% 20% 22% 28% 18%
Hospitalized 23% 15% 7% 9% 19% 17% 15%
Non-hospitalized 65% 74% 78% 71% 59% 55% 67%
0% 10% 20% 30% 40% 50% 60% 70% 80% 90%
26 34 27 45 36 42
210
0 30 60 90 120 150 180 210
2011 2012 2013 2014 2015 2016 2011-2016
A
cc
id
en
ts
(
No
)
Year
2011 2012 2013 2014 2015 2016
2011-2016
Crossing road 61.3% 35.3% 78.6% 50.0% 50.0% 52.9% 61.1%
Walking along road 18.8% 17.6% 7.1% 22.2% 11.1% 14.7% 12.1%
Walking along edge 12.6% 11.8% 7.2% 5.6% 22.2% 11.8% 9.8%
Others 7.3% 35.3% 7.1% 22.2% 16.7% 20.6% 17.0%
Fig. 5 Pedestrians Purpose of Walking in Mizan City (source: Field survey)
Table(2). Pedestrians’ view about the user friendliness of sidewalks
Location
Sidewalks are user-friendly
Yes (%) No (%)
Market Area 12 88
Commercial Area 34 66
Educational Area 58 42
Residential Area 54 46
Total respondents 40% 60%
Table(3). Pedestrians’ preference for using the sidewalk
Location
Pedestrians’ Preference for Using the Sidewalks
Yes (%) No (%)
Market Area 8 92
Commercial Area 48 52
Educational Area 83 17
Residential Area 90 10
Total respondents 57 43
0 20 40 60 80 100
Market Area Commercial Area Educational Area Residential Area
Shopping
Fig. 6 Reasons for not preferring the sidewalk
Table(4). Pedestrians’ feeling about the sidewalk environment
Location
Pedestrians feeling about the sidewalk environment (%)
Result
Very Bad Bad Good Very good Excellent
Market Area 34 29 25 8 4 Unpleasant
Commercial Area 14 30 22 18 16 Poor
Educational Area 9 12 36 21 22 Acceptable
Residential Area 10 34 22 14 20 Poor
Table(5). Pedestrians’ perception on assessment of effective measurement of pedestrian walking facilities
Extent of requirements for effective measurement of pedestrian walking facilities
User’s perception
Geometric, location and user factors
1 2 3 4 5 6 7
(%) 78.7 97.6 63.8 81.6 42.3 43.2 86.5
1 = Enhancing the width of the sidewalk 5 = Providing support facilities
2 = Improving the surface quality 6 = Improving sidewalk environment
3 = Removal of street hawkers/obstructions 7 = Improving personal security/lighting
4 = Providing cross-walks
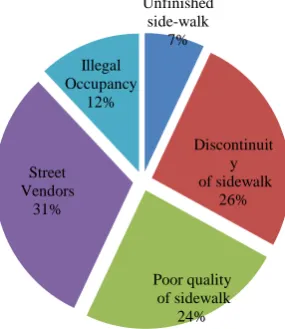
Unfinished side-walk
7%
Discontinuit y of sidewalk
26%
Poor quality of sidewalk
24% Street
Vendors 31%
Illegal Occupancy
Table(6). Objective and subjective results investigated for each factors affecting PLOS in Mizan city (Gallin’s Method) S N Geometric, Location and User Factors
Locations (measurement/current value)
Market Area Commercial Area Educational Area Residential Area
1 Average sidewalk
Width (m) 1.90 1.40 2.40 2.10
2 Average Surface
Quality Poor quality; Non-continuous, some opened manholes and drainage pipes, fixed objects Poor quality; Non-continuous, some opened manholes and drainage pipes, fixed objects Moderate quality i.e., almost continuous, some
opened drains/ fixed objects, etc.
Moderate quality i.e., almost continuous, some
opened drains/ fixed objects, etc.
3
Number of Obstructions (per
Km)
11 (Utility Poles, illegal construction materials) and full of Vendors
5 (Utility Poles, illegal construction materials) and some vendors at
evening
8 (Illegal construction materials and some
of the utility Vendors)
3 (Utility Poles and illegal construction material) 4 Crossing Opportunities None provided no crossing facilities which
is risk to cross
Some provided but poorly located
Some provided but poorly located
Some provided but, not enough
5 Support Facilities Non-existent Non-existent Non-existent Non-existent
6 Connectivity of
roads Good Good Good Good
7 Sidewalk Environment Unpleasant environment, close to vehicular traffic
and with a bad odor from vendor wastes
Poor environment, closer to vehicular
traffic and shopping homes
Acceptable environment, No closer to vehicular traffic
Poor environment, close to vehicular traffic with bad
odor from homeless road side
living wastes
8 Potential for
vehicle conflict
Nine conflict points, i.e., 1-three leg junction
on the path segments (both side of the road)
Eighteen conflict points, i.e., 2-three leg junction
on the path segments (both side of the road)
Eighteen conflict points, i.e., 2-three leg junction on the
path segments (both side of the
road)
Nine conflict points, i.e., 1-three leg junction on the
path segments (both side of the
road) 9 Pedestrian Volume Assumed 1876 per day Assumed 1765 per day
Assumed 2,117 per day
Assumed 1,246 per day
10 Mix of path Users
Mostly pedestrians, assume approximately 80% Mostly pedestrians, assume approximately 80% Mostly pedestrians, assume approximately 80% Mostly pedestrians, assume approximately 80%
11 Personal Security
Unsafe, limited street light and poor inadequate
security
Poor, limited street light and poor inadequate
security
Good, but needs maintenance street
light and work on security
Unsafe, limited street light and poor inadequate
Table(7). Pedestrian LOS Grade Scale (Gallin, 2001)
LOS Grade Range of Scores
A 132 or higher
B 101 to 131
C 69 to 100
D 37 to 68
E 36 or lower
Table(8). Pedestrian Rating and criteria of the PLOS factors in Market area road segment, between Mizan Red Cross society and Mizan Hospital
SN
Geometric, Location and User Factors
Measurement/value Weight Scor
e
Weighted Score
Ranking Affecting
Factors
1 Average sidewalk
Width (m) 1.90 4 3 12 5
2 Average Surface
Quality Poor quality 5 1 5 3
3
Number of Obstructions
(Per Km)
Full of Vendors, utility Poles,
illegal construction materials 3 0 0 1
4 Crossing
Opportunities
None provided, no crossing
facilities which is risk to cross 4 0 0 1
5 Support Facilities Non-existent 2 0 0 1
6 Connectivity of roads Good 4 3 12 5
7 Sidewalk
Environment
Unpleasant environment, close to vehicular traffic and with a bad odor from vendor
wastes
2 0 0 1
8 Potential for vehicle conflict
Reasonable, nine conflict points, i.e., 1-three leg junction on the path segments
(both side of the road)
3 3 9 4
9 Pedestrian Volume Assumed 1876 per day 3 0 0 1
10 Mix of path Users Mostly pedestrians, assume
approximately more than 80% 4 3 12 5
11 Personal Security Unsafe, limited street light
and poor inadequate security 4 0 0 1
Total Weighted Score 50
LOS result D
Table(9). Rating and criteria of the PLOS factors in Commercial area road segment, between Mizan Auditorium and Anwar Mosque
S N
Geometric, Location and
User Factors
Measurement/value Weight Score Weighted
Score
Ranking Affectin g Factors
1 Average sidewalk
Width(m) 1.40 4 2 8 7
2 Average Surface
3
Number of Obstructions
(Per Km)
5 (Utility Poles, illegal construction materials) and some
vendors at evening
3 2 6 6
4 Crossing
Opportunities
Some provided, but poorly
located 4 1 4 4
5 Support Facilities Non-existent 2 0 0 1
6 Connectivity of
roads Good 4 3 12 8
7 Sidewalk
Environment
Poor environment, closer to vehicular traffic and shopping
homes
2 1 2 2
8 Potential for vehicle conflict
Poor, 18 conflict points i.e. 2-three leg junction on the path segments (both side of the road)
3 1 3 3
9 Pedestrian Volume Assumed 1765 per day 3 0 0 1
10 Mix of path Users Mostly pedestrians, assume
Approximately more than 80% 4 3 12 8
11 Personal Security Poor, limited street light and poor
inadequate security 4 2 8 7
Total Weighted Score 60
LOS result D
Table(10). Rating and criteria of the PLOS factors in Educational area road segment, between Mizan round about and Mizan University
SN
Geometric, Location and User
Factors
Measurement/value Weight Score Weighte
d Score
Ranking Affecting
Factors
1 Average sidewalk
Width(m) 2.40 4 4 16 9
2 Average Surface
Quality Moderate quality 5 2 10 7
3
Number of Obstructions (Per Km)
8 (Illegal construction materials
and some of utility Vendors) 3 3 9 6
4 Crossing
Opportunities
Some provided, but poorly
located 4 1 4 3
5 Support Facilities Non-existent 2 0 0 1
6 Connectivity of roads Good 4 3 12 8
7 Sidewalk
Environment
Acceptable environment,
No closer to vehicular traffic 2 2 4 3
8 Potential for vehicle conflict
Poor, 18 conflict points i.e. 2-three leg junction on the path
segments (both side of the road) 3 1 3 2
9 Pedestrian Volume Assumed 2,117 per day 3 0 0 1
10 Mix of path Users Mostly pedestrians, assume
Approximately more than 80% 4 3 12 8
11 Personal Security
Reasonable, but needs maintenance street light and
work on security
4 2 8 5
Total Weighted Score 78
Table(11). Rating and criteria of the PLOS factors in Residential area road segment, between Mizan Museum and Mizan Stadium
SN
Geometric, Location and User Factors
Measurement/value Weight Score Weighted
Score
Ranking Affecting
Factors
1
Average sidewalk Width(m)
2.10 4 4 16 8
2 Average Surface
Quality Moderate quality 5 2 10 6
3
Number of Obstructions (Per Km)
3 (Utility Poles and illegal
construction material) 3 3 9 5
4 Crossing
Opportunities Some provided but, not enough 4 2 8 4
5 Support
Facilities Non-existent 2 0 0 1
6 Connectivity of
roads Good 4 3 12 7
7 Sidewalk
Environment
Poor environment, close to vehicular traffic and with bad odor
from homeless road side living wastes
2 1 2 2
8 Potential for
vehicle conflict
Reasonable, nine conflict points, i.e., 1-three leg junction on the path segments (both side of the
road)
3 3 9 4
9 Pedestrian
Volume Assumed 1,246 per day 3 0 0 1
10 Mix of path
Users
Mostly pedestrians, assume
Approximately more than 80% 4 3 12 7
11 Personal
Security
Unsafe, limited street light and
poor inadequate security 4 1 4 3
Total Weighted Score 82
LOS result C
VI. CONCLUSION AND RECOMMENDATIONS
CONCLUSION
Nowadays, in the development of one's country, both urban economic activities and safe movements of peoples and goods are measured through its basic transport system. For safety and comfort purposes, pedestrians need facilities that are safe, attractive, convenient, and easy to use especially appropriate walking facilities in any city. Poor design of pedestrian facilities can lead to perpetual problems and can discourage use if pedestrians are made to feel unsafe, unprotected, or uncomfortable. So, the needs of the pedestrian should be considered in the design of urban environment and transportation facilities.
The users’ perception revealed that 60% think the sidewalk is not user friendly. The sidewalk quality and continuity of the facility is very important for the pedestrian with disability and of old age. Since the walkways in Mizan city, in general, have almost the same problems like non-continuous, crack, and non-covered manholes which is difficult especially for pedestrians with disabilities and also risky at night time for all the users. Frequent ups and downs make the footpath uncomfortable to use and force the pedestrian to share the carriageway along with the vehicles. Since, the reason behind not preferring the walkway indicates that street vendors, discontinuity of sidewalk and surface quality are affecting the pedestrian safety.
In Mizan city the study observes, almost more than half, feel threatened at night due to inadequate security. As on the areas observed the lighting facilities are available in the night time while walking on the walkways. Unfortunately, most of them are not working properly due to lack of proper maintenance at a regular interval. In the four studied routes, most of the case there is no lighting opportunities on both sides, and this leads presence of the illegal pick pocketing and the snatch bags.
This research is tried to aware the transportation planners and nearby authorities on the existing problems related to the safety of pedestrians in Mizan city. Hopefully, this study contributes much in enhancing the safety of pedestrians by identifying the affecting factors studied through the investigation of existing problems in the areas of pedestrians and indicated that improving the road infrastructure can increase walking and decrease fatalities in the city. Pedestrian facilities such as sidewalks, crosswalks, Curb ramps and the like should be well designed and maintained to be effective for both encouraging people to walk and improve pedestrian safety along certain routes.
Finally, a model for the assignment of an LOS grade to the road segments was developed based on identified factors, liaison with Stakeholders and a best practice review of available literature. Therefore, based on this method the study was identified the most significant factors affecting pedestrian safety in Mizan city. Among the identified safety factors mainly sidewalk environment, crossing opportunity, support facility, personal security, obstructions, surface quality, and sidewalk width indicates the most affecting factors that need consideration for necessary improvements to make a more pedestrian friendly environment for each segment in the City.
RECOMMENDATIONS
Good design and construction of a pedestrian facility is an important factor in incorporating pedestrians into Mizan transportation system, but it can't be expected to solve all pedestrian related problems. Therefore, education and enforcement are other important tools that heighten awareness of pedestrians.
The concerned government offices for transport infrastructure have to work together to enhance the pedestrian safety in the city.
The qualities of sidewalk at all studied sites are poor with almost the same problems such as non-continuous and non-covered manholes which are difficult especially for pedestrians with disabilities. It is economical that covering the manholes and ditches with the nearby covers available on the place.
Sidewalk environment is affected by the urban noise pollution due to different waste materials in the side drainage ditches in market area. The study identified from the respondents that this markets should be changed to other places to minimize the environmental problems in the segments.
In Mizan city, the current sidewalk is fully encroached either by vendors, utility poles, parking carts or illegal construction materials in different places. It is possible to remove idle utility poles placed on sidewalk, and enforce street shopping, cart drivers and neighbor stores not to sell or place some goods on the sidewalks.
Additionally, to improve safety and minimize accidents educating the peoples on the safety benefits of zebra/designated crosswalk use and a review of crosswalk operations can enhance the safety of pedestrians in Mizan city municipality.
Researches on pedestrian safety must be conducted in the city to improve the comfort of pedestrians on sidewalk facilities and to minimize the accident risks in related to road users in future works.
REFRENCES
[1]. American Association of State Highway and Transportation Officials [2004], “A Policy on Geometric Design of highways and Streets”, Washington, D.C.
[2]. Americans with Disability Act [1990] “Accessibility guidelines for buildings and transportation facilities, etc”, Architectural and Transportation Barriers Compliance Board, Washington, D.C.
[3]. Asadi-shekari, et.al [2014] “A Pedestrian level of service method for evaluating and promoting walking facilities on campus streets”, Land use policy, Vol. 38: pp.175–193.
[4]. Atsbeha G. [2014] “Addis Ababa Road Traffic Accident Study and Possible Engineering Solutions: Case Study of Akaki-Kaliti Sub City Roads” AAU Published a journal.
[5]. Byrd J.et.al [2006] “Comparison of Level of Service Methodologies for Pedestrian Sidewalks” Presented at the Transportation Research Board Annual Meeting, Washington, DC.
[6]. Dandan, et.al [2007] “Research on Methods of Assessing Pedestrian Level of Service for Sidewalk”, Journal of Transportation Systems Engineering and Information Technology, Vol. 7: pp.74–79.
[7]. Farzana R, et.al. [2015] “Road User’s Perception about the Sidewalk Condition of Dhaka City: 2nd International conference on Innovative Engineering Technologies (ICIET'2015)”, Bangkok Thailand.
[8]. E commission of Ethiopia [2013] “Traffic accident report”, Addis Ababa.
[9]. FHWA. [2002] “Pedestrian facilities Users Guide - Providing safety and mobility” U.S. Department of Transportation (Americans with Disability Act (ADA), 1990, Gallin, 2001) report. Publication No. FHWA-RD-01-102.
[10]. FHWA [2004] “A Review of Pedestrian Safety Research in the United States and Abroad” U.S. Department of Transport. Publication No. FHWA-RD-03- 042.
[11]. Gallin N [2001] “Quantifying Pedestrian Friendliness - Guidelines for Assessing Pedestrian Level of Service in Australia”, Perth, Western Australia.