by
Kaitlyn M. Pederson
A thesis
submitted in partial fulfillment of the requirements for the degree of
Master of Arts in Criminal Justice Boise State University
DEFENSE COMMITTEE AND FINAL READING APPROVALS
of the thesis submitted by
Kaitlyn M. Pederson
Thesis Title: Delinquency Predictors: Offending to Commitment Date of Final Oral Examination: 20 June 2018
The following individuals read and discussed the thesis submitted by student Kaitlyn M. Pederson, and they evaluated her presentation and response to questions during the final oral examination. They found that the student passed the final oral examination.
Lisa G. Bostaph, Ph.D. Chair, Supervisory Committee Laura King, Ph.D. Member, Supervisory Committee Shaun M. Gann, Ph.D. Member, Supervisory Committee
iv
ACKNOWLEDGEMENTS
v ABSTRACT
vi
TABLE OF CONTENTS
ACKNOWLEDGEMENTS ... iv
ABSTRACT ... v
LIST OF TABLES ... viii
LIST OF ABBREVIATIONS ... ix
CHAPTER ONE: INTRODUCTION ... 1
CHAPTER TWO: LITERATURE REVIEW ... 4
Juvenile Offending ... 4
Predictive Variables of Juvenile Offending ... 5
Substance Use and Mental Health ... 16
Juvenile Court ... 18
Juvenile Judicial Decisions... 21
CHAPTER THREE: METHODS ... 28
Dependent Variable... 29
Independent Variables ... 31
Original Model Variables ... 31
Additional Variables ... 32
Statistical Analyses ... 34
CHAPTER FOUR: RESULTS ... 35
vii
Hypothesis Model ... 37
Binary Logistic Regression Series ... 38
Final Binary Logistic Regression Model ... 41
CHAPTER FIVE: DISCUSSION ... 44
Limitations ... 45
Policy Implications ... 46
Future Research ... 47
REFERENCES ... 48
APPENDIX A ... 54
viii
LIST OF TABLES
Table 1.1 Sample Descriptives ... 36
Table 1.2 Binary Logistic Regression: Hypothesis Model ... 38
Table 1.3 Binary Logistic Regression: Model 1 ... 39
Table 1.4 Binary Logistic Regression: Model 2 ... 39
Table 1.5 Binary Logistic Regression: Model 3 ... 40
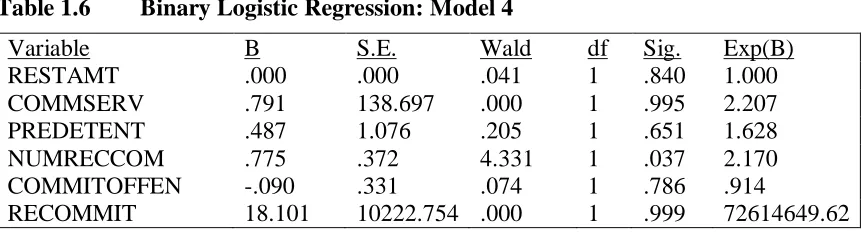
Table 1.6 Binary Logistic Regression: Model 4 ... 41
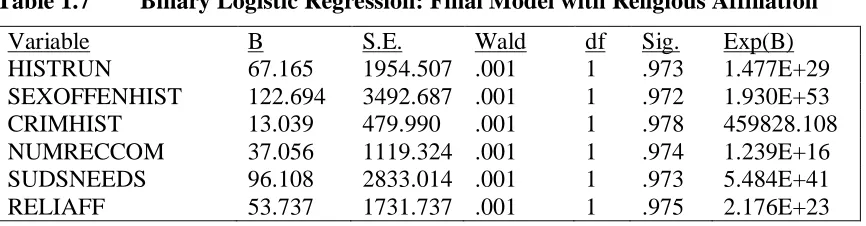
Table 1.7 Binary Logistic Regression: Final Model with Religious Affiliation ... 42
ix
LIST OF ABBREVIATIONS ATOD Alcohol, Tobacco, and Other Drugs IDCJ Idaho Department of Juvenile Corrections I.J.R. 19 Idaho Juvenile Rule-19
JFP Juvenile Forensic Profile
ProDES The Program Development and Evaluation System
CHAPTER ONE: INTRODUCTION
In 2010, United States law enforcement made over 1.6 million arrests of juveniles under 18 years of age (Sickmund & Puzzanchera, 2014). Of those 1.6 million cases, the juvenile court handled 1.4 million, which is equivalent to 3,700 delinquency cases a day (Sickmund & Puzzanchera, 2014). With thousands of juveniles filtered through court daily, judges are left to make decisions regarding juveniles’ sentence. The court may decide to divert the juvenile away from the formal justice system or the case may be adjudicated, therefore resulting in other outcomes. Typically, when the juvenile is high-risk, the court orders the juvenile to be placed in a residential placement facility. Judges, therefore, have to determine what makes a juvenile high-risk (Hockenberry &
Puzzanchera, 2017; Idaho Department of Juvenile Corrections, 2017).
screening, which serves to assist the judge in determining if an adolescent should get sent to a state facility (Idaho Department of Juvenile Corrections, 2017).
In 2015, the state of Idaho handled 9,264 juvenile arrests (Harrigfeld, 2017). Out of the juveniles arrested, 5,801 were booked into a county detention facility. This same year, there were approximately 5,147 additional youth under probation. In 2016, 5,010 juveniles served time in their communities with IDJC state and federal funds.
Furthermore, 433 juveniles served time at the IDJC state facility, with an average daily count of 266 (Harrigfeld, 2017).
The present study is important because, although predictive variables of juvenile offending have been empirically examined, the predictive variables of juvenile court sentencing have been ignored. Thus far, research focusing on juvenile sentencing decisions has been limited due to: obtaining data from official records, restricting focus on demographic characteristics, and presenting results based on perceptual data.
Additionally, research on high risk juvenile offenders has been minimal. Another reason this research is important is because the IDJC not only funds treatment in their state correctional facilities, but they are also responsible for distributing funding to the seven county districts (Idaho Department of Juvenile Corrections, 2017). Therefore, identifying variables associated with juvenile state commitment can help establish areas of focus for funding.
CHAPTER TWO: LITERATURE REVIEW
Juvenile Offending
In 2010, the U.S. population of juveniles ages 10-17 was 33,599,246 (Sickmund & Puzzanchera, 2014). The estimated number of juvenile arrests in that same year was 1,642,500.Most juveniles arrested are 16 and 17 year olds, accounting for three-fourths (73%) of the 1.6 million arrests occurring in 2010. Furthermore, the Juvenile Offenders and Victims: 2014 National Report revealed that the number of young juveniles in the system had decreased. More specifically, there was a 38% decrease, between the years of 1980-2010, in total arrests for juveniles under the age of 13 years. Although, when this statistic is examined by sex, there was a 46% decrease in juvenile male offenders, but females inversely had a 3% increase (Sickmund & Puzzanchera, 2014).
When specifically examining violent crimes, which include murder/non-negligent manslaughter, forcible rape, robbery, and aggravated assault, the gap between male and female juveniles has diminished (Sickmund & Puzzanchera, 2014). In 1980, male violent arrest rates were eight times greater than female offenders. In 2010, this difference decreased to just four times greater. A similar reduction in the arrest rate gender gap occurred for property crimes (burglary, larceny-theft, motor vehicle theft, and arson). When reviewing arrest rates as a whole, female adolescents still only committed 29% of all crime (Sickmund & Puzzanchera, 2014).
race, accounting for 66% of total arrests, while Blacks comprised 31%, American Indians 1%, and Asians 1% of arrests (Sickmund & Puzzanchera, 2014). However, Black
juveniles were involved in some offenses substantially more often than Whites. For example, Black youth were arrested in 67% of robberies, 56% of murders, 42% of motor vehicle thefts, and 41% of aggravated assaults. Although these rates seem naturally inflated, the disparity is noteworthy considering Black juveniles only accounted for 17% of the juvenile population in 2010. Building on the racial imbalance, when examining the UCR Violent Crime Index, Black adolescents had an arrest rate five times that of White adolescents, six times that of American Indian juveniles, and fifteen times the rate of Asian teenagers (Sickmund & Puzzanchera, 2014).
Predictive Variables of Juvenile Offending
Apart from demographic variables, research has evaluated various predictors of juvenile offending. The following section discusses these predictors including prior offending, age of first offense, educational factors, family factors, mental health, and substance use.
Prior Offenses
A juvenile’s offense history is one of the strongest predictors of future criminal
activity. Although the United States does not record national level statistics on juvenile
recidivism (Sickmund & Puzzanchera, 2014), an examination of 15,265 juveniles with a
mean age of 14.7 years revealed a recidivism rate of 48%, over a six month follow-up
period (Jung & Rawana, 1999). This recidivism rate displays high reoccurring offending
among juveniles. In an analysis by Herz, Ryan, and Bilchik (2010) using data collected
The largest effect variables presented in their study were prior detention status and prior
offense history. In this case, if a juvenile had been in detention previously, their odds of
re-offending increased by more than four times. Additionally, if an adolescent had a prior
offense record, their odds of a new offense increased by 2.8 times (Herz et al., 2010).
Moreover, a study conducted by Mulder, Brand, Bullens, and Marle (2011) examining
risk factors for juvenile recidivism found comparable results. In this analysis, 728 serious
juvenile offenders were assessed using the Juvenile Forensic Profile (JFP), which is an
instrument designed for risk assessment and measuring behavioral problems. This
research provided evidence that prior offense history was significant to recidivism; a high
number of past offenses predicted an overall risk for reoffending. Furthermore, an
increase in previous offending also was a significant risk factor for violent recidivism and
severity of recidivism (more risk and more serious new offenses) as well (Mulder et al.,
2011). Additional support was found in the Cottle, Lee, and Heilbrun (2001) analysis,
discussed in greater detail later, which found that a larger number of prior arrests and/or more previous commitments were associated with recidivism.
Age at First Offense
Aside from a juvenile’s past criminal record of future offending, age of first offense and/or commitment has also been shown to be a predictor of juvenile offending.
with those 16-17 years old accounting for the majority of arrests (73%) (Sickmund & Puzzanchera, 2014). Cottle et al. (2001) and Mulder et al. (2011) also included these variables in their analyses. Cottle and colleagues (2001) determined that juveniles with an
earlier age at first contact with law enforcement and/or an early age at first commitment
were both at an increased risk for recidivism. A young age at first offense is predictive of
not only recidivism, but also the severity of recidivism (more risk and more serious new
offenses) and of violent recidivism as well (Mulder et al., 2011). Two other studies
examined this association between age of first offense and/or commitment and juvenile
offending risk.
Myner, Santman, Cappelletty, and Perlmutter (1998) reviewed 138 males who
had been adjudicated for criminal conduct as juveniles. In this study, they analyzed
multiple variables and determined which were predictive of recidivism. Their analysis
found that the strongest predictor of recidivism was age at first offense. The younger the
juvenile was at the time of their first offense, the higher their likelihood of re-offending
(Myner, 1998). Katsiyannis and Archwamety (1997) discovered similar findings when
they compared 147 juvenile recidivists to 147 non-recidivists. Their conclusions resulted
in three predictors of recidivism, with the primary predictor, once again, being age at first
offense (Katsiyannis &Archwamety, 1997).
Educational Factors
In addition, educational factors also have shown to influence criminal
required special education was three to five times higher in juvenile corrections when compared to the public school population (Casey & Keilitz, 1990; Murphy, 1986). Not surprisingly, educational factors have consistently shown a significant relationship with juvenile delinquency. Juveniles involved in the system are typically between the ages of 12-18 years, an essential time for their education. Research has shown that factors such as academic deficiency, learning disabilities, and disciplinary problems may increase a juvenile’s likelihood of criminal involvement (Cottle et al., 2001; Cuellar& Markowitz, 2015; Glueck & Glueck, 1940; Hemphill, Toumbourou, Herrenkohl, McMorris,
&Catalano, 2006; Katsiyannis & Archwamety, 1997; Meltzer, Levine, Karniski, Palfrey,
& Clarke, 1984;Skiba, Reynold, Graham, Sheras, Conoley, & Garcia-Vazquez, 2006;Wang, Blomberg, & Li, 2005).
Academic Deficiency
Glueck and Glueck (1940), in their 10-year analysis of 1,000 male juvenile delinquents, found that the majority (85%) of offenders ranked lower in academic levels compared to their non-delinquent peers. This academic deficiency typically expands to encompass an array of educational skills. Meltzer et al (1984), in an examination of 53 delinquent adolescent learning profiles, observed, when compared to 51 average junior high school students, delinquents were inadequate in areas such as reading accuracy and comprehension rates, spelling, mathematics, and written expression. Educational
dysfunction in juvenile delinquents was identified in the early stages of school, even before the second grade. These educational difficulties however did become more
same reading deficiency. When comparing these measures to grades 6-9, there was an increase to 66% of delinquents exhibiting a reading delay and a decrease in the
comparison group of only 12% of students experiencing difficulties. Furthermore, these other educational factors revealed similar findings of an increase in deficiency prevalence (Meltzer et al., 1984). Not only has a relationship been revealed between juvenile
delinquency and a lack of education, but educational problems may go even deeper to include learning disabilities.
Learning Disabilities
As previously mentioned, Katsiyannis and Archwamety (1997) compared 147 recidivists to 147 non-recidivists committed to a state correctional facility and found that a factor separating recidivists from non-recidivists was a history of special education services. Similarly, a meta-analysis, conducted by Cottle et al. (2001) to identify
predictive factors for juvenile recidivism, uncovered a significant association between a history of special education and recidivism. This meta-analysis contained 23 published studies, which included a total of 15,265 juveniles in the sample. These findings reiterated the relationship between academic insufficiency and offending and also discovered that a low standardized achievement score was the 12th highest predictor of an individual recidivating. But, they also identified that low scores on the full scale IQ test and verbal IQ (e.g., comprehension, arithmetic, vocabulary, number sequencing) test were also predictive. However, a low score on the performance IQ (e.g., picture
Disciplinary Problems
School disciplinary problems may also predict an increase in offending
(Cuellar& Markowitz, 2015; Hemphill et al., 2006; Wang et al., 2005; Skiba et al., 2006). In a study conducted by Wang et al. (2005), school variable differences in delinquent students (N=5,187) were compared to a matched group of non-delinquent students (N=5,187). They measured disciplinary problems by the number of out-of-school suspensions and in-school suspensions. In-school suspensions are when a student is suspended from a school program for up to 10 days, while an out-of-school suspension is when an adolescent is temporarily removed from the school for up to 10 days. Findings of this study revealed that delinquent students were suspended from school considerably more often than non-delinquent students. When examining in-school suspensions, the results for one in-school suspension were 13% of the delinquents and 10.4% of non-delinquents falling in this category. Although, 14.5% of non-delinquents reported having more than three in-school suspensions, while only 7.8% of non-delinquents reported three or more in-school suspensions. Results were parallel when reviewing out-of-school suspensions with 18.2% of delinquents and 13.7% of non-delinquents reporting one out-of-school suspension and 18.9% of delinquents compared to only 8.4% of
non-delinquents reporting three or more out-of-school suspensions (Wang et al., 2005). Similarly, Hemphill and associates (2006) examined arrest effects on antisocial behavior, including school suspensions. In examining approximately 4,000 students, they revealed that school suspension was a predictor of subsequent antisocial behavior
were suspended out of school on days when school was in session were significantly more likely to engage in crime than students who were in school. Not only did school suspensions increase the juvenile’s probability of offending, it more than doubled the students’ likelihood of committing an offense (Cuellar & Markowitz, 2015).
The act of suspending a juvenile from school becomes a concern in developing the school to prison pipeline. This is the idea that, when we create zero tolerance policies in school and suspend adolescents from school, we are then pushing these kids out of classrooms and into the juvenile justice system (Cuellar& Markowitz, 2015). School suspension releases the juvenile out into the community with little to no supervision, diminishes the students’ connections with school, increases alienation, produces conflict with adults, and overall, increases a juvenile’s inclination to engage in criminal conduct (Skiba et al., 2006).
Family Factors
Aside from the educational factors discussed above, family factors have also been examined in their relations to juvenile delinquency. These family factors include
experiencing abuse and neglect, a juvenile’s living arrangements, and family criminality. History of Abuse and Neglect
Puzzanchera, 2014). Smith and Thornberry (1995) examined this relationship between
early childhood maltreatment and delinquency. In this analysis, seven types of
maltreatment were included in the conceptualization: physical abuse, sexual abuse,
emotional maltreatment, moral/legal maltreatment, educational maltreatment, physical
neglect, and lack of supervision. Data from the Rochester Youth Development Study, a
four-year interview inquiry, were reviewed on variables of maltreatment, official police
records, and self-report delinquency. When comparing maltreated and non-maltreated
individuals on their official juvenile records, they discovered that childhood maltreatment
significantly increased a juvenile’s likelihood of offending. Specifically, 45% of
maltreated participants had an arrest record while only 31.7% of non-maltreated juveniles
had a record. Additionally, they found that, not only were official arrest records
correlated with maltreatment, but self-reported offending was as well. Although, these
results differed in that maltreatment was related to more serious forms of self-reported
offending, while minor delinquency showed no significant relationship with childhood
maltreatment (Smith & Thornberry, 1995).
Furthermore, in the study presented earlier by Mulder and associates (2011)
examining static and dynamic risk factors for juvenile offenders, they discovered
additional evidence of the relationship between juvenile offending and maltreatment.
They identified that a history of physical abuse was a risk factor for more severe
recidivism (more risk and more serious offense). They also revealed a relationship
between a history of neglect and being at risk for violent recidivism (Mulder et al., 2011).
Similar results were established as well in Cottle et al.’s (2001) meta-analysis with results
Finally, in a previously conducted meta-analysis, Loeber and Stouthamer-Loeber (1986)
found that neglect had a strong relationship with delinquency, but a general factor of lack
of parental involvement alone also resulted in an increased risk for juvenile offending.
Living Arrangements
Additional family/social factors correlated with offending are living situations
such as single-parent home, out-of-home placement, and/or foster care. In the Cottle et al.
(2001) analysis, a significant association was discovered between growing up in a
single-parent home and recidivism. A significant relationship was also found between a juvenile
having a higher number of out-of-home placements and recidivism. In Myner et al.’s
study (1998), the relationship between a single-parent family and recidivism was not
significant, but group home placements were the third strongest correlate to recidivism in
this analysis. Furthermore, Barrett, Katsiyannis, Zhang, and Zhang (2014) established
that living in foster care increased the odds of delinquency (to be discussed in greater
detail later).
Family Criminality
In 2017, 52% of state adult inmates and 63% federal inmates had children (Glaze
& Maruschak, 2010). Combined, there are an estimated 1,706,600 children who have
parents behind bars (Glaze & Maruschak, 2010). The effect of family criminality on
juvenile offending has been studied for many years. One of the earliest studies conducted
on family offending was published by Ferguson (1952). This analysis was a
cross-sectional comparison of delinquent and non-delinquent juveniles. A sample of 1,329 boys
was measured on their criminal offending as well as their families. The findings revealed
who were involved in criminal activity themselves also increased. To enumerate, the
proportion of juveniles who had no other family members with convictions was only at
9%; with an increase to one family member with convictions, it became 15%, then 30%
with two members, and 44% with three or more family members with convictions
(Ferguson, 1952).
A more recent study examining data from the Pittsburgh Youth Survey reported
similar findings to Ferguson (1952). Farrington, Jolliffe, Loeber, Stouthamer-Loeber, and
Kalb (2001) used longitudinal data of 1,517 boys to examine the effects of family
criminal arrests on the juveniles’ own arrest histories. Overall, 44.4% of families
contained at least one arrested member. Out of the eight family member types (brothers,
sisters, fathers, mothers, uncles, aunts, grandfathers, and grandmothers) examined, all
showed to be significant predictors of the boys’ delinquency. Above all, the most
influential relative on a juvenile’s arrest, was their offending fathers’ arrest. Ultimately,
arrested persons were distinctly concentrated in families, and if one relative had been
arrested, the probability of another relative having also been arrested was high
(Farrington et al., 2001). Furthermore, not only did a history of family criminality
increase the likelihood of a juvenile offending, it has also been shown to be a risk factor
of violent recidivism in adolescent offenders (Mulder et al., 2011).
Generational Substance Use
In addition to research displaying the strong relationship between generational
offending and juvenile offending, substance use has also been revealed as
intergenerational (Adler & Lotecka, 1973; Beardslee, Son, & Vaillant, 1986; Craig &
McCubbin, Wilson, Reineck, Lazar, & Mederer, 1986; Tec, 1974). One study on the
relationship between parental substance use and adolescent drug use examined a sample
of 106 adolescent drug users and compared them to 96 non-drug using juveniles.
Juveniles, along with their own drug use history, were asked to describe their parents’
use. During the analysis, a significant relationship was revealed between adolescent drug
use and parents’ drug use. Adolescents who used drugs were more likely to have one or
more parents who also used drugs. Additionally, this examination found that parental
attitudes toward drug use were a significant contributor to juveniles’ substance use
(McDermott, 1984).
Aside from parental influence on an adolescent’s drug use, other family members
may have a similar or stronger influence. Needle and colleagues (1986) presented a
longitudinal study of 508 families with adolescents aged 11 to 13 years and their older
siblings (aged 14 to 18 years). Their examination of older siblings provided support for
the relationship between siblings and their substance use. In fact, through their analysis,
they concluded that, compared to siblings, parental drug use was found to have a minimal
effect and that siblings seemed to play a more important role in influencing adolescent
drug use. Similarly, in the Oregon Youth Study, a 10-year examination of 206 families,
two research questions were examined: to what extent was older siblings’ alcohol,
tobacco, and other drug (ATOD) use connected with their younger siblings’ ATOD use
and to what extent were individual, parent, sibling, and peer factors linked with
adolescents’ and young adults’ ATOD use (Needle et al., 1986). These findings reiterated
that there was a strong relationship between older siblings’ and younger siblings’
adolescent aged, but parents had a strong influence on their child’s substance use early on
in life (Kothari et al., 2014). Thus, family influence is a significant predictor of juvenile
substance use.
Substance Use and Mental Health Mental Health
The prevalence of mental health issues among adolescents in the juvenile justice
system is significantly higher than in the general juvenile population (Cauffman, 2004;
Colins, Vermerien, Vreugdenhil, van den Brink, Doreleijers, & Brokekaert, 2010;
Vermeiren, Jespers, & Moffitt, 2006; Wasserman, Jensen, Ko, Cocozza, Trupin, Angold,
Cauffman, & Grisso, 2003). In a screening of mental health prevalence among juvenile
offenders, Cauffman (2004) found that approximately 70% of males and 81% of females
exhibited at least one mental health disorder. Aside from mental health having a strong
presence among juvenile offenders, mental health problems have also been linked to
recidivism. In an analysis conducted in the South Carolina Department of Juvenile
Justice, 99,602 delinquent juveniles were matched to a control group and measured on
mental health. When examining recidivism, a juvenile with a mental health diagnosis was
almost twice as likely to commit a second offense, and, when the mental health diagnosis
was aggressive, the likelihood increased to three times over non-diagnosed juveniles
(Barrett et al., 2014). Additionally, Wibbelink, Hoeve, Stams, and Oort (2017) conducted
a meta-analysis of 17 studies (N=5,737) on mental health (internalizing and externalizing
disorders) and juvenile recidivism. There was a small to medium effect size for
externalized disorders, such as substance use disorders, attention deficit/hyperactivity
disorder. Comorbid disorders also had a small to medium effect size. On the other hand,
internalizing disorders (depression, anxiety, and posttraumatic stress disorder) alone had
no relationship with recidivism (Wibbelink et al., 2017).
Substance Use and Comorbidit
Aside from general mental health problems, substance use disorder (SUD) and
comorbidity are two of the most problematic disorders when it comes to the juvenile
justice system. Hoeve, McReynolds, Wasserman, and McMillian (2013) conducted a
study examining both mental health and SUD. Using a secondary data analysis of 700
juveniles from Alabama, Hoeve and colleagues evaluated the juveniles on psychiatric
disorders and offense characteristics. As a whole, approximately half of the sample
reported at least one psychiatric disorder. The analysis revealed that recidivists were
more likely to have a psychiatric disorder over non-recidivists. When the results were
examined further, participants with a SUD alone were more likely to commit a serious
offense in the future. Juveniles with a SUD, with or without a co-occurring disorder, were
at a greater risk to have a severe re-offense, making SUD possibly the most problematic
disorder (Hoeve et al., 2013). Furthermore, in Cottle and associates’ (2001)
meta-analysis, substance use alone did not predict recidivism, but substance abuse did,
meaning habitual illicit substance use increases risk of offending.
As shown above, research on juveniles and offending has been extensively
examined over the years, producing a variety of factors related to youth delinquency.
Beyond a juvenile’s arrest, if chosen to pursue, the adolescent then becomes involved in
Juvenile Court
Approximately two-thirds of all arrested juveniles ultimately get referred to court (Hockenberry & Puzzanchera, 2017). In 2010, there were 1,368,200 juvenile court cases; this total has decreased over the years with only 974,900 cases in 2014. Although in the last few years juvenile courts have seen fewer cases (-27%), delinquency caseloads have more than doubled since 1960. In total, more than 13 million teens were under juvenile court jurisdiction, according to the Juvenile Court Statistics of 2014 (Hockenberry & Puzzanchera, 2017).
Beyond the demographics of juvenile court cases, statistics of delinquency case processing have also been reported. Thus far, the statistics presented have been on referrals to juvenile court, but there are five other areas of case processing. First is
detention, which is defined as a secured facility that is used to detain a juvenile for safety and/or security. Overall, the use of detention decreased from 2005-2014 (Hockenberry & Puzzanchera, 2017). A juvenile was most commonly detained due to a person offense (33%), with property (28%) and public order (29%) not far behind; the final offense type, drugs, resulted in detention the least frequently at 9%. Furthermore, youth 16 years of age or older were more often detained (24% compared to 20%) as well as juvenile males (24% compared to 17%).White adolescents on the other hand were the least prevalent in detention (18%) compared to juveniles who were Black (25%), Hispanic (23%),
American Indian (26%), or Asian (24%) (Hockenberry & Puzzanchera, 2017).
The second decision point is intake, a formal processing of a particular case that involves filing petition requests for an adjudicatory or waiver hearing (Hockenberry & Puzzanchera, 2017). As a whole, cases were more often handled formally (56%) than informally. Additionally, the more serious the offense, the more commonly was a petition produced. For example, aggravated assault and forcible rape were formally handled 74% of the time while larceny theft and trespassing were only handled formally 45% of the time. Distributed across demographics, juveniles 16 years of age and older (59%), males (59%) and Black (62%) were the most frequent groups to undergo a formal sentence (Hockenberry & Puzzanchera, 2017).
waived, although overall, it was uncommon for a case to be waived (Hockenberry & Puzzanchera, 2017). Moreover, youth 16 years of age and older had more cases waived (1.4% compared to 0.1%) as well as those who were male (0.9% compared to 0.3% of females) and Black (1.0% compared to 0.6% White, 0.5% Hispanic, 0.7% American Indian, and 0.3% Asian) (Hockenberry & Puzzanchera, 2017).
Adjudication is the fourth area of case processing. An adjudicatory hearing determines if the adolescent did commit the offense(s) being charged (Hockenberry & Puzzanchera, 2017). Overall, 30% of all delinquency cases resulted in adjudication or a waiver. Furthermore, adjudication occurred over half of the time, regardless of age, with juveniles younger than 16 years old (53%) and juveniles 16 years of age and older (54%), 49% of the time for females, 55% for males, and American Indians were the highest ethnic or racial group at 65% (Hockenberry & Puzzanchera, 2017).
juveniles older than 16 years of age (60%). Furthermore, females (66%) and males (62%) were similar in probation dispositions as well. While most races ranged 61-66% for probation, Asians had the highest frequency at 72% (Hockenberry & Puzzanchera, 2017).
Juvenile Judicial Decisions
When it comes to predicting juvenile delinquency, research has extensively
examined predictor variables for juvenile offending and recidivism. It is important to
determine how these variables influence the discretion of juvenile justice personnel when
it comes to making judicial decisions pertaining to the juvenile. Empirical studies
focusing on factors related to juvenile court hearings are limited. Additionally, the ones
that have been conducted examined narrow factors, obtained data purely from official
records, were based on perception, and/or did not focus on severe juvenile offenders.
Most researchers examining such topics restricted their variables to sex, race/ethnicity,
and socioeconomic status (Arnold, 1971; Bishop & Frazier, 1995; Bishop, Leiber, &
Johnson, 2010; Leiber & Fox, 2005; Terry, 1967; Thornberry, 1973), undermining the
complex process of the juvenile court system, although some researchers have attempted
to capture the complexity of the system (Applegate, Turner, Sanborn, Latessa & Moon,
2000; Fader, Harris, Jones, & Poulin, 2006; Sanborn, 1996).
Sanborn (1996) examined factors that affected dispositions in the juvenile court.
He administered open-ended interviews to 100 workers from three juvenile courts.
Participants consisted of judges, attorneys, public defenders, probation officers, and
private attorneys. These individuals were asked which factors they believe should be
considered in a juvenile’s disposition. Overall, thirteen variables were cited as important
family (81%),
delinquent record (70%),
crime (63%),
school record (56%),
previous disposition (52%),
child’s character (39%),
treatment needs (33%),
parents’ characteristics (28%),
mental condition (23%),
age (22%),
system resources (17%),
drug/alcohol abuse (13%),
community resources (11%).
When examining what was actually considered in a juvenile’s disposition, the type of
crime and the delinquent’s criminal record were the top two factors for all three courts.
Court workers were also asked which factors/characteristics resulted in a harsh
dispositional outcome. The top five factors listed were: bad record (61%), serious/violent
offense (57%), bad/no school (35%), failed treatment (32%), and bad character (30%)
(Sanborn, 1996). Ultimately, this study allowed for an examination of a variety of factors
that may influence a juvenile’s disposition. Although it was limited to perceptions and
only contained 11 judges, this examination builds on the complexity of juvenile court
In 2000, Applegate and colleagues furthered research on judges’ decisions in
juvenile court by surveying 69 juvenile court judges on situational disposition decisions.
Vignette characteristics varied on felony degree, felony type, weapon involvement, harm,
loss, prior record, prior commitment, age, codefendants, school attendance, family
stability, parental cooperation, and local programming. Participants were simply asked to
read a vignette and then answer the following question, “based on this information, how
likely is it that you would commit this youth to a state facility?” Overall, judges’
decisions were significantly influenced by whether there was a weapon involved, the
offense was violent, and the youth had been previously institutionalized. If a case
contained all three of these factors, the juvenile would have a 79.6% chance of being sent
to a state facility. Additional factors influencing the judges’ decisions were legal
seriousness (felony), harm done to the victim, number of previous adjudications, and
prior felonies. Factors that showed no significance in the decision making process were
the juveniles’ school attendance, family stability, and/or whether the act was committed
alone. Ultimately, this study added to this body of research by focusing solely on judges’
perceptions, serious offenders and various influential factors (Applegate et al., 2000).
Thus far, these studies have focused on perceptual decisions in juvenile court, and
while they added in a few extra legal factors, they are still limited. In one study, Brown
and Sorensen (2014) examined secondary data obtained from the Harris County Juvenile
Probation Department in Texas. For this analysis, they looked at 376 dispositions
resulting in transfer to adult court, 237 cases of determinate sentencing, and compared
them to traditional indeterminate sentences (N=300). Samples were compared on legal
offense) and extra-legal (sex and race/ethnicity) variables. Significant factors of transfer
to adult court included were Black, Hispanic, male, committing a person offense or a first
degree/capital felony. Minorities were three times more likely to be transferred to adult
court when compared to White juveniles. Additionally, age also had a strong effect on
transfer to adult court with 15-year-olds less likely to get transferred than 16-year-olds,
and 14-year-olds were the least likely to experience this disposition. When examining
determinate sentences, type and severity of the crime also had a strong influence on this
disposition type. A felony offense resulted in an individual being 12 times more likely to
receive a determinate sentence compared to an indeterminate one. Correspondingly,
first-degree or capital felony crimes were nine times more likely to receive a determinate
sentence compared to an indeterminate sentence. On the other hand, age, race/ethnicity,
and sex did not increase the likelihood of determinate, compared to indeterminate,
sentencing.
Fader, Harris, Jones, and Poulin (2006) studied factors involved in juvenile court
in a different manner. For their analysis, they used a database maintained by the Crime
and Justice Research Institute in Philadelphia called ProDES (the Program Development
and Evaluation System) and examined predictors of out-of-home placement dispositions.
Fader and associates chose to limit their analysis to first-time offenders with no prior
program history (N=1,875). Additionally, five categories of variables were observed:
socio-demographics, family and child functioning, situational, and offense-specific. The
strongest predictor of out-of-home placement for first time offenders with no prior
placement was a history of drug abuse (including any alcohol and/or drug abuse history)
were the seriousness of the offense, history of family violence, mental health problems,
behavior since arrest, and history of alcohol abuse. This examination also included
predictors of prior offenders with no prior placement. For this group, behavior since
arrest, offense seriousness, history of drug abuse, and sibling history of arrest were all
significant predictors of out-of-home commitment (Fader et al., 2006).
Another analysis examining out-of-home placement dispositions was conducted
by Rodriguez and colleagues (2009). For this study, three data sources were included: the
Maricopa County Juvenile On-Line Tracking System Database (N=325), social files
corresponding to these juveniles, and semi-structured interviews with 14 juvenile
probation officers. The focused independent variable for this study was family attributes
such as a dysfunctional family and parent’s criminal involvement. Probation officers
defined dysfunctional families as a single-parent or absent-parent family, poverty,
numerous children, substance use, abuse, and/or neglect. Several factors influenced
commitment decisions including the presence of a dysfunctional family. If a juvenile was
perceived to have a dysfunctional family, they were 2.570 times more likely to receive
out-of-home placement (p<.05). Additionally, juveniles with incarcerated fathers were
2.625 times more likely to receive out-of-home placements compared to youth without
incarcerated fathers (p<.05). When examining maternal incarceration, no significant
influence on the disposition was found. Aside from these main independent variables,
being Black increased the likelihood of out-of-home placement by 2.473 times (p<.10),
compared to White juveniles. Furthermore, foster-care increased the odds of this
disposition by 3.144 (p<.05). A prior record also had a positive influence on out-of-home
In a final analysis by Rodriguez et al. (2009) comparing probation versus
confinement (includes residential treatment facilities) dispositions, several factors were
found to have an effect on dispositional outcomes. For this analysis, several independent
variables were assessed including demographics (age, race, sex, and parent’s education
level), legal (assessing current and past legal involvement), individual (psychosocial
maturity, mental health problems, gang involvement, and IQ), and environmental factors
(parent and school-related factors). Two demographic variables were predictive: sex and
age. Being a male predicted confinement, while being older in age predicted probation.
Additionally, two legal factors predicted disposition outcomes. Prior court referrals
predicted a higher likelihood of confinement unless probation was received for a prior
offense, then probation was the highest disposition possibility. Furthermore, three
individual factors were significant. Drug abuse and drug dependency were predictors of
confinement and having a higher IQ was predictive of probation and less likely to receive
placement. Individuals scoring high in maturity were less likely to be transferred to adult
court. Several variables had no significant effect on the disposition decision. Serious
offenders and minorities were no more likely to be placed in confinement, with or
without controlling for other factors. Also, an adolescent’s psychosocial maturity and age
by maturity interaction did not influence a dispositional outcome in this study.
Overall, research on juvenile court disposition factors has been limited in many
ways, including examining demographics only using, perceptual surveys, and not
examining serious juvenile offenders. In order to build on this research, legal and
extralegal variables need to be analyzed along with an actual exploration of juvenile court
different light. Although these factors have been empirically supported as indicators of
juvenile offending, variables affecting juvenile judicial decisions have not been as
extensively examined. Therefore, the current analysis evaluated a variety of variables and
CHAPTER THREE: METHODS
In order to establish predictors of judicial decisions pertaining to juvenile offender state commitment, this analysis reviewed the Idaho Department of Juvenile Corrections Rule-19 state commitment screenings and judicial decisions to determine the relevant factors surrounding commitment. The Rule-19 consists of a screening process intended to collect a variety of information pertaining to the juvenile being adjudicated. The research question for this analysis is as follows: Do variables established as predictors of juvenile offending overlap as predictors of juvenile state commitment? The hypothesis therefore is: predictor variables for juvenile commitment will be similar to the variables established as juvenile offending predictors. The data focuses on pre-screen reports provided by the IDJC for the time period of 2016-2018.
Participants
longer terms ranging from several months to several years. In total, there are 270 state beds for juvenile offenders (State Facilities, n.d.).
The JCC-Lewiston is one of three juvenile correctional facilities in Idaho. Located in Lewiston, it provides beds to 36 medium-high risk male individuals ranging from ages 13-18 years old. Nampa, Idaho is home for the second IDJC facility, the JCC-Nampa. This location can host up to 84 medium-risk male and female juvenile offenders, with ages ranging from 13-20 years old. The final facility is the JCC-St. Anthony, the largest site in the IDJC located in St. Anthony, Idaho. Up to 138 high-risk juveniles, 13-19 years old, male and female, can be housed in the JCC-St. Anthony (State Facilities, n.d.). Participant Selection
A census of available juvenile state commitment screenings obtained from the Idaho Department of Juvenile Corrections was used in this analysis (N=338). These files included every juvenile who underwent a Rule-19 decision in the state of Idaho between January 2017-2018 for commitments and January 2016-2018 for non-commitments. All juveniles included in the files were between the ages of 12-18 years, and every individual was de-identified for the purpose of anonymity.
Dependent Variable
juveniles become eligible for commitment when their prior history or charged offense(s) contain any elements of four fundamental factors:
“violence that either did or could reasonably have resulted in serious bodily injury or death to others”;
“a sexual nature”;
“a demonstration of a wanton and reckless disregard for the property rights of other such that release constitutes a substantial risk to the community”; or
Independent Variables
When a juvenile becomes eligible for commitment to state custody, they then are subjected to a screening team. The responsibility of this screening team is to simply assist the court's decision in the juvenile's case. This team consists of employees from the County Juvenile Probation Office, the Idaho Department of Juvenile Corrections and the Idaho Department of Health and Welfare (Idaho Department of Juvenile Corrections, 2017). Additionally, other members of the community, such as the prosecuting attorney, the defense attorney, local school officials, parents or guardians of the juvenile and any other individual who is believed to be relevant to the juvenile’s screening are involved. When the screening is complete, a designee of the court, usually the county probation office, prepares a written report containing the team’s findings and recommendations. This report is called, the “pre-screen report” (Idaho Department of Juvenile Corrections, 2017). This pre-screen report is divided into six sections that address the various factors regarding the juvenile in question. These variables will be examined in terms of their relationship to the Rule 19 commitment hearing decision.
Original Model Variables Demographics
Offense History
Criminal history was measured by two variables: prior offenses and age at first offense. Prior offenses are measured numerically including the juvenile offending history (excluding status offenses). Age at first offense was also measured numerically in years (see Appendix A, Table 2.1for more information).
Education Variables
Two variables were also included for educational factors: special education and suspension and/or expulsion from school. Both factors were measured dichotomously as no or yes (see Appendix A, Table 2.1for more information).
Family Variables
Four factors were included for examination of family variables: history of abuse (sexual, physical, both, or witnessed abuse), history of neglect, adopted, and family criminality. All variables were measured dichotomously as either no or yes (see Appendix A, Table 2.1for more information).
Substance Abuse and Mental Health
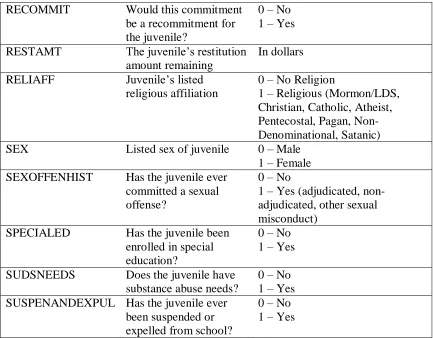
Substance abuse needs had one dichotomous measure by “does the juvenile have substance abuse needs?” with no or yes. Mental health needs were measured the same as substance abuse needs (see Appendix A, Table 2.1for more information).
Additional Variables Demographic
0 – Ada and Bonneville County and 1 – all other counties (see Appendix A, Table 2.1for more information).
Individual Factors
Most individual factors were included above, but one additional variable was also examined: medical need. Medical needs were measured dichotomously as either yes or no (see Appendix A, Table 2.1for more information).
Delinquency History
Five additional factors were included to examine the juvenile’s delinquency history: history of assaults, history of running away, gang activity, type of first offense committed, and history of sexual crimes. History of assaults and running away were both measured dichotomously as no or yes. Gang activity was categorized into non-gang association and gang involvement (admitted/claimed gang associations or
formal/active/jumped in/ involved in criminal activity). Type of first offense was also categorical and is based off the IDJC’s classifications (sex, persons, property, drug, society, other, status, and traffic) and history of sexual crimes is separated into no or yes (adjudicated, non-adjudicated, or other sexual misconduct) (see Appendix A, Table 2.1for more information).
Current Offense
as no or yes. The variable of recommitment was also measured dichotomously and the number of screening team members recommending commitment was measured numerically (see Appendix A, Table 2.1for more information).
Legal Variables
Five factors were included in measured legal variables: legal custody, number of detention placements, length of combined detention placements, number of
commitments, and length of combined commitment placements. Who has legal custody of the juvenile was measured categorically into five categories: father, mother, joint, other relative, other non-relative. Number of detention placement and number of
commitment placements was measured numerically, while length of detention placements was reported in days and length of commitment placements was in months (see Appendix A, Table 2.1for more information).
Statistical Analyses
CHAPTER FOUR: RESULTS
The results reported below include descriptive statistics pertaining to the characteristics of the sample such as age, sex, ethnicity/race, religious affiliation, and committing county. A model testing the hypothesis is presented below. Additionally, a series of binary logistic regressions examining variables beyond juvenile offending predictors, separated based on types of variables, were run to establish potential variable significance. From those significant variables, a final new model was formed and
analyzed for predictor variables of juvenile commitment. For each model, a test for multicollinearity was run and no signs of multicollinearity were found1.
Descriptive Statistics
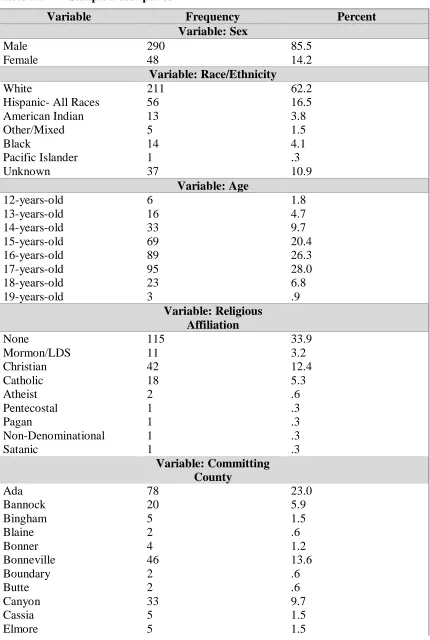
For this analysis, 339 juvenile Rule-19 screenings were examined. Out of these screenings, 48.5% (N=164) resulted in no commitment, while 51.5% (N=174) resulted in commitment to an Idaho state juvenile correctional facility. The majority of the sample was male (N=290, 85.5%)and White (N=211, 62.2%) with the next most frequent race/ethnicity being Hispanic-all races (N=56, 16. 5%).When examining age, the modal category was 15-17 years old (15, 20.4%; 16, 26.3%; 17, 28.0%) at the time the screening was given (x̅ = 15.83, σ= 1.392). For religious affiliation, nine categories were reported with ‘no religious affiliation’ (33.9%) as the modal category. These screenings came from a total of 33 counties throughout the state of Idaho (see Tables 1.1).
Table 1.1 Sample Descriptives
Variable Frequency Percent
Variable: Sex
Male 290 85.5
Female 48 14.2
Variable: Race/Ethnicity
White 211 62.2
Hispanic- All Races 56 16.5
American Indian 13 3.8
Other/Mixed 5 1.5
Black 14 4.1
Pacific Islander 1 .3
Unknown 37 10.9
Variable: Age
12-years-old 6 1.8
13-years-old 16 4.7
14-years-old 33 9.7
15-years-old 69 20.4
16-years-old 89 26.3
17-years-old 95 28.0
18-years-old 23 6.8
19-years-old 3 .9
Variable: Religious Affiliation
None 115 33.9
Mormon/LDS 11 3.2
Christian 42 12.4
Catholic 18 5.3
Atheist 2 .6
Pentecostal 1 .3
Pagan 1 .3
Non-Denominational 1 .3
Satanic 1 .3
Variable: Committing County
Ada 78 23.0
Bannock 20 5.9
Bingham 5 1.5
Blaine 2 .6
Bonner 4 1.2
Bonneville 46 13.6
Boundary 2 .6
Butte 2 .6
Canyon 33 9.7
Cassia 5 1.5
Franklin 2 .6
Fremont 5 1.5
Gooding 4 1.2
Idaho 3 .9
Jefferson 4 1.2
Jerome 6 1.8
Kootenai 33 9.7
Latah 2 .6
Lemhi 4 1.2
Lewis 1 .3
Lincoln 1 .3
Madison 1 .3
Minidoka 7 2.1
Nez Perce 5 1.5
Oneida 1 .3
Owyhee 2 .6
Payette 4 1.2
Power 3 .9
Shoshone 2 .6
Twin Falls 30 8.8
Valley 1 .3
Washington 1 .3
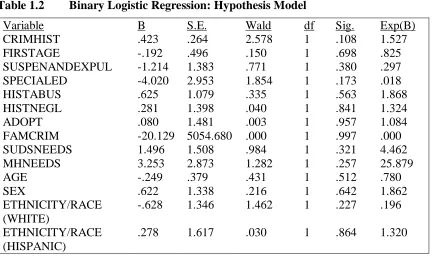
Hypothesis Model
A logistic regression model was run testing the hypothesis that predictive variables of juvenile offending would reflect predictive variables of juvenile
Table 1.2 Binary Logistic Regression: Hypothesis Model
Variable B S.E. Wald df Sig. Exp(B)
CRIMHIST .423 .264 2.578 1 .108 1.527
FIRSTAGE -.192 .496 .150 1 .698 .825
SUSPENANDEXPUL -1.214 1.383 .771 1 .380 .297
SPECIALED -4.020 2.953 1.854 1 .173 .018
HISTABUS .625 1.079 .335 1 .563 1.868
HISTNEGL .281 1.398 .040 1 .841 1.324
ADOPT .080 1.481 .003 1 .957 1.084
FAMCRIM -20.129 5054.680 .000 1 .997 .000
SUDSNEEDS 1.496 1.508 .984 1 .321 4.462
MHNEEDS 3.253 2.873 1.282 1 .257 25.879
AGE -.249 .379 .431 1 .512 .780
SEX .622 1.338 .216 1 .642 1.862
ETHNICITY/RACE (WHITE)
-.628 1.346 1.462 1 .227 .196
ETHNICITY/RACE (HISPANIC)
.278 1.617 .030 1 .864 1.320
Binary Logistic Regression Series
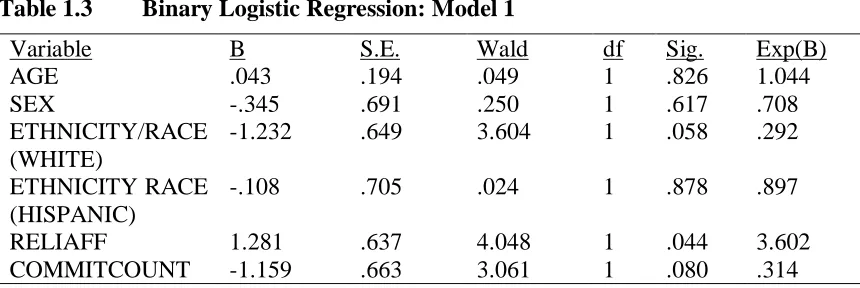
In order to develop a final predictive model, all variables were separated based on categorical representations. Separate binary logistic regressions were run to establish significant variables from each model. The first logistic regression was performed to test the effects of the demographic variables: sex, age, race/ethnicity, religious affiliation, and committing county on commitment decision. The demographic model (n=189) showed no statistical significance (χ² = 10.498, p=.105), explaining 11.6% of variance
(Nagelkerke R-Square) in the commitment decision and correctly classified 90.5% of cases. Additionally, religious affiliation (OR=3.602, p=.044) was statistically significant within this model (see Table 1.3). The odds of being committed for no religious
Table 1.3 Binary Logistic Regression: Model 1
Variable B S.E. Wald df Sig. Exp(B)
AGE .043 .194 .049 1 .826 1.044
SEX -.345 .691 .250 1 .617 .708
ETHNICITY/RACE (WHITE)
-1.232 .649 3.604 1 .058 .292
ETHNICITY RACE (HISPANIC)
-.108 .705 .024 1 .878 .897
RELIAFF 1.281 .637 4.048 1 .044 3.602
COMMITCOUNT -1.159 .663 3.061 1 .080 .314
The second logistic regression model was completed to assess individual factors. Variables included were history of suspension or expulsion, special education history, medical needs, mental health needs, substance abuse needs, history of abuse, history of neglect, adoption history, and family criminality. This individual model (n=152) was statistically significant (χ² = 26.577, p=.002). 47.5% of variance (Nagelkerke R-Square) in whether a participant was committed is explained in this model and 94.1% of cases were correctly classified. When examining the individual variables within this model, substance abuse needs (OR= 17.032,p= .014) was the only statistically significant variable in the model (see Table 1.4), with the presence of substance abuse need increasing the odds of being committed by 17.032 (1603.2%)when compared to the absence of substance abuse needs.
Table 1.4 Binary Logistic Regression: Model 2
Variable B S.E. Wald df Sig. Exp(B)
ADOPT -.500 1.191 .176 1 .675 .607
HISTNEGL -.437 1.299 .113 1 .736 .646
HISTABUS 1.961 1.102 3.165 1 .075 7.103
SUDSNEED 2.835 1.148 6.098 1 .014 17.032
MHNEEDS 18.157 2799.287 .000 1 .995 76809313.53
MEDNEEDS -1.382 .983 1.978 1 .160 .251
SUSPENANDEXPUL -31.537 5991.677 .000 1 .996 .000
SPECIALED -17.172 2799.287 .000 1 .995 .000
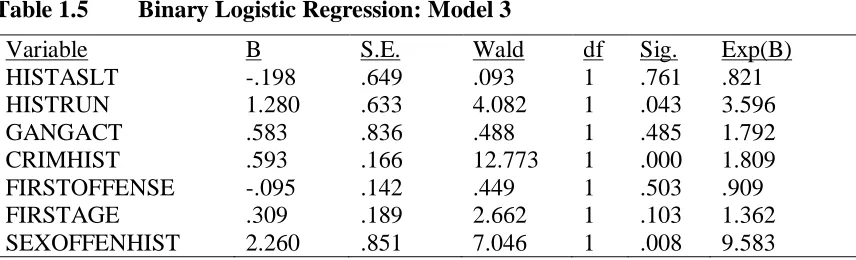
The third model contained variables related to the juveniles’ delinquency. This included history of assault, history of running away, gang activity, criminal history (excluding status offenses), type of first offense committed, age at time of first offense, and history of sexual crimes. Results indicated that the delinquency model (n=186) was statistically significant (χ² = 33.816, p=.000), explaining 36.3% of variance (Nagelkerke R-Square) in commitment decisions and correctly classifying 93% of cases. When examining the individual variables, three variables in the model were statistically significant (see Table 1.5). History of running away (OR=3.596, p=.043) increases the odds of being committed by 3.596 when compared to no history of running away. Additionally, criminal history (OR=1.809, p=.000) increased the likelihood of being committed. For every one unit increase in criminal history, the odds of being committed increased by 1.809 or 80.9%. A history of sexual misconduct (OR=9.583, p=.008) also increased the odds of being committed by 9.583 or 858.3%, compared to juveniles with no history of sexual misconduct.
Table 1.5 Binary Logistic Regression: Model 3
Variable B S.E. Wald df Sig. Exp(B)
HISTASLT -.198 .649 .093 1 .761 .821
HISTRUN 1.280 .633 4.082 1 .043 3.596
GANGACT .583 .836 .488 1 .485 1.792
CRIMHIST .593 .166 12.773 1 .000 1.809
FIRSTOFFENSE -.095 .142 .449 1 .503 .909
FIRSTAGE .309 .189 2.662 1 .103 1.362
SEXOFFENHIST 2.260 .851 7.046 1 .008 9.583
model (n=109) also was statistically significant (χ² = 13.180, p=.040), explaining 36.6% of variance (Naglekerke R-Square) and correctly classifying 95.4% of cases. When examining each variable individually, the number of screening team members recommending commitment was the only statistically significant variable for
commitment decision (OR= 2.170, p=.037) (see Table 1.6). For every one unit increase in recommended commitments, the odds of getting committed increased by 2.170 or 117%.
Table 1.6 Binary Logistic Regression: Model 4
Variable B S.E. Wald df Sig. Exp(B)
RESTAMT .000 .000 .041 1 .840 1.000
COMMSERV .791 138.697 .000 1 .995 2.207
PREDETENT .487 1.076 .205 1 .651 1.628
NUMRECCOM .775 .372 4.331 1 .037 2.170
COMMITOFFEN -.090 .331 .074 1 .786 .914
RECOMMIT 18.101 10222.754 .000 1 .999 72614649.62
The fifth model consisted of legal variables such as who has legal custody of the child, how many times they have been placed in detention, the combined length of their detention days, how many times they have been placed in commitment before, and the total length of time committed. This legal model (n=15) was excluded from the analysis due to the exceptionally low sample size.
Final Binary Logistic Regression Model
examination of these six variables, no variable created statistically significant results, producing a concern of error (see Table 1.7).
Table 1.7 Binary Logistic Regression: Final Model with Religious Affiliation
Variable B S.E. Wald df Sig. Exp(B)
HISTRUN 67.165 1954.507 .001 1 .973 1.477E+29
SEXOFFENHIST 122.694 3492.687 .001 1 .972 1.930E+53
CRIMHIST 13.039 479.990 .001 1 .978 459828.108
NUMRECCOM 37.056 1119.324 .001 1 .974 1.239E+16
SUDSNEEDS 96.108 2833.014 .001 1 .973 5.484E+41
RELIAFF 53.737 1731.737 .001 1 .975 2.176E+23
Table 1.8 Bivariate Logistic Regression: Final Model without Religious Affiliation
Variable B S.E. Wald df Sig. Exp(B)
HISTRUN 1.286 .697 3.401 1 .065 3.617
SEXOFFENHIST 3.064 .992 9.549 1 .002 21.417
CRIMHIST .388 .164 5.618 1 .018 1.474
NUMRECCOM .567 .201 7.972 1 .005 1.762
CHAPTER FIVE: DISCUSSION
strongly influences by these three factors when it comes to making a commitment decision.
In addition to these statistically significant findings, there are also variables that were found to have no significance, despite previous literature. Age when first offense was committed (p=.103) and mental health needs (p=.995) were shown to be not
statistically significant. Additionally, school factors also were shown to have no influence on the commitment decision with the variables of ever being suspended or expelled (p=.996) and history of special education (p=.995). Research has also consistently made known the strong influence of family factors, but these findings revealed no statistical significance for these factors. Ever being adopted (p=.675), experienced neglect (p=.736), experienced abuse (p=.075), and family criminality (p=.995) were shown to have no impact on the judge’s state commitment decision. Finally, demographic of the juvenile such as their age (p=.826), sex (p=.617), and ethnicity/race, were insignificant. These findings were most surprising for the variable ethnicity/race. When the reference group was White, p=.058, and when the reference group was Hispanic, p=.878. Therefore, despite racial disparities found in previous research, the juvenile’s ethnicity/race had no effect in this analysis.
Limitations
sections are required to be completed, leaving the remainder up to the discretion of the juvenile probation officer to provide. Therefore, for many variables, these results were significantly influenced by these missing cases and results should be examined with this limitation in mind. Moreover, the discretion of the forms may also affect the reliability and validity of the variables being examined.
Additionally, this data is from the Idaho Department of Juvenile Corrections and therefore should be generalized only in Idaho. Generalizing these findings beyond Idaho should be done cautiously. Finally, although every model has missing data, model five had an extremely small sample size of 15 which is too small to run a valid regression analysis.
Policy Implications
Future Research
With results indicating a strong significance of screening team member
REFERENCES
Adler, P. T., &Lotecka, L. (1973). Drug use among high school students: Patterns and correlates. International Journal of the Addictions, 8(3), 537-548.
Applegate, B. K., Turner, M. G., Sanborn Jr, J. B., Latessa, E. J., & Moon, M. M. (2000). Individualization, criminalization, or problem resolution: A factorial survey of juvenile court judges' decisions to incarcerate youthful felony offenders. Justice Quarterly, 17(2), 309-331.
Arnold, W. R. (1971). Race and ethnicity relative to other factors in juvenile court dispositions. American Journal of Sociology, 77(2), 211-227.
Barrett, D. E., Katsiyannis, A., Zhang, D., & Zhang, D. (2014). Delinquency and recidivism: A multicohort, matched-control study of the role of early adverse experiences, mental health problems, and disabilities. Journal of Emotional and Behavioral Disorders, 22(1), 3-15.
Beardslee, W. R., Son, L., & Vaillant, G. E. (1986). Exposure to parental alcoholism during childhood and outcome in adulthood: A prospective longitudinal study. The British Journal of Psychiatry, 149(5), 584-591.
Bishop, D. M., & Frazier, C. E. (1995). Race effects in juvenile justice decision-making: Findings of a statewide analysis. Journal of Criminal Law & Criminology, 86, 392.
Bishop, D. M., Leiber, M., & Johnson, J. (2010). Contexts of decision making in the juvenile justice system: An organizational approach to understanding minority overrepresentation. Youth Violence and Juvenile Justice, 8(3), 213-233. Brown, J. M., & Sorensen, J. R. (2014). Legal and extra-legal factors related to the
Casey, K., & Keilitz, I. (1990). Estimating the prevalence of learning disabled and mentally retarded juvenile offenders: A meta-analysis. In P. E. Leone (Ed.), Understanding troubled and troubling youth (pp. 82-101). Newbury Park, CA: Sage.
Cauffman, E. (2004). A statewide screening of mental health symptoms among juvenile offenders in detention. Journal of the American Academy of Child & Adolescent Psychiatry, 43(4), 430-439.
Colins, O., Vermeiren, R., Vreugdenhil, C., van den Brink, W., Doreleijers, T., & Broekaert, E. (2010). Psychiatric disorders in detained male adolescents: A
systematic literature review. The Canadian Journal of Psychiatry, 55(4), 255-263. Cottle, C. C., Lee, R. J., & Heilbrun, K. (2001). The prediction of criminal recidivism in
juveniles: A meta-analysis. Criminal Justice and Behavior, 28(3), 367-394. Craig, S. R., & Brown, B. S. (1975). Comparison of youthful heroin users and nonusers
from one urban community. International Journal of the Addictions, 10(1), 53-64. Cuellar, A. E., & Markowitz, S. (2015). School suspension and the school-to-prison
pipeline. International Review of Law and Economics, 43, 98-106.
Fader, J. J., Harris, P. W., Jones, P. R., & Poulin, M. E. (2001). Factors involved in decisions on commitment to delinquency programs for first-time juvenile offenders. Justice Quarterly, 18(2), 323-341.
Farrington, D. P., Jolliffe, D., Loeber, R., Stouthamer-Loeber, M., & Kalb, L. M. (2001). The concentration of offenders in families, and family criminality in the
prediction of boys' delinquency. Journal of Adolescence, 24(5), 579-596. Ferguson, T. (1952). The young delinquent in his social setting. A Glasgow study.
London: Published for the Nuffield Foundation by Geoffrey Cumberlege Oxford University Press.
Glueck, S., & Glueck, E. (1940). Juvenile delinquents grown up. N.Y.: Commonwealth Fund
Harrigfeld, S. (2017). Legislative update. Retrieved December 21, 2017, from http://www.idjc.idaho.gov/wp-content/uploads/2014/01/FY17-Legislative-Update.pdf
Hemphill, S. A., Toumbourou, J. W., Herrenkohl, T. I., McMorris, B. J., & Catalano, R. F. (2006). The effect of school suspensions and arrests on subsequent adolescent antisocial behavior in Australia and the United States. Journal of Adolescent Health, 39(5), 736-744.
Herz, D. C., Ryan, J. P., & Bilchik, S. (2010). Challenges facing crossover youth: An examination of juvenile‐justice decision making and recidivism. Family Court Review, 48(2), 305-321.
Hockenberry, S., & Puzzanchera, C. (2017). Juvenile court statistics 2014. National Center for Juvenile Justice. Retrieved December 11, 2017, from
https://www.ojjdp.gov/ojstatbb/njcda/pdf/jcs2014.pdf.
Hoeve, M., McReynolds, L. S., Wasserman, G. A., & McMillan, C. (2013). The influence of mental health disorders on severity of reoffending in juveniles. Criminal Justice and Behavior, 40(3), 289-301.
Idaho Department of Juvenile Corrections. (2017). Idaho Juvenile Corrections Act and Rules. Retrieved from State of Idaho Judicial Branch: Supreme Court website: http://www.idjc.idaho.gov/wp-content/uploads/2014/01/JCAandrules-July-2017.pdf
Idaho Department of Juvenile Corrections. (2016). Standards and Procedures for
Commitment to the Department of Juvenile Corrections. Retrieved May 21, 2018, from https://isc.idaho.gov/ijr19
Idaho Department of Juvenile Corrections. (n.d.). State Facilities. Retrieved December 22, 2017, from http://www.idjc.idaho.gov/state-facilities-2