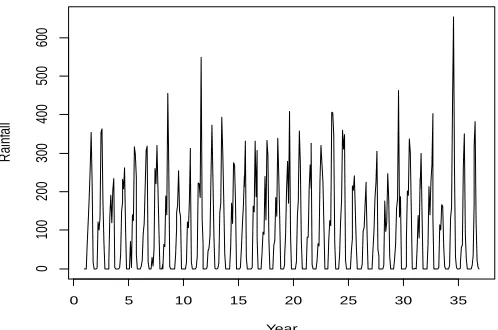
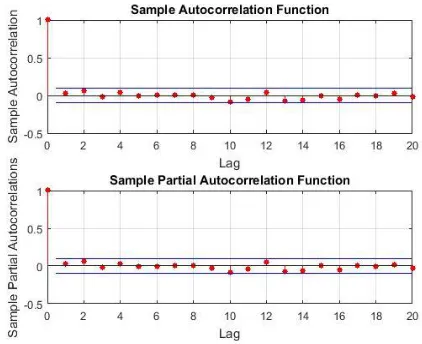
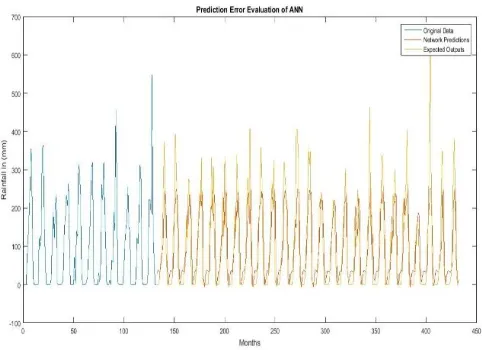
COMPARATIVE ANALYSIS OF THE PERFORMANCE OF ARTIFICIAL NEURAL NETWORKS (ANNs) AND AUTOREGRESSIVE INTEGRATED MOVING AVERAGE (ARIMA) MODELS ON RAINFALL FORECASTING
6
0
0
Full text
Figure
Related documents