An Asymmetric Index to Compare Trapezoidal Fuzzy
Numbers
Julio Rojas-Mora1and Jaime Gil-Lafuente2
1 Institute of Statistics
Faculty of Economics and Administrative Sciences Universidad Austral de Chile
Valdivia, Chile julio.rojas@uach.cl
2
Dpt. of Business Economics and Organization Faculty of Economics and Administrative Sciencies
Universitat de Barcelona Barcelona, Spain
j.gil@ub.edu
Abstract. In this paper, we present a tool to help reduce the uncertainty presented in the resource selection problem when information is subjective in nature. The candidates and the “ideal” resource required by evaluators are modeled by fuzzy subsets whose elements are trapezoidal fuzzy numbers (TrFN). By modeling with TrFN the subjective variables used to determine the best among a set of resources, one should take into account in the decision-making process not only their expected value, but also the uncertainty that they express. A mean quadratic distance (MQD) function is defined to measure the separation between two TrFN. It allows us to consider the case when a TrFN is wholly or partially contained in another. Then, for each candidate a weighted mean asymmetric index (WMAI) evaluates the mean distance between the TrFNs for each of the variables and the corresponding TrFNs of the “ideal” candidate, allowing the decision-maker to choose among the candi-dates. We apply this index to the case of the selection of the product that is best suited for a “pilot test” to be carried out in some market segment.
Keywords:Fuzzy sets, distance, resource selection, pilot test, subjective informa-tion, marketing.
1.
Introduction
Currently, companies that commercialize a broad range of products, sometimes with high product rotation, tend to have departments specializing in consistently providing techni-cally viable and economitechni-cally feasible ideas.
The “bank of ideas” that such organizations have produces a multitude of reference points for the delivery of new goods or services. Virtually, any previously screened idea may be of commercial interest, but many of the failures in its commercialization may arise from presenting it to the wrong kind of client. The design of a product must meet customer requirements, making it essential to carry out a post-design verification test with a sample of the intended market segment, before the product’s full-scale commercialization [18].
The suitability of these products is evaluated with subjective variables, which makes the application of techniques based on fuzzy subsets a straightforward matter.
By means of the theory of fuzzy subsets [22], we can select the best among a group of candidates when information is subjective in nature or comes from expert processed statistical data. As an example of this line of research, we can observe the work of Chen and Wang [6] and its application to search for the perfect home [7], the application to databases developed by Yang et al. [21], the process carried out by the International Olympic Committee for the selection of the venue of the 1st Summer Youth Olympic Games [11], and the evaluation of traffic police centers performance by Sadi-Nezhad and Damghani [17]. This process is based on the comparison between fuzzy numbers, a line of research that have been a cornerstone of the fuzzy sets theory, and of which we can cite the work, for example, of Tran and Duckstein [19], of Zeng and Guo [23], of Zhang, Zhang and Mei [24], of Lee, Pedrycz and Sohn [14], and of Guha and Chakraborty [10].
In this same line of research, we offer a mean quadratic distance (MQD) function between trapezoidal fuzzy numbers (TrFN) that allows us to consider the case when a TrFN is wholly or partially contained in another. In traditional distance functions between TrFN, when a fuzzy number is totally contained in another there is a distance between them, and this distance is symmetric. Nevertheless, in our index, the separation from contained to container is zero, as uncertainty will not allow us to distinguish between them. On the other hand, there is a distinction between container and contained, as some part of the former is beyond the limits of the latter. From this point of view, our MQD calculates the distance needed to “project” one fuzzy number into the another.
Then, the MQD is used for multi-criteria decision making analysis through a weighted mean asymmetric index (WMAI). We apply this index to model subjective information on candidate products for a “pilot test” that will be carried out in a market segment. Among them, there is the need to select the one that fits better to this market and that will help collect valuable information in order to introduce the best possible product. Both, the ideal product and the candidate products, are modeled using TrFN.
The remaining of this paper is organized as follows. Section 2 briefly describes some of the newest research made on ranking of fuzzy numbers. The theoretical framework of fuzzy sets and fuzzy numbers is laid out in Section 3. Our asymmetric index is described in Section 4. Section 5 contains the application to an example. Finally, we present some conclusions in Section 6.
2.
Recent work
Mashinchi [15], based on the evaluation of areas between fuzzy numbers in order to rank them.
3.
Fuzzy subsets and fuzzy numbers
In cases when information is subjective, models based on the theory of fuzzy subsets can help the decision maker in the evaluation of the alternatives. In this section, we will present the basic definitions of both, fuzzy sets and fuzzy numbers, that we will use throughout this paper.
Definition 1. A fuzzy subset A˜ can be represented by a set of pairs composed of the elementsxof the universal setX, and a grade of membershipµA˜(x):
˜
A={(x, µA˜(x))|x∈X , µA˜(x)∈[0,1]}. (1)
Definition 2. Anα-cut of a fuzzy subsetA˜is defined by:
Aα={x∈X: µA˜≥α}, (2)
i.e., the subset of all elements that belong toA˜at least in a degreeα.
Definition 3. A fuzzy subsetA˜is convex, iff:
λx1+ (1−λx2)∈Aα∀x1, x2∈Aα, α, λ∈[0,1], (3)
i.e., all the points in[x1, x2]must belong toAα, for anyα.
Definition 4. A fuzzy subsetA˜is normal, iff:
max (µA˜(x)) = 1, ∀x∈X. (4)
Definition 5. The core of a fuzzy subsetA˜is:
NA˜={x: µA˜(x) = 1}. (5)
Definition 6. A fuzzy numberA˜is a normal, convex fuzzy subset with domain inRfor
which:
1. x¯:=NA˜,card(¯x) = 1, and
2. µA˜(x)is at least piecewise continuous.
The mean value [25] x, also called maximum of presumption [13], identifies a fuzzy¯
Definition 7. A TrFN is defined by the membership function:
µA˜(x) =
x−x1
x2−x1, if x1≤x < x2
1, ifx2≤x≤x3
x4−x
x4−x3, if x3< x≤x4 0 otherwise.
(6)
A TrFN is represented by a 4-tuple whose first and fourth elements correspond to the ex-tremes from where the membership function begins to grow, and whose second and third components define the interval that limits the maximum of presumption, i.e.,
˜
A= (x1, x2, x3, x4).
4.
The asymmetric index
In the traditional distance functions between TrFN (based on Manhattan, Euclidean, and, in general, Minkowski’s distance functions), the distance between two TrFNs
˜
A = (a1, a2, a3, a4) andB˜ = (b1, b2, b3, b4), when the former is totally contained in the later, is different from zero.
Nevertheless, one should study the assumption that due to uncertainty the distance from contained to container should be zero, as it would be impossible to distinguish be-tween them. On the other hand, there is some value of distance bebe-tween container and contained, as some portion of the former is outside the limits of the later.
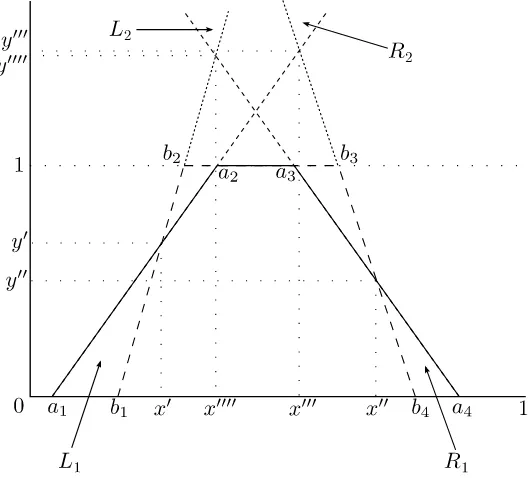
The objective is, therefore, to calculate a mean indexD( ˜A,B˜)that shows the distance needed to makeA˜⊆B. This function implies a sort of “projection” of˜ A˜intoB˜ in the four regions of the setZ={L1, L2, R1, R2}shown in Figure 1.
Definition 8. Given the set{x1x2, x2x3, . . . , xn−1xn, xnx1}, wherexixˆi is a segment
defined by the pointsPiandPˆi, whereasxiandxˆiare the abscissas of these points, we
will define the regionΛ as the area inscribed in the convex polygon composed by the elements of this set.
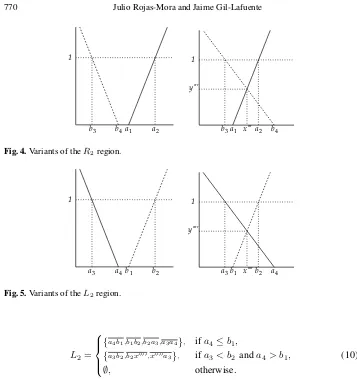
From this definition, we can say that the regions fromZare described as (see Figures 2, 3, 4 and 5):
L1=
a1b1, b1x0, x0a1 , ifa1< b1 anda2> b2,
a1b1, b1b2, b2a2, a2a1 ifa1≤b1 anda2≤b2,
a2b2, b2x0, x0a2 , ifa1> b1 anda2< b2,
∅, otherwise. (7) R1=
b4a4, a4a3, a3b3, b3b4 , ifb3≤a3andb4≤a4,
b4a4, a4x00, x00b4 , ifb3> a3 andb4< a4,
b3a3, a3x00, x00b3 , ifb3< a3 andb4> a4,
∅, otherwise. (8) R2=
{b4a1,a1a2,a2b3,b3b4}, ifa1≥b4,
{b3a2,a2x000,x000b3}, ifa1< b4 anda2> b3,
∅, otherwise.
Fig. 1.Regions where the index is calculated.
a1 b1xʹ 1
yʹ
b2a2 a1 b1 xʹ
1 yʹ
b2
a2 b1a1 xʹ
1
yʹ
b2 a2
Fig. 2.Variants of theL1region.
a4 b4
1
b3 a3 xʹ b4 a4
1
yʹ
b3
a3 ʹ
ʹ
a4 b4 xʹ
1
yʹ
b3a3 ʹ ʹ
a2 b3
1
b4a1 a1 b4
1
yʹ
a2 b3 xʹʹʹ ʹʹ
Fig. 4.Variants of theR2region.
a4 b1 1
b2
a3 b1 a4
1
yʹ
b2 a3 xʹʹʹʹ ʹʹʹ
Fig. 5.Variants of theL2region.
L2=
{a4b1,b1b2,b2a3,a3a4}, ifa4≤b1,
{a3b2,b2x0000,x0000a3}, ifa3< b2 anda4> b1,
∅, otherwise.
(10)
Proposition 1. Two TrFNA˜andB˜intersect at maximum four points(x0, y0),(x00, y00),(x000, y000), and(x0000, y0000)such that:
x0= a1b2−b1a2
a1−a2−b1+b2 ;y
0 = a1−b1
a1−a2−b1+b2, (11) x00= a3b4−b3a4
a3−a4−b3+a4 ;y
00= b4−a4
a3−a4−b3+a4, (12) x000= a2b4−a1b3
a2−a1+b4−b3 ;y
000 = b4−a1
a2−a1+b4−b3, (13) x0000= a4b2−a3b1
a4−a3+b2−b1 ;y
0000= a4−b1
a4−a3+b2−b1. (14)
Proof. Given the equation of the straight line:
y−y1= y2−y1
if segmentsa1a2andb1b2intersect at(x0, y0), then:
y0−0− 1−0 a2−a1(x
0−a1) =y0−0− 1−0
b2−b1(x
0−b1) (16)
x0−a1 a2−a1 =
x0−b1
b2−b1 (17)
(b2−b1−a2+a1)x0 =−a2b1+a1b1+a1b2−a1b1 (18) x0 = a1b2−a2b1
a1−a2−b1+b2. (19) Substituting (19) on the equation of the segmenta1a2, we solve fory0:
y0 =
a1b2−a2b1 a1−a2−b1+b2 −a1
(a2−a1)
(20)
=
−a2b1−a21+a1a2+a1b1 a1−a2−b1+b2
(a2−a1) (21)
= (a1−b1)(a2−a1)
(a1−a2−b1+b2)(a2−a1) (22)
= a1−b1
a1−a2−b1+b2
(23)
It is obvious that when segmentsa1a2andb1b2 are parallel, they will not intersect and, thus, the point(x0, y0)does not exists. This demonstration is equivalent for the other intersection points.
The first step in the calculation of our index is based on a mean quadratic distance (MQD) function that measures the separation of both TrFNs in the defined regions.
Definition 9. The MQD function between two TrFNA˜andB˜ for each regionζ ∈ Z is obtained through:
Dζ =
´βζ
αζ(bζ−aζ) 2dy
βζ−αζ
, (24)
whereaζ is the equation of the line that limitsζon the left side,bζ is the equation of the
line that limits this region on the right side, both expressed in terms ofy, and{αζ, βζ} ∈
[0,1], αζ ≤βζ, are the integration limits inythat we find through Figures 2, 3, 4 and 5,
and Proposition 1.
It seems evident that, from Definition 9, the area ofA˜contained inB˜ generates an MQD equal to zero, like, for example, that from segmenty0a2to segmenty0b2in Figure 1.
The closed form expressions of (24) for all regions are:
DL1 =
a2
1+a1a2+a22−2a1b1+b21−a1b2+b22−a2b1+b1b2−2a2b2
3 , ifa1≤b1anda2≤b2,
(a1−b1)2
3 , ifa1< b1anda2> b2, (a2−b2)2
3 , ifa1> b1anda2< b2,
0, otherwise.
DR1=
a23+a3a4+a42−2a3b3+b23−a3b4+b24−a4b3−2a4b4+b3b4
3 , ifb3≤a3andb4≤a4, (a4−b4)2
3 , ifb3> a3andb4< a4, (a3−b3)2
3 , ifb3< a3andb4> a4,
0, otherwise.
(26)
DR2=
a2
1+a1a2+a22−a1b3+b23−2a1b4+b24−2a2b3−a2b4+b3b4
3 , ifa1≥b4,
(a2−b3)2
3 , ifa1< b4anda2> b3,
0, otherwise.
(27)
DL2 =
a2
3+a3a4+a24−a3b1+b21−2a3b2+b22−a4b2−2a4b1+b1b2
3 , ifa4≤b1,
(a3−b2)2
3 , ifa3< b2anda4> b1,
0, otherwise.
(28) Definition 10. The mean asymmetric index between two TrFN obtained from (25), (26), (27) and (28) is:
DA,˜ B˜=
(q SD
N , ifN >0,
0, otherwise.
(29)
where:
SD=DL1+DL2+DR1+DR2,
N =1{DL1>0}+1{DL2>0}+1{DR1>0}+1{DR2>0}.
Remark 1. It is straightforward to observe thatN = 0 ⇐⇒ A˜⊂B. Thus˜ D( ˜A,B˜) = 0 ⇐⇒ A˜⊂B.˜
Remark 2. Because we would like to know the mean distance for the regions ofA˜ not covered byB, the resulting asymmetric index sometimes behaves as a hemimetric, which˜ implies:
1. ∃A˜ 6= B˜ : D( ˜A,B˜) = 0. Again, we would be saying that
˜
A⊂B˜ ⇐⇒ D( ˜A,B˜) = 0.
2. ∃A˜ 6= ˜B : D( ˜A,B˜) 6= D( ˜B,A˜). As a matter of fact, there are two cases where D( ˜A,B˜) =D( ˜B,A˜). Firstly, if for a given point:
b1∈R, B= (b1, b1+a4−a3, b1+a4−a2, b1+a4−a1), (30)
The mean asymmetric index based on the MQD function models the separation between the assessmentP˜igiven to some candidate resourceP, in any given characteristici, and
the required valueI˜iasked from an “ideal” candidateIin that same characteristic. We will
now define the weighted mean asymmetric index (WMAI) between all the characteristics evaluated in a candidate and the required levels of those characteristics.
Definition 11. The weighted mean asymmetric index (WMAI) betweenP˜={P1,˜ P2, . . . ,˜ P˜n}
andI˜={I1,˜ I2, . . . ,˜ I˜n}will be:
δ(P, I) =
n X
i=1 ωi·D
˜
Pi,I˜i
, (31)
whereω={ω1, ω2, . . . , ωn}is a vector of weights such thatPni=1ωi= 1andωi 6= 0.
5.
Application of the WMAI to the selection of a product for a pilot
test
In order to illustrate the application of the methodology, we will use an example based on the introduction of a dairy product into the market.
5.1. Description of the target market segment
The first thing that needs to be defined is a mathematical descriptor that numerically and accurately reflects the market segment that the Marketing Department is interested in reaching. A hypothetical dairy company wants to introduce a new product for the market segment defined by the following characteristics:
1. Health-conscious consumer. 2. With an age above 50 years.
3. Willing to pay a high price for healthier diary product.
4. Interested in new technology driven products, but not a consumer totally devoted to technology. \item Looking for a product that can be carried around and consumed at any time.
Given this information, the marketing department models the target segment with the fuzzy setS˜= ˜si, as we can see in Table 1.
Table 1.Target segment modeled as a fuzzy set.
c1 c2 c3 c4 c5
˜
S= (0.7,1) (0.6,1) (0.5,0.8,1) (0.7,0.8,0.9) (0.8,1)
Each fuzzy numbers˜irepresents an assessment of the ideal level that the target
seg-ment has on each one of the characteristics in the setC=ci. Both, the characteristics and
1. c1- Health-consciousness: A consumer is regarded as health-conscious if at least 70% of his food purchases are done taking health into consideration.
2. c2- Maturity: A consumer is considered mature if he has already lived more than 60% of his life expectancy.
3. c3- Price level: In this case, the consumer prefers to buy products in the top 50% of the price scale, with a maximum preference for products below 80%.
4. c4- Novelty of organoleptic or technological characteristics: the consumer prefers to buy a new product between 70 and 90% of the times, with a maximum of 80%, if new flavors or properties are also involved.
5. c5 - Easiness of transportation and consumption: when a consumer buys a product he prefers the top 80% in easiness of transportation and consumption, meaning he wants a product that can be carried around with no worries of spillage or spoilage, and that needs almost no additional procedures beyond opening its package for its consumption.
The characteristics will be weighted according to Table 2.
Table 2.Weights for the characteristics.
c1 c2 c3 c4 c5
ω= 0.1 0.35 0.25 0.25 0.05
5.2. Description of the candidates for the pilot test
The R&D department of the company has decided that the pilot test should be run with one of the following five products from the setP={P˜(j)}, j= 1, . . . ,5:
1. P˜(1)- Fructose sweetened soy yogurt with fruits: It has been assessed as a product with healthy properties above the average, without a defined age group, an average price, no real novelty in flavor or technology, and with the same limitations in trans-portability and consumption as most dairy products.
2. P˜(2)- Inulin sweetened Greek yogurt enriched with calcium: Being a Greek yogurt means this is a fatty product, although this is compensated with the substitution of complex sugars with inulin, so this product is considered to be middle-of-the-pack in healthiness, although with some uncertainty. Nonetheless, by enriching it with cal-cium, the targeted age group is certainly mature. Price, as well as its technological appeal due to the novelty of inulin, ranges in the middle upper echelon. Of course, a Greek yogurt is a product to keep refrigerated and eaten with a spoon, which limits its transportability.
many products. This product has the same problems of transportability described for the Greek yogurt.
4. P˜(4)- Digestion helping, cucumber yogurt soup withLactobacillus casei: A yogurt soup that is designed to aid digestion is regarded as an almost perfect element of a healthy diet. Age groups for this product go from middle-aged people to consumers entering maturity, as this flavor is not a favorite of younger groups and the introduc-tion of external bacteria might cause problems to older groups. Price is at the top of the line, as this is considered a gourmet food. Even if, technologically speaking, there is nothing new in this product, its flavor and concept are novel enough to put this product above average in preferences of people looking for new products with new flavors. Finally, easy consumption is not quite feasible with a soup.
5. P˜(5)- Energy boosting, tropical fruits flavored smoothie, enriched with amino acids and taurine: This product might only be considered healthy in the group of people that have an active night life, as well as for those that practice sports. This makes it more suitable for age groups ranging from young adulthood to early maturity. It is in the most expensive level, has a high impact on people looking for technology driven foods and is the easiest product to use, although it is recommended to consume it cold.
Thus, eachP˜(j)={µ˜
i,j}is a fuzzy set with the same number of elements asS, modeled˜
according to the information gathered as shown in Table 3.
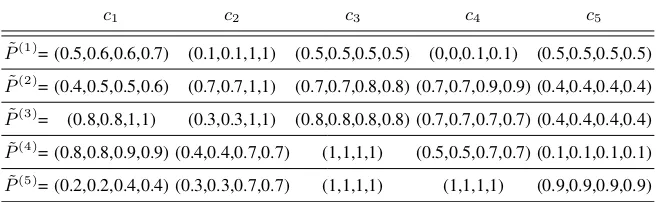
Table 3.Assessments made by the company experts on the new products.
c1 c2 c3 c4 c5
˜
P(1)= (0.5,0.6,0.6,0.7) (0.1,0.1,1,1) (0.5,0.5,0.5,0.5) (0,0,0.1,0.1) (0.5,0.5,0.5,0.5) ˜
P(2)
= (0.4,0.5,0.5,0.6) (0.7,0.7,1,1) (0.7,0.7,0.8,0.8) (0.7,0.7,0.9,0.9) (0.4,0.4,0.4,0.4) ˜
P(3)
= (0.8,0.8,1,1) (0.3,0.3,1,1) (0.8,0.8,0.8,0.8) (0.7,0.7,0.7,0.7) (0.4,0.4,0.4,0.4) ˜
P(4)= (0.8,0.8,0.9,0.9) (0.4,0.4,0.7,0.7) (1,1,1,1) (0.5,0.5,0.7,0.7) (0.1,0.1,0.1,0.1)
˜
P(5)= (0.2,0.2,0.4,0.4) (0.3,0.3,0.7,0.7) (1,1,1,1) (1,1,1,1) (0.9,0.9,0.9,0.9)
5.3. Results
We now proceed to calculate the distance between each one of the new products proposed for a test run and the target segment. The product closest to the target segment will be the one selected for this test.
δP˜(j),S˜=
5 X
i=1
ωiD(˜µi,j,˜si)
δ(P˜(1),S˜) =0.1·0.12+0.35·0.5+0.25·0.17+0.25·0.7+0.05·0.3
δ(P˜(2),S˜) =0.1·0.21+0.35·0+0.25·0.06+0.25·0.06+0.05·0.4
= 0.07.
δ(P˜(3),S˜) =0.1·0+0.35·0.3+0.25·0+0.25·0.06+0.05·0.4
= 0.14.
δ(P˜(4),S˜) =0.1·0+0.35·0.2+0.25·0.12+0.25·0.18+0.05·0.7
= 0.18.
δ(P˜(5),S˜) =0.1·0.41+0.35·0.3+0.25·0.12+0.25·0.15+0.05·0
= 0.21.
As we can see, the product closest to the market segment targeted with our pilot test is the Greek yogurt, a product that meets most of the requirements even if transportability is not a distinguished feature. The chocolate pudding is the closest competitor to the Greek yogurt, but seems that it would need a strong marketing campaign to introduce it in the age group of the target segment. The worst suited is the soy yogurt, maybe because it is a generic product that can be used as a baseline, to check how well targeted are other products.
We can present the results in terms of preference using the precedence operator:
˜
P(1) ≺P˜(5)≺P˜(4)≺P˜(3)≺P˜(2).
This means that the Greek yogurt is the product best suited for a test run, then the chocolate pudding, the cucumber yogurt soup, the energy boosting smoothie, and the soy yogurt, respectively.
6.
Conclusions
In this work, we presented a mean quadratic distance (MQD) function that calculates the distance needed to have one TrFN contained by another. This MQD function generates a distance of magnitude zero for the areas of the first TrFN overlapped by the second, while considering distances bigger than zero for those non-overlapped.
By calculating the MQD over these non-overlapped regions, we obtain a weighted mean asymmetric index (WMAI) of separation between two vectors of TrFN. The WMAI, calculated from assessments given over a set of characteristic of a group of candidates to the “ideal” requirements on those characteristics, is then obtained and used as the decision variable.
features, some close to the target segment and some others far from it, to take a decision accordingly. A product test run might be an expensive affair, and as such, the decision on which product use for it has to be as fully supported as possibly.
A good feature of this methodology is that statistical information, adequately trans-formed or processed by experts, can be used together with subjective information, usually disregarded by statistical methods, to get a more comprehensive view of the situation and give better help to the decision maker.
References
1. Allahviranloo, T., Abbasbandy, S., Saneifard, R.: An approximation approach for ranking fuzzy numbers based on weighted interval-value. Mathematical and Computational Applica-tions 16(3), 588 (2011)
2. Asady, B.: The revised method of ranking lr fuzzy number based on deviation degree. Expert Systems with Applications 37(7), 5056–5060 (2010)
3. Asady, B.: Revision of distance minimization method for ranking of fuzzy numbers. Applied Mathematical Modelling 35(3), 1306–1313 (2011)
4. Asady, B., Zendehnam, A.: Ranking fuzzy numbers by distance minimization. Applied Math-ematical Modelling 31(11), 2589–2598 (2007)
5. Chen, S.H.: Ranking fuzzy numbers with maximizing set and minimizing set. Fuzzy sets and Systems 17(2), 113–129 (1985)
6. Chen, S.H., Wang, C.C.: Representation, ranking, distance, and similarity of fuzzy number-swith step form membership function using k-preference integration method. IFSA World Congress and 20th NAFIPS International Conference, 2001. Joint 9th 2, 801–806 (2001) 7. Chen, S.H., Wang, C.C.: House selection using fuzzy distance of trapezoidal fuzzy numbers.
In: Proceedings of the Sixth International Conference on Machine Learning and Cybernetics. Hong Kong (2007)
8. Chou, S.Y., Dat, L.Q., Yu, V.F.: A revised method for ranking fuzzy numbers using maximizing set and minimizing set. Computers & Industrial Engineering 61(4), 1342–1348 (2011) 9. Dubois, D., Prade, H.: Fuzzy real algebra: some results. Fuzzy Sets and Systems 2, 327–348
(1979)
10. Guha, D., Chakraborty, D.: A new approach to fuzzy distance measure and similarity measure between two generalized fuzzy numbers. Applied Soft Computing 10(1), 90–99 (2010) 11. IOC Panel of Experts: 1st Summer Youth Olympic Games in 2010. Tech. rep., IOC (2007) 12. Jain, R.: Decision making in the presence of fuzzy variables. IEEE Transactions on Systems,
Man and Cybernetics 6, 698–702 (1976)
13. Kaufmann, A., Gupta, M.M.: Introduction to Fuzzy Arithmetic. Van Nostrand Reinhold, New York (1985)
14. Lee, S., Pedrycz, W., Sohn, G.: Design of similarity and dissimilarity measures for fuzzy sets on the basis of distance measure. International Journal of Fuzzy Systems 11(2), 67–72 (2009) 15. Nejad, A.M., Mashinchi, M.: Ranking fuzzy numbers based on the areas on the left and the right
sides of fuzzy number. Computers & Mathematics with Applications 61(2), 431–442 (2011) 16. Rezvani, S.: A new method for ranking in perimeters of two generalized trapezoidal fuzzy
numbers. International Journal of Applied 2(3), 85–92 (2012)
17. Sadi-Nezhad, S., Damghani, K.K.: Application of a fuzzy topsis method base on modified preference ratio and fuzzy distance measurement in assessment of traffic police centers perfor-mance. Applied Soft Computing 10(4), 1028–1039 (2010)
19. Tran, L., Duckstein, L.: Comparison of fuzzy numbers using a fuzzy distance measure. Fuzzy Sets and Systems 130, 331–341 (2002)
20. Wang, Z.X., Liu, Y.J., Fan, Z.P., Feng, B.: Ranking< i> l</i>–< i> r</i> fuzzy number based on deviation degree. Information Sciences 179(13), 2070–2077 (2009)
21. Yang, M.S., Hung, W.L., Chang-Chien, S.J.: On a Similarity Measure between LR-Type Fuzzy Numbers and Its Application to Database Acquisition. International Journal of Intelligent Sys-tems 20(10), 1001–1016 (2005)
22. Zadeh, L.A.: Fuzzy sets. Information and Control 8(3), 338–353 (1965)
23. Zeng, W., Guo, P.: Normalized distance, similarity measure, inclusion measure and entropy of interval-valued fuzzy sets and their relationship. Information Sciences 178, 1334–1342 (2008) 24. Zhang, H., Zhang, W., Mei, C.: Entropy of interval-valued fuzzy sets based on distance and its
relationship with similarity measure. Knowledge-Based Systems 22(6), 449–454 (2009) 25. Zimmermann, H.: Fuzzy Sets: Theory and its Applications. Springer, 4th edn. (2005)
Julio Rojas-Mora has a systems engineering degree from the University of Los An-des (Venezuela). His academic career incluAn-des an Advanced Studies Diploma (D.E.A.) in Statistics and Operations Research from the Universidade de Santiago de Compostela (Spain) in 2006, and a Ph.D. from the Business Economics and Organization Department of the Universitat de Barcelona (Spain) in 2011. After finishing a postdoctoral fellow-ship at the UMR Espace CNRS of the Université d’Avignon, he joined the Institute of Statistics of the Universidad Austral de Chile. His research focuses on the comparison of subjectively evaluated individuals using the fuzzy sets theory.
Jaime Gil-Lafuenteis a Professor at the Universitat de Barcelona where he obtained his PhD in Business Administration. He has published more than 250 articles in journals, books and conference proceedings, including journals such as Advances in Consumer Re-search or Annals of Operations ReRe-search. He has participated in a wide range of scientific committees and as a reviewer in international journals. He is an academician of the Royal Academy of Doctors of Spain, the Academy Delphinale of France and the Illustrious Iberoamerican Academy of Doctors of Mexico.